J. Cent. South Univ. (2017) 24: 599-608
DOI: 10.1007/s11771-017-3461-5

Noise-assisted MEMD based relevant IMFs identification and EEG classification
SHE Qing-shan(佘青山), MA Yu-liang(马玉良), MENG Ming(孟明), XI Xu-gang(席旭刚), LUO Zhi-zeng(罗志增)
Institute of Intelligent Control and Robotics, Hangzhou Dianzi University, Hangzhou 310018, China
 Central South University Press and Springer-Verlag Berlin Heidelberg 2017
Abstract: Noise-assisted multivariate empirical mode decomposition (NA-MEMD) is suitable to analyze multichannel electroencephalography (EEG) signals of non-stationarity and non-linearity natures due to the fact that it can provide a highly localized time-frequency representation. For a finite set of multivariate intrinsic mode functions (IMFs) decomposed by NA-MEMD, it still raises the question on how to identify IMFs that contain the information of inertest in an efficient way, and conventional approaches address it by use of prior knowledge. In this work, a novel identification method of relevant IMFs without prior information was proposed based on NA-MEMD and Jensen-Shannon distance (JSD) measure. A criterion of effective factor based on JSD was applied to select significant IMF scales. At each decomposition scale, three kinds of JSDs associated with the effective factor were evaluated: between IMF components from data and themselves, between IMF components from noise and themselves, and between IMF components from data and noise. The efficacy of the proposed method has been demonstrated by both computer simulations and motor imagery EEG data from BCI competition IV datasets.
Key words: multichannel electroencephalography; noise-assisted multivariate empirical mode decomposition; Jensen-Shannon distance; brain-computer interface
1 Introduction
Brain-computer interface (BCI) is able to establish a direct communication channel between the human brain and a machine which does not require any motor activity [1]. Different brain imaging techniques have been applied to BCI, among which electroencephalography (EEG) is the most commonly used method due to its non-invasive acquisition, high temporal resolution, ease of use and low cost [2]. The motor-imagery-based non-invasive BCI systems have provided users the ability to control movements of a computer cursor, interactive robotic wheelchairs and explore virtual environments [3]. The EEG measurement is a high-dimensional scalp measurement, thus it reflects the global cerebral electrophysiological activity. At the same time, it results in two weaknesses [4]. On one hand, EEG is inherently multivariate and exhibits a high correlation between the measured potentials at different electrodes (or channels), therefore it is required to be analyzed across channels synchronously. On the other hand, the observed data are of low amplitude and sensitive to noise from biological, environmental and instrumental origins. Due to the inherent characteristics of multichannel EEG signals, adequate signal processing techniques are required to address the problems of noise cancelation, feature extraction and classification.
Some typical time-frequency analysis methods have been used to capture local features of EEG signals. For example, such short-time Fourier transform, Wigner- Ville distribution, and wavelet transform, whereas predefined basis functions need to be chosen according to prior knowledge. In 1998, HUANG et al [5] proposed a fully data-driven and adaptive analysis method, namely, empirical mode decomposition (EMD), which is widely applied in the fields of biomedical signal processing [6, 7]. It decomposes an input signal into a set of intrinsic mode functions (IMFs) which represent the natural oscillatory modes consisting in the raw signal. However, it has some limitations in processing multichannel data because the IMFs decomposed from different channel data are difficult to match in number and frequency [8, 9]. To address this problem, REHMAN et al [10] designed multivariate EMD (MEMD) to ensure proper decomposition of multichannel signals. Despite its capability to find joint information between multiple channels, it is encountered with the mode-mixing problem as the same as that of EMD. The mode-mixing across basis functions is mainly manifested by a single IMF either carrying signals of disparate scales, or a single mode residing in more than one IMF component [8]. Recently, REHMAN et al [11] have combined the advantages of ensemble EMD and MEMD, and introduced a noise-assisted MEMD (NA-MEMD) method which makes use of the dyadic filter bank property of EMD on white noise and is capable of reducing the mode-mixing problem significantly, and achieved better results in the classification of motor imagery EEG signals [12].
Although EMD and its extended versions have been widely researched and applied, there have been a few studies on the selection of informative IMF levels (or scales). Given a set of extracted IMFs, it is a worthy question to discriminate between relevant and irrelevant IMFs. In order to identify the IMFs containing relevant information, conventional approaches make use of prior knowledge in task-related domains. The significant IMFs are selected by calculating the average power spectra of the first some IMFs and comparing its frequency distributions with mu and beta rhythms [12]. Similarly, for neuronal oscillatory activities, CHANG et al [13] chose the relevant IMFs by examining the mean frequency of IMFs within the beta band. Recently, HU et al [14] proposed a statistical procedure to recognize information-bearing IMFs based on the similarity measure between the IMFs from the data and noise channels.
In this work, a novel identification method of relevant IMFs is proposed based on NA-MEMD and Jensen-Shannon distance measure. The proposed method is within the framework of NA-MEMD, using Jensen- Shannon distance (JSD) to identify the most significant IMF scales. An effective factor of informative IMFs is defined by concerning three kinds of JSDs at each decomposition scale: between the IMFs from data and themselves, between the IMFs from noise and themselves, and between the IMFs from data and noise. The experiments on simulations and motor imagery EEG data from BCI Competition IV Dataset I have demonstrated the effectiveness of the proposed method.
2 Noise-assisted multivariate empirical mode decomposition
The MEMD method is a multivariate extension of EMD. Standard EMD decomposes a signal into a finite set of oscillatory components called IMFs which represent the underlying temporal scales within the input data, by means of an iterative process called sifting algorithm [5]. However, EMD considers only one- dimensional signals, and is prone to mode-mixing because of the overlapping of IMF spectra [8, 9]. For multivariate signals, e.g., EEG data collected from multiple channels, MEMD is explored by generating multi-dimensional envelopes, then taking signal projections along different directions, and finally averaging these projects to obtain the local mean [10].
Given that  denotes an n-variate signal, it can be decomposed into J scales of IMFs by MEMD,
 , where dj(t) denotes the jth IMF of y(t) and r(t) represents the n-variate residual. Let
 be the direction vectors along the directions given by the angles θk, where
  are defined on an (n-1) sphere. The MEMD algorithm [9] is processed in the following steps.
1) Create a suitable set of direction vector  on an (n-1) sphere using a sampling scheme based on the Hammersley sequence.
2) Calculate the kth projection  of the input signal
  along the direction vector , for all k (k=1, 2, …, K where K is the total number of direction vectors), giving the set of projections
3) Find the time instants  corresponding to the maxima of the projected signals
4) Interpolate  to obtain the multivariate envelopes
  for all k.
5) For a set of K direction vectors, estimate the mean of the envelopes by
6) Extract the detail dj(t) using  j=1, 2, …, J, where J denotes the maximum number of decomposition scales.
7) Judge whether dj(t) fulfills the stoppage criterion for an IMF. If the condition is met, then dj(t) is regarded as an IMF component, and the residual rj(t) is calculated by  and we apply steps 2)-7) to rj(t); otherwise, apply the above steps 2)-6) to dj(t) repeatedly.
Despite of its validity in processing multivariate non-stationary signals, MEMD inherits a degree of mode-mixing [9], and hence recently the noise-assisted MEMD (NA-MEMD) [11] is proposed by virtue of adding white noise as additional channels similar to EEMD. NA-MEMD explores both the benefits of quasi-dyadic filter bank structure of MEMD on white noise, and the extra added realizations of white noise guaranteeing the reparability of the IMFs from the signal and noise channels. Given an n-channel input signal, the details of the NA-MEMD algorithm are described as follows. Firstly, m-channel noise channels are generated using uncorrelated Gaussian white noise time series which has the same length as that of the input. Next, (n+m)-channel composite data are obtained by adding the noise channels to the input multivariate signal. Thirdly, the composite data are decomposed by the MEMD algorithm, to obtain multivariate IMFs. Finally, a set of n-channel IMFs corresponding to the original signal are generated, by discarding the m-channel IMFs corresponding to the noise from the resulting (n+m)- channel IMFs.
3 Proposed method for identifying relevant IMFs
Given a set of multivariate IMFs decomposed by NA-MEMD, it is a key step to recognize the suitable IMF scales bearing significant information associated with the EEG activities during motor imagery. On each scale, the chosen IMFs are added together to obtain the reconstructed signals, on which the underlying features are then extracted and classified. Aiming at the question, a novel identification method of relevant IMF scales is proposed based on Jensen-Shannon distance metric in this section.
3.1 Jensen-Shannon distance
In probability theory and statistics, Jensen-Shannon distance (JSD) is one of the most popular methods to measure the similarity between two probability distributions. JSD is essentially a symmetrized and smoothed version of Kullback-Leibler (KL) divergence in the measure of information theory [15]. It has good mathematical properties such as the non-negativity, symmetry, and the triangle inequality [16]. Consequently, JSD is employed as a distance metric between the corresponding probability distribution functions of IMFs related to the activities of motor imagery EEG.
Consider two random discrete variables X and  with the corresponding probability function P and Q. As a divergence measure, KL divergence is usually used to measure the similarity between two probability distributions, defined as
 (1)
(1)
It can be seen that the KL divergence is a convex function of pi. It remains nonnegative, and equals zero only when pi=qi. However, KL divergence is not a distance metric because it is not symmetric and does not meet with the condition of the triangle inequality.
In information theory, Shannon entropy describes the uncertainty of a random variable, denoted as
 (2)
(2)
and then consider a mixture of probability distributions  where
where  and βi≥0. Substituting it into Eq. (2), the entropy function is rewritten as
 (3)
(3)
On the basis of the above-mentioned entropy function, Jensen-Shannon divergence DJS [15] associated with the mixture is defined as

 (4)
(4)
By setting  Eq. (4) is reduced to the following distance measure,
 (5)
(5)
where DKL represents the KL divergence between two probability distributions. Despite the distance measure being positive and symmetric, it still does not satisfy the triangular inequality.
By taking square root of Eq. (5), the Jensen-Shannon distance (dJS) [16] is defined as
 (6)
(6)
where  equals zero if P=Q, and it assumes its maximum value when P and Q are two distinct deterministic distributions.
3.2 Identification of relevant IMF scales
JSD is used as the similarity measure in this work. First, three kinds of JSDs are calculated at each decomposition scale, i.e., between the IMFs from data and themselves, between the IMFs from noise and themselves, and between the IMFs from data and noise. Secondly, an equation of effective factor is proposed on the basis of these computed JSDs. Finally, the effective factors are used to rank the significance of the IMFs at all scales.
Given an n-variate input signal 
 adding an m-variate uncorrelated white Gaussian noise
  to form the composite data
  and the IMF component at the jth scale is denoted as
  j=1, 2, …, J. The detailed steps of the proposed identification method are described as follows.
1) Compute respectively the JSD  between the IMF component
  at the jth scale from the ith channel of the input yi(t) and its raw signal, i=1, 2, …, n.
2) Calculate respectively the JSD  between the IMF component
  at the jth scale from the kth channel of the noise zk(t) and its original noise, k=1, 2, …, m.
3) Obtain respectively the JSD  between the IMF component at the jth scale from the ith channel of the input yi(t) and the IMF component at the jth scale from the kth channel of the noise zk(t).
4) Construct the effective factor of the IMF component at the jth scale, defined as
 (7)
(7)
where the log operation in the left side of Eq. (7) can ensure that the effective factors are nonnegative.
On the right side of Eq. (7), the first part represents the average JSD between the IMFs on the jth scale from the composite data and its raw data, and the second part represents the mean value of the JSDs between the IMFs at the jth scale from the input signal and noise. In accordance with the definition of JSD, an IMF component is regarded to be relevant, and therefore the first part of Eq. (7) is supposed to be smaller, and the second one is larger. Consequently, the IMF scales with smaller effective factor are chosen as significant scales from which the IMF components bear relevant information.
4 Results and discussion
4.1 Simulation experiment
In order to verify its effectiveness, the proposed method is first performed on the simulated data. In this simulation, the data are generated as done [14]. A 3-channel synthetic signal  with the length N=1000 and sampling rate fs=1000, is given as follows:
 (8)
(8)
where 

 and q1(t), q2(t), q3(t) represent white Gaussian noises. Concerned with the behavior of the NA-MEMD algorithm under the number and noise power of noise channels discussed [9], there is no limit on the number of noise channels, while the data-driven ability of NA-MEMD is affected by excessive noise levels. As a rule of thumb, the variance of noise is required to be within 2%-10% of the variance of the input signal.
1) To illustrate the analysis ability of NA-MEMD on the decomposition of a synthetic multivariate signal. First, let the signal-noise ratio (SNR) of q1(t), q2(t), q3(t) be 30 dB, and 15 additional noise channels with SNR 6.1 dB are added to the input to form the composite data. Next, NA-MEMD is used to decompose the composite data into a set of IMFs, and then the effective factors of different scales are calculated based on the obtained IMFs. For the simulated model, 100 trials are generated, and the statistical performance is assessed. A group of obtained multi-dimensional IMFs are shown in Fig. 1. The top row in each column expresses the original 3-channel signals and one-channel noise which is randomly chosen for illustration. The first six IMFs are denoted as d1-d6, and the residuals are represented as r which is the sum of the remaining IMFs. It is observed that the underlying frequency components occur at the 4th-6th IMFs respectively. The d4, d5 and d6 components shown in the 1st column correspond to three frequencies 50 Hz, 26 Hz and 11 Hz consisting in x(t). The d4 and d6 components in the 2nd column represent two frequencies 50 Hz and 11 Hz of y(t). The d4 and d5 components in the 3rd column reflect two frequencies 50 Hz and 26 Hz of z(t). It is also seen that the IMFs with the same frequency occur on the same scale for each channel, and the same number of IMFs are yielded for all channels facilitating direct multichannel modeling. Similar to EMD, the frequencies of the decomposed oscillatory modes by NA-MEMD are ranked in descending order which is helpful for data analysis.
2) To study the validity of the proposed algorithm of effective factors based on JSD, the effective factors of all IMF scales are computed from 100 trails. Its statistical results of the first ten scales are illustrated in Fig. 2. It shows the numerical distribution characteristics of the effective factors at each scale. As can be seen from the median, quartiles and inter-quartile range in the box-plots, the effective factors at the 4th-6th scales have smaller values with good statistical properties.
Table 1 further gives a set of effective factors calculated based on the first ten scales of IMFs in one trial. The 4th-6th IMFs produce the smallest effective factors, in consistence with the statistical results obtained from multiple tests as shown in Fig. 2. According to the proposed method, the IMFs at the 4th-6th scales can be regarded to be relevant, and the identification result is consistent with the scales containing true frequency components in Fig. 1.
3) To evaluate the effects of noise with different SNRs on the proposed method, it is necessary to verify this performance since the measured data are often suffered from noise contamination in the real applications. In order to facilitate performance comparison, two kinds of error are defined as follows: 1) Type I error, i.e., failure to identify the true IMF scales of relevant information; 2) Type II error, i.e. improperly recognition of the true IMF scales of relevant information.
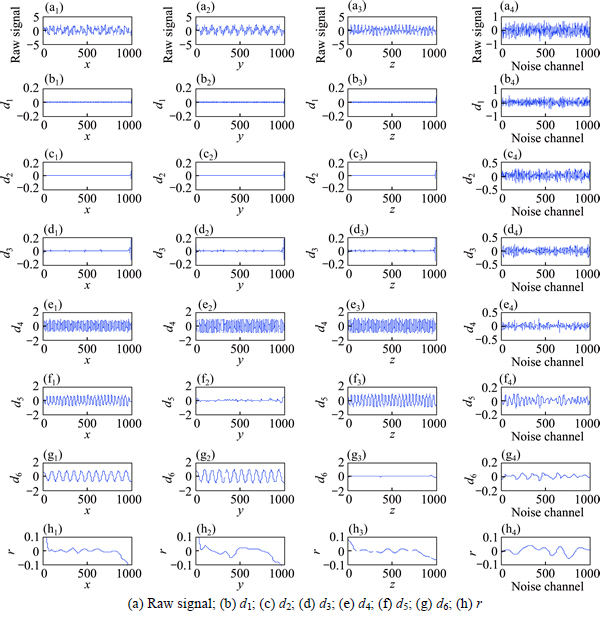
Fig. 1 Decomposition results of simulated data by NA-MEMD:
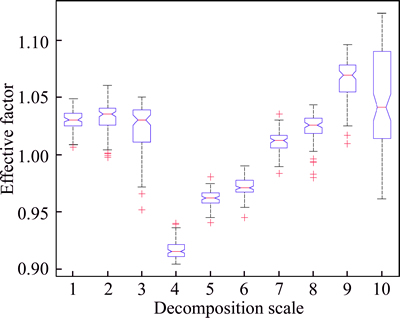
Fig. 2 Statistical results of effective factors from multiple trials
Groups of 3-channel input signal with different SNRs are generated by Eq. (8), combined with separate 15 noise channels (SNR 6.1 dB). There are 12 SNR levels, at each of which 100 trials are done repeatedly. In each trial, the SNR of the white noise contained in the input signal is first altered, and then the relevant IMF scales are respectively identified adopting Jensen- Shannon distance (JSD), Wasserstein distance (WD) [14] and Hausdorff distance (HD) [17]. Corresponding type I and II errors are calculated. Finally, the results from two methods are compared, depicted in Fig. 3.
Table 1 Effective factor at each scale of IMFs
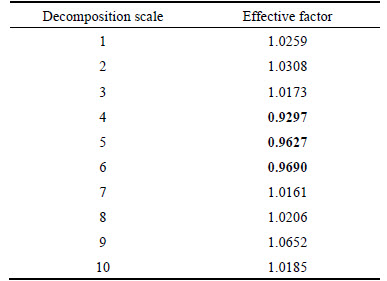
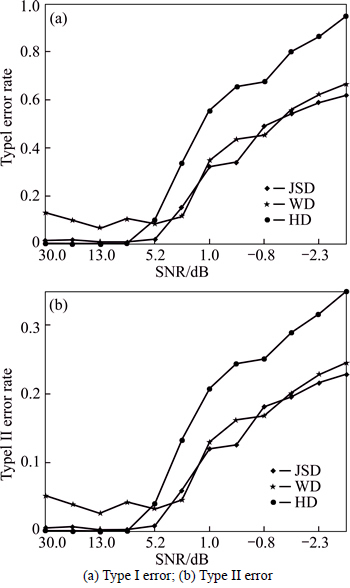
Fig. 3 Statistical results of proposed method at different SNRs:
As shown in Fig. 3, there are low rates of Type I and II error at higher SNRs for both two methods which can accurately identify the relevant IMF scales. As compared with other identification approaches, the proposed method has slightly lower error rates than WD, yet both of them obtain better performance than HD at smaller SNRs. With the decrease of SNR, three kinds of error rates obtained from these methods change slowly at the range of 20-3 dB, and then grow in the region of 3 dB to -3 dB, where the rate of Type I error has an obvious augment and that of Type II error increases gently. The results show that the proposed method achieves smaller Type II error rate even at lower SNRs, and has the capability to resist noise.
4.2 Motor imagery EEG data
To further assess the proposed algorithm, this work selects BCI Competition IV Dataset I [18] provided by Berlin BCI research center. EEG data were recorded using 59 electrodes from four healthy participants (a, b, f, g). Subjects a and f performed motor imagery tasks of left hand and foot, while b and g selected the tasks of left hand and right hand. Each subject performed a total of 200 trials in which each task was imagined 100 times. As recommended in Ref. [12], 11 channels are employed as experimental data, i.e., “FC3”, “FC4”, “CZ”, “C3”, “C4”, “C5”, “C6”, “T7”, “T8”, “CCP3”, and “CCP4” in line with the 10-20 system.
It has already been studied that the most effect of motor imagery is a modulation of SMRs [19]. Differential modulations of the SMRs can be decomposed using the NA-MEMD method with locally orthogonal and narrowband IMF bases. Classification procedure of motor imagery tasks involves feature extraction and classification of EEG. The common spatial patterns (CSP) algorithm [20] is used for feature extraction since it can construct new time series whose variances are optimal for the discrimination of two populations of data. For classification, support vector machine (SVM) is well-suited due to its robustness to outliers and good generalization capability. The detailed steps are outlined in the following.
1) Preprocess the n-channel raw EEG data using a fifth-order Butterworth filter, obtaining band-pass filtered signals with the frequency band 8-30 Hz.
2) Perform MEMD on the composite data including an additional m-channel uncorrelated Gaussian white noise with the n-channel filtered signals in Step 1), getting the IMFs at each scale.
3) Calculate the effective factors of different scales and sort them in an ascending order, regarding the first l indexes of IMFs to be significant.
4) For n-channel EEG data, the relevant IMFs obtained in Step 3) are added together to construct the band-pass filtered signals denoted by
 (9)
(9)
where  is the ith-channel reconstructed signal, and dij(t) represents the jth IMFs corresponding to the ith-channel.
5) Process CSP on the reconstructed signals in Step 4) to extract features of EEG, defined as
 (10)
(10)
where Zp denotes the signals processed by CSP;  is the operation of computing vector variance; and k represents the number of spatial filters.
6) Recognize the classes of motor imagery tasks using the SVM classifier.
In the experiment, 11-channel raw EEG data are regarded as input signal, combined with 15 additional noise channels of SNR 20 dB. The above-mentioned steps are performed on them, and the results are analyzed and discussed in the following.
I) To demonstrate the decomposition capability of NA-MEMD performed on EEG. For all trials of each subject, the average power spectra of the first four IMFs from 11 channels are computed. Figure 4 shows the logarithm of average power spectra for each subject. It can be seen that the beta and mu rhythms are separated clearly, contained in the 2nd IMFs d2 and the 3th IMFs d3, respectively. Moreover, the frequency bandwidths in the 1st IMFs d1 are generally broad for each subject, and have been shown to contain some parts of the frequency band (15-30 Hz). Consequently, there is a trade-off on choice of d1 since ignoring it might lose some useful information, whereas conserving that it could bring in noise. To resolve this problem, the role of the first scale is decided according to the optimal classification results combined with CSP-based feature extraction.
II) To validate the identification performance of relevant IMF scales from EEG. As discussed in the analysis of average power spectra, the 2nd and 3th IMFs include the beta and mu rhythms, and thus the two scales are considered to be significant for EEG feature extraction. It is the ground truth about relevant IMF scales identified in this section. Based on the calculated effective factors from all trials of each subject, the statistical results are illustrated in Fig. 5. For all subjects, the effective factors at the first three scales have relatively smaller values, and become larger with the increase of the decomposition scale. Despite the median values of the effective factors at the first three scales being nearly similar, the quartiles and inter-quartile range have a slight difference in the box-plots. As a result, the 1st decomposition scale of IMFs is likely to be treated as relevant scale, as observed by the average power spectra in Fig. 4.
Next, the effective factors are sorted in an ascending order, and the corresponding index vectors are obtained in all trials for each subject. Count up two kinds of error, i.e., Type I error if the numbers “2” and “3” do not occur in the first l elements of the index vector, and Type II error if they do occur in the remainder of the index vector. Figure 6 depicts the statistical results of error rate for each subject when l=2, 3, 4. With the increase of l, both kinds of error rates become small. In particular, the Type I error rates of all subjects are below 4.5% when l=4. It is stated that both the 2nd and 3rd scales are indentified with high accuracy, and the corresponding IMFs indeed contain significant information.
III) To evaluate classification performance of the proposed method against other existing solutions. For 200 trials of each subject, the EEG data in the [0 4]-s window after the cue are selected. Based on the identified relevant IMFs by the proposed method, the feature vectors extracted by CSP are classified using SVM with Gaussian kernel. Depending on the size of the total data for each subject, the number of EEG block is 140 in each training set and 60 in each testing set. Among different methods, the same data partitions are used in the five-fold cross-validation. The classification process is repeated 100 times, and the average accuracy and standard deviation are obtained for comparison.
Fig. 4 Average power spectra of first four IMFs for each subject:
Fig. 5 Statistical results of effective factors for each subject:

Fig. 6 Demonstration of error rate at different l values for each subject:
Considering the effect of the 1st scale imposed on classification performance, different scale combinations of {1, 2, 3, 4}, {1, 2, 3}, {2, 3, 4} and {2, 3} are tested respectively, where the scales {2, 3} are as same the that discussed in Ref. [12] which selects them based on the IMF power spectra and the optimal classification performance. For the purpose of clarity, the above-mentioned approaches are denoted as Alg1, Alg2, Alg3, and Alg4, respectively. To make a fair comparison, our method is also divided into two kinds: Alg5 retaining the first scale, and Alg6 omitting the first scale.
Table 2 summarizes the classification results with average accuracy and standard deviation (SD) for all the algorithms. It is shown that the selected scales {1, 2, 3, 4} and {1, 2, 3} produce nearly similar mean accuracy rate for different filter numbers k=2, …, 4. Similar results are yielded by choosing the scale combinations of {2, 3, 4} and {2, 3}. Compared with them, there is a larger boost in classification accuracy when the scales {2, 3} are considered to be relevant. In particular, the largest rise is in subject b, with the average accuracy increased from 72.83% to 79.20% when k=3. It is also demonstrated that the IMFs at the 4th scale have a small effect on classification performance, and on the contrary most of the accuracy results increase by omitting the 1st IMFs. Concerning our method for all subjects, Alg6 yields mean accuracy rates of 81.85% (k=3) and 81.75% (k=4), which are respectively higher than that of 79.26% (k=3) and 79.49% (k=4) in Alg5, despite Alg5 marginally outperforming Alg6 in subject g when k=3, 4. As compared to the algorithm Alg4 depending on prior knowledge, the proposed method Alg6 yields the very similar mean classification accuracy for subjects a, f and g, and yet it gives a inferior result for subject b due to its relatively higher Type I error rates obtained by the identification of relevant IMF scales.
Table 2 Approach classification accuracy (mean and SD) in BCI Competition IV Dataset I
5 Conclusions
1) A novel identification method of relevant IMF scales is proposed based on NA-MEMD and Jensen-Shannon distance measure, in which no prior knowledge is required. A criterion of effective factor based on JSD is proposed to select the most significant IMF scales.
2) Simulation results have shown that NA-MEMD has accurate localization of task-specific frequency bands, and the proposed method is robust to white noise with different SNRs, yielding lower error rates than the identification algorithm using the Wasserstein distance.
3) In applications of motor imagery EEG classification, informative IMF scales are indentified with high accuracy for each subject. Compared with the method selecting fixed IMF scales based on the average power spectra, the proposed method does not require prior information, and yields very close mean classification accuracy for subjects a, f and g, but that for subject b is relatively lower. Despite the capability of the proposed method demonstrated, it is affected by individual variation of different subjects, and there is still room for improvement in future work.
References
[1] WANG Yi-jun, GAO Xiao-rong, HONG Bo, GAO Shang-kai. Practical designs of brain-computer interfaces based on the modulation of EEG rhythms [C]// Brain-Computer Interfaces, The Frontiers Collection. Berlin, Heidelberg: Springer-Verlag, 2010: 137-154.
[2] PFURTSCHELLER G, Brunner C, Schlogl A, SILVA F H. Mu rhythm (de)synchronization and EEG single-trial classification of different motor imagery tasks [J]. NeuroImage, 2006, 31(1): 153-159.
[3] Doud A, Lucas J, Pisansky M, He B. Continuous three-dimensional control of a virtual helicopter using a motor imagery based brain-computer interface [J]. PloS ONE, 2011, 6(10): e26322.
[4] Jrad N, Congedo M, Phlypo R, ROUSSEAU S, FLAMARY R, YGER F, RAKOTOMAMONJY A. sw-SVM: sensor weighting support vector machines for EEG-based brain-computer interfaces [J]. Journal of Neural Engineering, 2011, 8(5): 056004.
[5] Huang N E, Shen Z, Long S R. The empirical mode composition and the Hilbert spectrum for nonlinear and non-Stationary time series analysis [C]// Royal Society A: Mathematical and Physical Sciences. 1998, 454: 903-995.
[6] Wu C H, Chang H C, Lee P L, LI K S, SIE J J, SUN C W, YANG C Y, LI P H, DENG H T, SHYU K-K. Frequency recognition in an SSVEP-based brain computer interface using empirical mode decomposition and refined generalized zero-crossing [J]. Journal of Neuroscience Methods, 2011, 196(1): 170-181.
[7] HU M, Liang H L. Intrinsic mode entropy based on multivariate empirical mode decomposition and its application to neural data analysis [J]. Cognitive Neurodynamics, 2011, 5(3): 277-284.
[8] Wu Z H, Huang N E. Ensemble empirical mode decomposition: A noise-assisted data analysis method [J]. Advances in Adaptive Data Analysis, 2009, 1(1): 1-41.
[9] Rehman N, Park C, Huang N E, MANDIC D P. EMD via MEMD: Multivariate noise-aided computation of standard EMD [J]. Advances in Adaptive Data Analysis, 2013, 5(2): 1350007.
[10] Rehman N, Mandic D P. Multivariate empirical mode decomposition [C]// Royal Society A: Mathematical, Physical and Engineering Sciences. 2010, 466(2117): 1291-1302.
[11] Rehman N, Mandic D P. Filter bank property of multivariate empirical mode decomposition [J]. IEEE Transactions on Signal Processing, 2011, 59(5): 2421-2426.
[12] Park C, Looney D, Rehman N, AHRABIAN A, MANDIC D P. Classification of motor imagery BCI using multivariate empirical mode decomposition [J]. IEEE Transactions on Neural Systems and Rehabilitation Engineering, 2013, 21(1): 10-22.
[13] Chang H C, Lee P L, Lo M T, WU Y T, WANG K W, LAN G Y. Inter-trial analysis of post-movement beta activities in EEG signals using multivariate empirical mode decomposition [J]. IEEE Transactions on Neural Systems and Rehabilitation Engineering, 2013, 21(4): 607-615.
[14] Hu M, Liang H L. Search for information-bearing components in neural data [J]. PLoS ONE, 2014, 9(6): e99793.
[15] Lin J H. Divergence measures based on the Shannon entropy [J]. IEEE Transactions on Information Theory, 1991, 37(1): 145-151.
[16] Endres D M, Schindelin J E. A new metric for probability distributions [J]. IEEE Transactions on Information Theory, 2003, 49(7): 1858-1860.
[17] Komaty A, Boudraa A O, Augier B, DARE-EMZIVAT D. EMD-based filtering using similarity measure between probability density functions of IMFs [J]. IEEE Transactions on Instrument and Measurement, 2014, 63(1): 27-34.
[18] Blankertz B, Dornhege G, Krauledat M, MULLER K R, CURIO G. The non-invasive Berlin brain-computer interface: Fast acquisition of effective performance in untrained subjects [J]. NeuroImage, 2007, 37(2): 539-550.
[19] Pfurtscheller G, Silva F H. Event-related EEG/MEG synchronization and desynchronization: Basic principles [J]. Clinical Neurophysiology, 1999, 110(11):1842-1857.
[20] Ramoser H, Muller-Gerking J, Pfurtscheller G. Optimal spatial filtering of single trial EEG during imagined hand movement [J]. IEEE Transactions on Rehabilitation Engineering, 2000, 8(4): 441-446.
(Edited by FANG Jing-hua)
Cite this article as: SHE Qing-shan, MA Yu-liang, MENG Ming, XI Xu-gang, LUO Zhi-zeng. Noise-assisted MEMD based relevant IMFs identification and EEG classification [J]. Journal of Central South University, 2017, 24(3): 599-608. DOI: 10.1007/s11771-017-3461-5.
Foundation item: Projects(61201302, 61372023, 61671197) supported by the National Natural Science Foundation of China; Project (201308330297) supported by the State Scholarship Fund of China; Project (LY15F010009) supported by Zhejiang Provincial Natural Science Foundation, China
Received date: 2015-11-13; Accepted date: 2016-01-13
Corresponding author: SHE Qing-shan, Associate Professor, PhD; Tel: +86-571-86919130; E-mail: qsshe@hdu.edu.cn

