Trans. Nonferrous Met. Soc. China 22(2012) 3081-3086
Three-dimensional simulation of pore scale fluid flow in granular ore media with realistic geometry
YANG Bao-hua1,2, WU Ai-xiang2, WANG Chun-lai3, NIU Wen-xin4, LIU Jin-zhi2
1. School of Information Science and Engineering, Hunan International Economics University, Changsha 410205, China;
2. School of Civil and Environment Engineering, University of Science and Technology Beijing, Beijing 100083, China;
3. Faculty of Resources and Safety Engineering, China University of Mining and Technology, Beijing 100083, China;
4. Key Laboratory for Biomechanics and Mechanobiology of Ministry of Education, School of Biological Science and Medical Engineering, Beihang University, Beijing 100191, China
Received 15 November 2011; accepted 18 June 2012
Abstract: The images of granular ore media were captured by X-ray CT scanner. Combined with digital image processing and finite element techniques, the three-dimensional geometrical model, which represents the realistic pore structure of the media, was constructed. With this model, three dimensional pore scale fluid flow among particles was simulated. Then the distributions of fluid flow velocity and pressure were analyzed and the hydraulic conductivity was calculated. The simulation results indicate the fluid flow behaviors are mainly dominated by the volume and topological structure of pore space. There exist obvious preferential flow and leaching blind zones simultaneously in the medium. The highest velocities generally occur in those narrow pores with high pressure drops. The hydraulic conductivity obtained by simulation is the same order of magnitude as the laboratory test result, which denotes the validity of the model. The pore-scale and macro-scale are combined and the established geometrical model can be used for the simulations of other phenomena during heap leaching process.
Key words: granular ore medium; heap leaching; computed tomography; pore-scale fluid flow; 3D finite element model
1 Introduction
The granular ore medium in heap leaching system is one kind of unconsolidated porous media packed with the ore particles with different sizes and highly irregular shape. Its pore network structure is very complex. During the leaching process, the needed leachant for each particle and the reaction products are transported by the fluid flow among the particles, thus the pore structure evolves continuously. Such unstable pore structure necessarily causes fluid flow paths changing constantly, so the rules of fluid flow are very complicated [1]. The traditional fluid flow theory mainly focused on the changes of macro-parameters, such as permeability, as a result the fluid flow details at particle scale were ignored [2-4]. However, to study the complex flow problems in heap leaching system, the influence of pore structure on fluid flow should be taken into account. Only when the details of fluid flow among particles are disclosed, we can further analyze how the hydraulic conduction and leaching effect are influenced.
Since it is difficult to directly determine the fluid flow behaviors among ore particles and obtain the flow velocity distribution by laboratory test, it is therefore imperative to using computer modeling techniques to investigate pore scale fluid flow in granular ore media. The precondition is the availability of accurate three-dimensional geometrical model for presenting the pore space in the porous medium. At present, in the research field of porous media, such as rock and soil, the methods for reconstructing pore space model are generally divided into two main categories. The first category is stochastic reconstruction of pore space using statistical methods (e.g. Monte Carlo). However, it is difficult to obtain the distribution parameters of pore space, so the pore structure properties cannot be described accurately. The second category is using the images of the medium obtained directly by various scan techniques to construct the geometrical model of the pore structure. Among them, X-ray computerized tomography (CT) is a non-invasive technique that can be used to scan relatively large samples at very high resolutions. It has become a very important and popular method for investigating the characteristics of pore structures of porous media in three dimensional detail [5-10]. Meanwhile, conducting simulation with the realistic pore network model constructed based on CT images gradually becomes the most effective method for analyzing the pore-scale mechanics and fluid flow behaviors of porous media. This has become the focus of researchers all over the world in recent years [11-15].
In this work, the X-ray CT technology was used to obtain the images of granular ore media. Combining the digital image processing and the finite element technique, the 3D geometrical model of pore space was reconstructed with original cross-sectional grayscale images and then was transformed into finite element model. With this model, the simulation of pore scale fluid flow was conducted with COMSOL Multiphysics software. Compared with 2D model, this model describes the pore structure, especially the pore connectivity, more realistically, so the simulation results can reflect the flow behaviors more accurately. Moreover, the 3D geometrical model can also be used for simulating mass transport and heat transfer in heap leaching.
2 Experimental
2.1 CT scanning of granular ore media
The ore particle used in the experiment was sieved sulfide copper ore. The particle size is between 9 and 10 mm. The ore particles were installed into a leaching column with 60 mm in diameter and 540 mm in length. The scanning was conducted in a SOMATOM Sensation 16 X-Ray Scanner. It has multi-section images collecting capability and high speed of rotating as well. Thirty two sections can be captured per second and the images can be displayed at a spatial resolution of 0.35 mm×0.35 mm, so it can meet the requirement of images collection in the experiment. One section of the sample is shown in Fig. 1.
2.2 3D finite element model generation
The prerequisite for pore-scale fluid flow simulation during heap leaching is establishing 3D finite element model based on 2D gray images of ore granular medium. The accuracy of the model determines the accuracy of the simulation results. Establishing a 3D geometrical model needs a series of 2D cross sectional images and the quality of the image is very important for the reconstruction. Hence, the original CT image requires post processing, which generally includes the following steps: 1) crop the image, namely extract an appropriate rectangle area in the center of the image to produce a new image for later reconstruction; 2) improve the new image with suitable filter so as to reduce the noises in the image; and 3) select appropriate threshold value to segment pores and particles so as to extract pore network from the image. Then, these 2D images can be used for creating a 3D model based on some certain reconstruction algorithm. After meshing, the 3D finite element model is given, which can be used for numerical simulation directly.

Fig. 1 Sectional CT image of sample
In this work, the 3D finite element model was generated by Simpleware’s ScanIP. After importing series of slices and image processing, the 3D geometrical model was established, as shown in Fig. 2. The size of the sample was 72 pixel×72 pixel×50 pixel and its real size was 25 mm×25 mm×17.5 mm. The model was then meshed by ScanFE module of this software, as shown in Fig. 3. Finally, a 3D mesh file can be exported, which was imported into COMSOL Multiphysics directly for later simulations. The model mixed tetrahedral and hexahedral mesh, having higher accuracy and flexibility. Considering the capacity of computer memory, it was necessary to conduct resampling to decrease the amount of elements in the model so that the simulation can be done successfully.
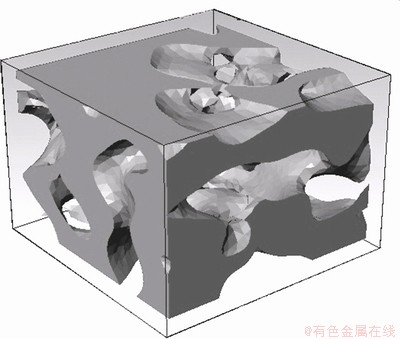
Fig. 2 3D geometrical model of granular ore media

Fig. 3 3D mesh model of granular ore media
3 Simulation process and results of pore- scale fluid flow
3.1 Hypothesis
To simplify the analysis process, the model needs the following hypothesis:
1) Fluid flow only occurs in the pores, not penetrate into the ore particles.
2) Ore particles in the granular ore media are considered immovable during heap leaching.
3) The fluid in the pores is regarded as incompressible and the temperature keeps constant, namely the density and temperature of fluid during flowing process don’t change.
4) Fluid flows under gravity from top to bottom, ignoring capillarity.
5) The fluid is considered to be continuous, which means there is no gap in fluid, such as air bubbles.
3.2 Governing equation
The incompressible Navier-Stokes equation can be used to model the fluid flow through the pore space in the granular ore media [16]. The change rate of fluid momentum with time equals the whole external forces acted on it.
 (1)
(1)
where the vector u is the velocities, p is the fluid pressure, ρ is the fluid density, η is the fluid viscosity, g is the gravity acceleration and F is a vector of directional forces.
Solving Navier-Stokes equation at each node of the three-dimensional finite element model can give the details of the fluid flow through pore network.
3.3 Calculation parameters and boundary condition
The calculation parameters used in the model are listed in Table 1.
Table 1 Key parameters in fluid flow model

The 3D geometrical model has top, bottom, front, back, left, and right boundaries and the surface boundary of ore particle. The left, right, front, and back boundaries are not pervious and there is no glide movement in the model.
1) The bound water on the surface of each ore particle is almost immobile, so
 (2)
(2)
2) The pressures acted on fluid at top and bottom boundary are uniform, and
 (3)
(3)
 (4)
(4)
3) There is no transverse fluid flow at the front, back, left and right boundaries, so
 (5)
(5)
Here, n is the normal unit vector. The above formula means there is no velocity component in the direction perpendicular to these boundaries.
The pressure gradient in the direction of fluid flow was set as 45 Pa. After importing the meshed 3D geometrical model of pore space into COMSOL Multiphysics and puting the calculation parameter, boundary conditions and initial conditions into the computational model, the work of solving and post-processing can be done.
3.4 Simulation results and discussion
The velocity field of fluid in the 3D numerical model and the cross-sectional slides at different height are shown in Fig. 4. The red regions at the centre of pore channels indicate higher velocity of fluid while the blue regions denote lower velocity. The variation of local velocity is clearly observed at different locations in pore space. Figure 4 shows that the velocity decreases gradually from the center of pore throat and body to the surface of particles and reaches zero finally. The fluid flow mainly occurs in the connected pore channels across the whole model and there are some obvious preferential flow paths.
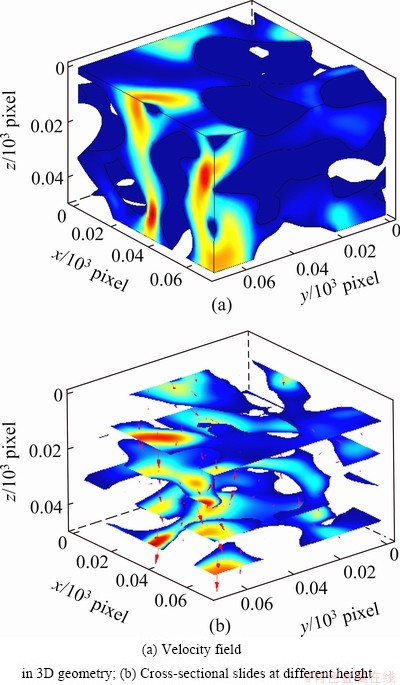
Fig. 4 Velocity field of fluid in pore network
The pressure distribution of fluid in the 3D numerical model is shown in Fig. 5. It denotes that there are large differences in pressure at different locations. The pressure at narrow pore throat changes rapidly, which causes some pore clusters with different pressures. It is the basic reason for uneven flow velocity distribution.

Fig. 5 Pressure field in sample
The velocity and pressure distribution in the same profile are shown in Fig. 6. In conjunction with Fig. 4, it is known that high velocities generally develop in wide channels where pressure gradients are relatively small but multiple branches combine. The highest velocities tend to occur in narrow pores with high pressure drop. The figure also clearly shows some areas with fluid in static state, where flow velocities near zero. These areas mainly exist within the dead-end reaches of big pores, called blind pore space. The blind pore spaces are not readily seen in macro-scale tests, but they effectively reduce the overall hydraulic conductivity. This denotes that the geometrical configuration of pore network plays a crucial role in determining hydraulic conductivity. During heap leaching, once the preferential flow emerges in the medium, blind pore space, also called leaching blind zone, is certain to form. Fluid in these zones is stagnant, solute only transports under the roles of capillary force, surface tension and osmotic pressure. As a result, the leaching rate in these areas is low relatively and leaching effect is poor.
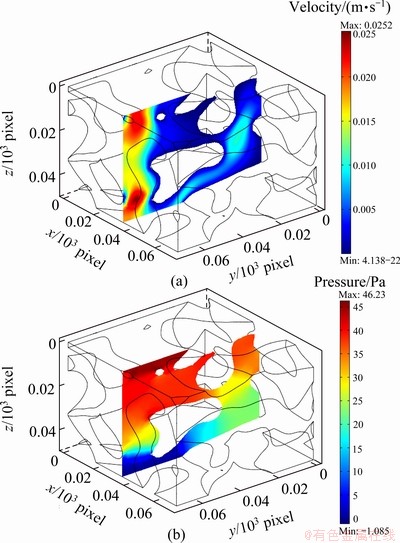
Fig. 6 Velocity (a) and pressure (b) field in same profile of model
Figure 7 shows the streamline of fluid flow. The fluid does not follow a straight line as it flows through the media. Instead, it flows around the ore particles. Its flow path is tortuous, so the real flow length is larger than the length of the media. The tortuousity has significant effect on the medium’s hydraulic conductivity. The larger the tortuousity is, the lower the permeability is. The fluid flow behavior in granular ore media is mainly dominated by the volume and topological structure of pore space.
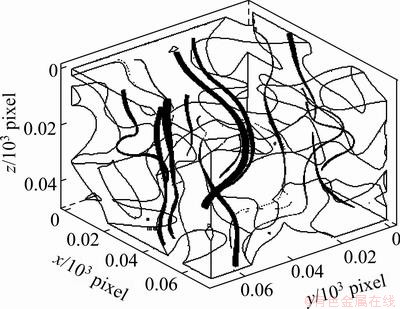
Fig. 7 Streamline of fluid flow in model
After the simulation was completed, the inflow or outflow boundary was integrated with respect to the velocity vector to obtain the total volume of water flowing through the model. Substituting it into Darcy’s law, the hydraulic conductivity of the granular ore medium was calculated. Darcy’s law is shown as follows [17]:
 (6)
(6)
where Q is the volumetric flow through cross section of the sample, m3/s; K is the hydraulic conductivity, m/s; A is the cross sectional area, m2; p1-p2 is the pressure gradient of the sample length L.
The calculated hydraulic conductivity of the sample is 1.8 cm/s. The directly measured hydraulic conductivity by laboratory constant head test is 4.15 cm/s [18]. The obtained hydraulic conductivity value from simulation is the same order of magnitude as the laboratory test result. The difference observed between them may be partially attributed to the resolution of the original images. Since some narrow paths were ignored during image processing, the pore connectivity decreased slightly. As a result, the percolation capability was weakened. In addition, with the restriction of computer’s hardware, the established geometrical model was small, which also influences the final simulation results. Whatever, the simulation results indicate that it is possible to calculate the hydraulic conductivity, a macro-scale parameter, by modeling fluid flow on the pore-scale. In this regard, the combination of macro-scale and pore-scale is realized, which is very significant for understanding the influences of pore structure characteristics of granular ore media on macro-scale fluid flow behaviors during heap leaching.
4 Conclusions
1) The three dimensional finite element model of pore network of granular ore media established facilitated three dimensional modeling of pore scale fluid flow successfully. This model can also be used to simulate other phenomena during heap leaching process, such as heat transfer.
2) Simulation indicates that the fluid flow behavior in granular ore media is greatly controlled by the size of pore space and its topological structure. There exist obvious preferential flow and leaching blind zones simultaneously in the media. The velocity decreases gradually from the center of pore throat and body to the surface of particles. High velocities generally develop in wide channels where pressure gradients are relatively small but multiple branches combine. The highest velocities tend to occur in narrow pores with high pressure drops.
3) The obtained hydraulic conductivity value from simulation is the same order of magnitude as the laboratory test result, which validates the viability of the model. The simulation of pore-scale fluid flow in granular ore media can help us understand macroscopic hydraulic conduction properties. It realized the integration of macro-scale and pore-scale study.
References
[1] YANG Bao-hua, WU Ai-xiang, JIANG Huai-chun, CHEN Xue-song. Evolvement of permeability of ore granular media during heap leaching based on image analysis [J]. Transactions of Nonferrous Metals Society of China, 2008, 18(2): 426-431.
[2] CARIAGA E, CONCHA F, SEPULVEDA M. Flow through porous media with applications to heap leaching of copper ores [J]. Chemical Engineering Journal, 2005, 111(2): 151-165.
[3] BOUFFARD S C, DIXON D G. Investigative study into the hydrodynamics of heap leaching processes [J]. Metallurgical and Materials Transactions, 2001, 32(5): 763-776.
[4] LIU J Z, WU A X. Study on the hydrodynamics of heap leaching process [J]. Mathematical Theory and Applications, 2006, 26(3): 123-125.
[5] ANDERSSON L, JONES A C, KNACKSTEDT M A, BERGSTROM L. Three-dimensional structure analysis by X-ray micro-computed tomography of macroporous alumina templated with expandable microspheres [J]. Journal of the European Ceramic Society, 2010, 30(12): 2547-2554.
[6] LUO L, LIN H, LI S. Quantification of 3-D soil macropore networks in different soil types and land uses using computed tomography [J]. Journal of Hydrology, 2010, 393(1): 53-64.
[7] VOGEL H J, WELLER U, SCHLUTER S. Quantification of soil structure based on Minkowski functions [J]. Computers & Geosciences, 2010, 36(10): 1236-1245.
[8] Al-RAOUSH R, PAPADOPOULO A. Representative elementary volume analysis of porous media using X-ray computed tomography [J]. Powder Technology, 2010, 200(1): 69-77.
[9] LANDIS E N, KEANE D T. X-ray microtomography [J]. Materials Characterization, 2010, 61(12): 1305-1316.
[10] PIERRET A, CAPOWIEZ Y, BELZUNCES L, MORAN C J. 3D reconstruction and quantification of macropores using X-ray computed tomography and image analysis [J]. Geoderma, 2002, 106(3): 247-271.
[11] BOEK E S, VENTUROLI M. Lattice-Boltzmann studies of fluid flow in porous media with realistic rock geometries [J]. Computers & Mathematics with Applications, 2010, 59(7): 2305-2314.
[12] OVAYSI S, PIRI M. Direct pore-level modeling of incompressible fluid flow in porous media [J]. Journal of Computational Physics, 2010, 229(6): 7456-7476.
[13] ZARETSKIY Y, GEIGER S, SORBIE K, FORSTER M. Efficient flow and transport simulations in reconstructed 3D pore geometries [J]. Advances in Water Resources, 2010, 33(12): 1508-1516.
[14] ROBERTO M A, WILLIAMS R A, JIA X D. Combining X-ray microtomography with computer simulation for analysis of granular and porous materials [J]. Particuology, 2010, 8(2): 81-99.
[15] NARSILIO G A, KRESS J, YUN T S. Characterisation of conduction phenomena in soils at the particle-scale: Finite element analyses in conjunction with synthetic 3D imaging [J]. Computers and Geotechnics, 2010, 37(7): 828-836.
[16] KUTAY M E, AYDILEK A H, MASAD E. Laboratory validation of lattice Boltzmann method for modeling pore-scale flow in granular materials [J]. Computers and Geotechnics, 2006, 33(8): 381-395.
[17] KONG X Y. Advanced fluid mechanics in porous medium [M]. Beijing: Press of University of Science and Technology of China, 2010: 43. (in Chinese)
[18] WU Ai-xiang, YANG Bao-hua, ZHOU Xu. Fractal analysis of granular ore media based on computed tomography image processing [J]. Transaction of Nonferrous Metals Society of China, 2008, 18(6): 1523-1528.
基于真实模型的矿岩散体三维孔隙流数值模拟
杨保华1, 2,吴爱祥2,王春来3,牛文鑫4,刘金枝2
1. 湖南涉外经济学院 信息科学与工程学院,长沙 410205;
2. 北京科技大学 土木与环境工程学院,北京 100083;
3. 中国矿业大学 资源与安全工程学院,北京 100083;
4. 北京航空航天大学 生物与医学工程学院 生物力学与力生物学教育部重点实验室,北京 100191
摘 要:利用X光CT技术采集矿岩散体图像,结合数字图像处理技术和有限元技术构建了表征介质真实孔隙结构的三维物理模型,利用此模型进行颗粒间孔隙流的三维数值模拟,分析堆浸散体孔隙内溶液流速和压力分布规律,并计算出介质的水力传导系数。模拟结果表明溶液流动行为在很大程度上受到孔隙大小及拓扑结构的制约,介质内同时存在明显的优势流和浸出盲区,最高流速出现在具有高压降的细小孔隙处。根据模拟结果计算出的水力传导系数与室内实验测试结果具有相同数量级,说明了模型的有效性。实现了细观尺度与宏观尺度的结合,所构建的模型能应用于堆浸过程其它规律的计算机模拟。
关键词:矿岩散体;堆浸;CT;孔隙流;三维有限元模型
(Edited by YUAN Sai-qian)
Foundation item: Projects (50934002, 51074013, 51104100) supported by the National Natural Science Foundation of China
Corresponding author: WU Ai-xiang; Tel: +86-10-62333563; E-mail: wuaixiang@126.com
DOI: 10.1016/S1003-6326(11)61574-4

