Trans. Nonferrous Met. Soc. China 24(2014) 1830-1835
FEM modeling of softened base metal in narrow-gap joint by CMT+P MIX welding procedure
Feng-yuan SHU1,2, Yao-hui  2, Yu-xin LIU2, Fu-jia XU1,2, Zhe SUN2, Peng HE1, Bin-shi XU1,2
1. State Key Laboratory of Advanced Welding and Joining, Harbin Institute of Technology, Harbin 150001, China;
2. Science and Technology on Remanufacturing Laboratory, Academy of Armored Forces Engineering, Beijing 100072, China
Received 5 June 2013; accepted 8 September 2013
Abstract: A required finite element method (FEM) model applicable for narrow gap CMT and CMT+P MIX welding was established based on the interactions between arc, base metal and filler metal. A novel method of simplifying wire feeding pulses and heat input pulses was supposed under the conduction of equivalent input. The method together with composed double-ellipse heat sources was included in the model. The model was employed in the investigation of thermal cycling and the identification of the softened zone of AA7A52 base plates. Low-frequency behavior emerged in the form of low-cooling rate sects, which were not expected under experimental conditions. The softened zone including the quenched zone and averaging zone of the base plate was much wider internal the base plate than that close to the surfaces. The reliability of the predictions in thermal cycling was supported by infrared imaging test results of the thermal cycle process.
Key words: cold metal transferring; finite element method; equivalent input; low-cooling rate sects; softened zone
1 Introduction
The numerical simulation based upon finite element method (FEM) has been an effective way of investigating the instantaneous characteristics during materials processing. Few reports have been found on simulation about cold metal transferring (CMT) or CMT mixed with pulses (CMT+P MIX) process, because the frequency of the pulse behavior of wire feeding and heat input was too high to be simulated. As reported by PICKIN et al [1], the short circuit duration could be only several milliseconds. Though CME was successfully used in welding thin plates [2], it was a novel method for welding thick plates. Narrow gap welding has been utilized to obtain higher productivity and smaller amount of filler metal addition. With regard to narrow gap welding, typical V-style groove was utilized by CHO et al [3] and the dynamic molten pool behavior was studied by numerical method. Groove of double-V style was recommended by ANSI and ASME as described in the Process Piping part. WU et al [4] and CHEN et al [5] reported systematic investigation on arc and weld pool during GTAW process. The shape and energy distribution were predicted under the conduction that the dynamic behavior of the weld pool could be predicted. However, the interaction between arc, base metal and filler metal becomes much more complex due to the unique shape and energy distribution of arc when CMT+P MIX is used in narrow gap welding of thick plates, which makes it more difficult to make good use of FEM.
Softening of the heat affected zone (HAZ) in the base plates has been the key obstacle factor in welding high-strength aluminum alloys, although hardening was found in friction stir welded aluminum alloys [6]. The softening behavior was reported to cover the peak temperature range above 230 °C by MA and OUDEN [7] in the weld joint of Al-Zn-Mg based alloys. The softening zone was divided into averaging area and quenching area, respectively, characterized with coarsening in grain size and solid solution. The temperatures distinguishing the two areas were 350 °C and 410 °C for AA7020 and AA7022, respectively. FU et al [8] found slight discrepancy in AA7055 joint with the averaging zone between 230 °C and 380 °C. The strengthening phases vanished after 1 h solid solution treatment under 477 °C for AA7055, as found by CHEN et al [9]. Softening was found in area where the peak temperature was above 200 °C or within 12 mm from the welding pool boundary. The hardness of AA7A52 under different peak temperatures was researched by DENG et al [10] with thermal simulator for welding research and it was revealed that the material was obviously softened when the peak temperature was 300 °C or around 500 °C. Softening in thick AA7A52 base plate by CMT+P MIX process was predicted in the presented work by the way of finding out the critical temperatures, which was of novelty in comparison with the traditional way of microstructure analysis [11] or fracture analysis [12].
2 Experimental
AA7A52 plates with thickness of 20 mm were welded by a proprietary technology, in which the groove angle was 18° and filler metal was added successively in three passes in the same direction along positive z axis with cross-sectional area no more than 105 mm2, as shown in Fig. 1. In order to keep the inter-pass temperature below 100 °C, the inter-pass cooling time intervals were set as 140, 150, and 400 s in sequence. Specific positions at the edge of the plates (node 11 in section F, section M and section E) were selected where the thermal cycling process was recorded with infrared camera.
3 Analytical model
3.1 Modeling of cooperation between heating source and wire feeding
A whole cycle (t1) of wire feeding speed and heat input was composed of a CMT transfer cycle (tCMT) and a pulse transfer cycle (tPulse). Frequency of the CMT+P process may be beyond 60 Hz which was inapplicable for heat sources to be loaded or for the death-to-birth process to be executed.
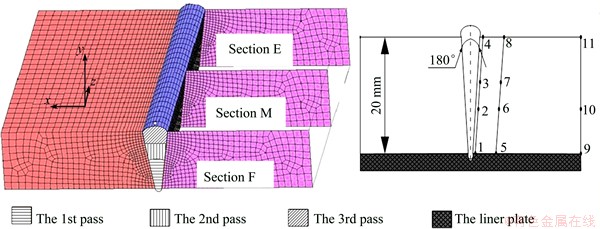
Fig. 1 Schematic diagram of coordinates definition, weld passes and cross sections with each section (a) and groove size detailed (b)
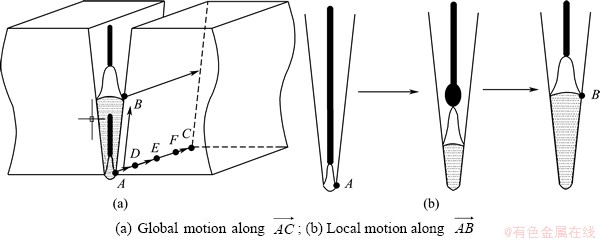
Fig. 2 Schematic diagram of interaction track between arc, base plates and filler metal during first pass
Modeling of the CMT+P welding process should be based upon the interactions among arc, filler metal and base metal. Welding arc was ignited first at the root of the groove located on point A and globally tracked along vector  as shown in Fig. 2(a). Vector was composed of several sections (
 ) and the birth-death element arithmetic was hereby introduced into simulating material addition. Firstly, all the filler metal elements were defined death by dividing the parameters of the elements by approximately 10 orders of magnitude. The dead elements were activated in sequence according to welding speed with the stepwise heat input in step. For the equivalent heat input method, each section was activated in one load case step and all the cycles within the same load case step(the number was assumed to be N as shown in Fig. 3) were recombined into one according to the principle of equivalent welding power input. It was indicated by Fig. 3 that the heat input frequency was finally decreased by increasing the cycle time. Empirically the thickness of the filler metal added in the first pass was 10 mm, which means necessarily the local climb along
  for arc. Heat input was thus divided into two parts, including one part directly loaded on the base metal before the droplet transferred to the base metal and the other part loaded on the bead when transferring got finished as shown in Fig. 3(b). Correspondingly, two double ellipsoid heat sources were adopted. Identical process occurred in the second or the last weld pass.
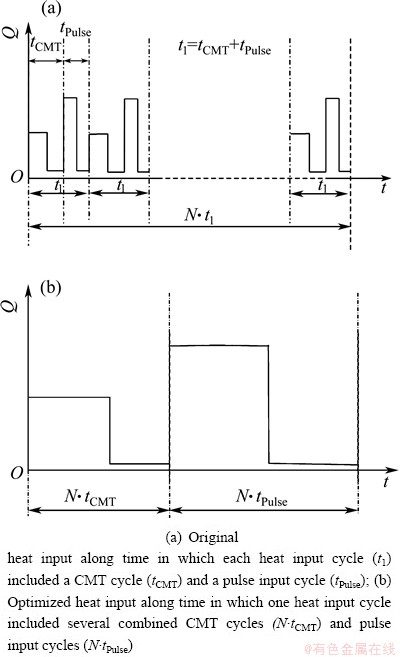
Fig. 3 Schema of equivalent heat input method
3.2 Boundary conditions
The material property parameters could vary greatly as working temperature changed [13]. In order to get rid of the influences from the varying parameters and focus on the character of the CMT welding process the property parameters were used as constant variables [14]. Heat input of arc, heat conduction, phase transformation inside the material, heat transferring from material to both atmosphere and the backing liner plate were considered to contribute in thermal cycling. Thermal exchange inside the material could be characterized by heat balance equation according to the first low of thermodynamics:

 (1)
(1)
among which  . The latent heat of liquation transformation referring to
 was dealt by LAI et al [15] in the way of equivalent specific heat capacity, thus
 (2)
(2)
where L0 is the equivalent increment in heat capacity; TL is the liquidus temperature; TS is the solidus temperature. The atmosphere was assumed to be thermostatic and heat transferring from material to atmosphere occurred in three ways including natural convection, radiation and conduction. Conduction energy could be characterized as
 (3)
(3)
where  is the conduction coefficient; TF is the temperature of material surface; Tat is the constant atmosphere temperature. The heat emission to atmosphere is
 (4)
(4)
where A is the emissivity of material and σ is Stefan-Boltzmann constant. One horizon flat plate and two vertical flat plates were included in the natural convection process. The universal equation is
 (5)
(5)
where Gr・Pr, the constant C and exponent n were set to be 1.6×10⁵, 0.54 and 0.25 respectively for the plates placed horizontally, and 1.0×10⁷, 0.7 and 0.3 respectively for the plates placed vertically [16]. The downward flat plate was fixed onto the liner plate as shown in Fig. 1, thus the main heat transfer style between the welded plate and the liner plate was assumed to be mainly conduction.
4 Results and discussion
The elements were ununiform in size and the weld bead was meshed in smaller size. The weld direction was positive along z axis with the thickness direction along positive y axis in Cartesian coordinate system as shown in Fig. 1. Three cross sections transverse to the z axis were firstly chosen as the characteristic faces to define the global temperature field and several points were selected as the characteristic points to define the temperature field on characteristic faces. The local thermal cycle process that all the nodes from the three cross sections underwent could tell the characteristic of the global thermal cycle process. Each of the symmetric cross sections was divided non-uniformly by three lines, on which several nodes were picked out to indicate the thermal cycle of the cross sections. The selected nodes from every section were located as shown in Fig. 1.
4.1 Thermal cycling
Three nodes numbered as 11 from the three cross sections were chosen as the reference nodes of which the thermal cycle curves obtained with solution method were compared with the experimental infrared photography results as shown in Fig. 4. Good consistency exhibited in Fig. 4 means the validity of the established FEM model for CMT+P MIX welding process. The thermal cycle curves of the selected nodes on the lines from all the three cross sections are shown respectively in Figs. 5, 6 and 7.
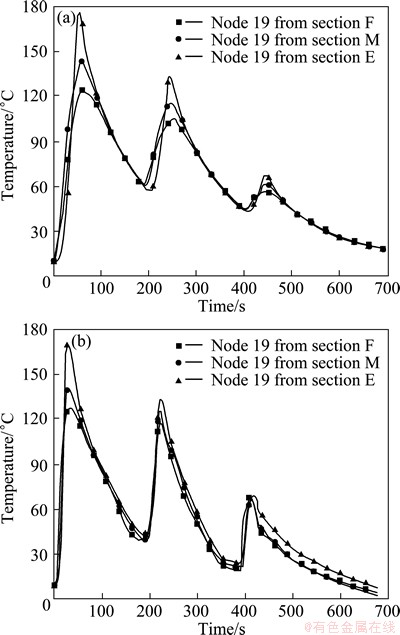
Fig. 4 Thermal cycling curves of reference node form key cross sections obtained by numeric solution (a) and experiments (b)
The thermal cycle of any node was characterized by three sequent temperature peaks in accordance with the three welding passes. Temperature evolution of nodes from the cross section M was extracted firstly. During the first pass, the peak temperature of node 2 was approximately 600 °C which was the maximum among nodes from 1 to 4. The peak temperature of node 6, 210 °C, was found to be the supreme among nodes from 5 to 8. During the second pass, the supreme peak temperature was close to 360 °C at node 3 among nodes from 1 to 4. The peak temperature of node 7, 145 °C, was found the maximum among nodes from 5 to 8. The peak temperatures of nodes 4, 8 and 10 achieved 175, 73 and 61 °C respectively, the highest on the three lines during the third pass. The temperature difference was almost zero for nodes 9, 10 and 11 during the whole welding process.
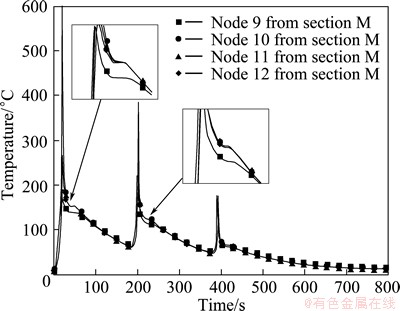
Fig. 5 Thermal cycling curves of nodes numbered from 9 to 12 from cross section M
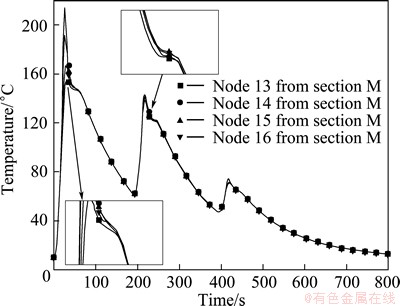
Fig. 6 Thermal cycling curves of nodes numbered from 13 to 16 from cross section M
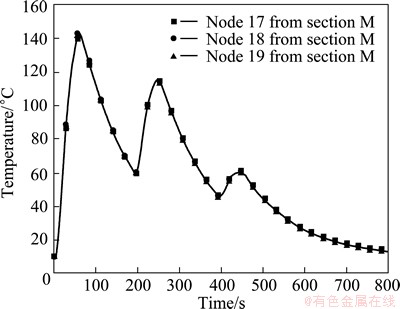
Fig. 7 Thermal cycling curves of nodes numbered from 17 to 19 from cross section M
Cooling rate of two sects from the cooling curve was indicated to be smaller than the other parts as the partial enlargements shown in Fig. 5 and Fig. 6. As was discussed above, high-frequency character of pulse heat input was eliminated by the way of combining several cycles into one. The thermal cycle was then characterized with alternation of heating and cooling. The time that the temperature reached the peak was assumed to be at the end of a specific heating step, followed by a cooling step and a heating step in sequence. The cooling rate during the two steps was shown to be the highest and the lowest, respectively. In the heating step, heat accumulation made up heat loses as a result of rapid heat diffusion inside the plates, thus lowering the cooling rate. The phenomenon was not expected to turn up under experimental conditions because of the high-frequency character of pulse heat input. Moreover, the low cooling rate sects were indicated to be present under the condition of high peak temperature, which was proved by the absence from the thermal cycle curves of nodes 9, 10 and 11.
4.2 Softened zone
It was assumed that solid solution or coarsening occurs wherever the peak temperature was above the quenching temperature or the averaging temperature. Thus solid solution portion and coarsening portion of the joint could be singled out respectively by dividing the joint with isothermal lines or faces.
The critical solid solution temperatures and averaging temperature were supposed to be 450 °C and 230 °C, respectively. So, the quenching area and averaging area in the cross section M are shown in Fig. 8. It was indicated that the softened zone should not be simply described by two parallel lines of specified distance from the weld or the molten pool boundary. The quenched area was in strip shape and obviously narrower than the averaging zone inner the plates. The strip shape was supposed to be a proof of high temperature gradient as a result of high thermal diffusion coefficient for aluminum alloys. Though the coefficient of heat transfer on the bottom surface was higher, higher heat input of the first weld pass made the softened zone appear wider and closer to the bottom surface inner the welded plates. In addition, for both kinds of HAZ it appeared to be wider internal the welded plates than close to the surfaces as a result of higher heat transferring speed inside the plates.
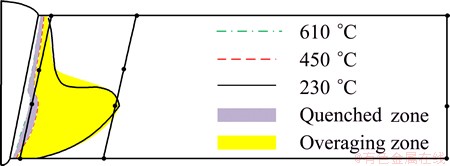
Fig. 8 Schematic diagram of quenched zone and over-aged zone in base plate
5 Conclusions
1) A FEM model for simulating the narrow gap CMT+P MIX welding process was established and applied to identifying the softened zone in AA7A52 base plates. The experimental results of thermal cycling by infrared imaging agreed well with the simulated results.
2) Two sects with lower cooling rate were found from the numerical thermal cycle result, which was supposed to be a result of low-frequency behavior of simulated heat input. High thermal diffusion rate of the material also contributed to decreasing the cooling rate.
3) By identifying the quenched and averaging zones, it was indicated that the softened zone was much wider inner the base plates than close to the flat surfaces. The strip-shaped quenched zone was obviously narrower than the averaging zone internal the plates.
References
[1] PICKIN C G, WILLIAMS S W, LUNT M. Characterisation of the cold metal transfer (CMT) process and its application for low dilution cladding [J]. J Mater Process Technol, 2011, 211: 496-502.
[2] FENG J, ZHANG H, HE P. The CMT short-circuiting metal transfer process and its use in thin aluminum sheet welding [J]. Mater Design, 2009, 30: 1850-1852.
[3] CHO D W, NA S J, CHOB M H, LEE J S. A study on V-groove GMAW for various welding positions [J]. J Mater Process Technol, 2013, 213: 1640-1652.
[4] WU C S, ZHANG M X, LI K H, ZHANG Y M. Numerical analysis of double-electrode gas metal arc welding process [J]. Comp Mater Sci, 2007, 39: 416-423.
[5] CHEN J, WU C S. Numerical analysis of forming mechanism of hump bead in high speed GMAW [J]. Weld World, 2010, 54: 286-291.
[6] BOUZAIENE H, REZGUI M A, AYADI M, ZGHAL A. Correlation between welding and hardening parameters of friction stir welded joints of 2017 aluminum alloy [J]. Transactions of Nonferrous Metals Society of China, 2012, 22: 1064-1072.
[7] MA T, den OUDEN G. Softening behaviour of Al-Zn-Mg alloys due to welding [J]. Mater Sci Eng A, 1999, 266: 198-204.
[8] FU G F, TIAN F Q, WANG H. Studies on softening of heat-affected zone of pulsed-current GMA welded Al-Zn-Mg alloy [J]. J Mater Process Technol, 2006, 180: 216-220.
[9] CHEN J Z, ZHEN L, YANG S J, SHAO W Z, DAI S L. Investigation of precipitation behavior and related hardening in AA7055 aluminum alloy [J]. Mater Sci Eng A, 2009, 500: 34-42.
[10] DENG Y, YIN Z M, ZHAO K, DUAN J Q, HE Z B. Effects of Sc and Zr microalloying additions on the microstructure and mechanical properties of new Al-Zn-Mg alloys [J]. J Alloy Compd, 2012, 530: 71-80.
[11] CHEN S Y, CHEN K H, PENG G S, JIA L. Effect of initial microstructure on hot workability of 7085 aluminum alloy [J]. Transactions of Nonferrous Metals Society of China, 2013, 23: 956-963.
[12] QUAN G Z, WANG F B, LIU Y Y, SHI Y, ZHOU J. Evaluation of varying ductile fracture criterion for 7075 aluminum alloy [J]. Transactions of Nonferrous Metals Society of China, 2013, 23: 749-755.
[13] YOON H S, CHOI J S, OH Y K. Thermal deformation of aluminum alloy casting materials for tire mold by numerical analysis [J]. Transactions of Nonferrous Metals Society of China, 2012, 22(S): s859-s863.
[14] SHENG X F, XIA Q X, CHENG X Q, LIN L S. Residual stress field induced by shot peening based on random-shots for 7075 aluminum alloy [J]. Transactions of Nonferrous Metals Society of China, 2012, 22: 261-267.
[15] LAI Y M, WU Z W, ZHU Y L, ZHU L N. Elastic visco-plastic analysis for earthquake response of tunnels in cold regions [J]. Cold Reg Sci Technol, 2000, 31: 175-188.
[16] HOLMAN J P. Heat transfer [M]. New York: McGraw-Hill Book Company, 1986.
冷金属过渡复合脉冲焊接(CMT+P)窄间隙焊接头基体软化现象的有限元模拟
舒凤远1,2,吕耀辉2,刘玉欣2,徐富家1,2,孙 哲2,何 鹏1,徐滨士1,2
1. 哈尔滨工业大学 先进焊接与连接技术国家重点实验室,哈尔滨 150001;
2. 装甲兵工程学院 再制造技术重点实验室,北京 100072
摘 要:根据电弧对基体材料及填充材料的作用过程建立了CMT和CMT+P过程的有限元模型,其中基于等效热输入原则简化了CMT焊接过程中焊丝进退和热输入之间的相互作用过程。对热源的处理中,采用复合双椭球热源模型。基于该有限元模型研究了热循环规律,由此划分出AA7A52母材的焊接热影响区。模拟计算结果与实验结果的不同之处是,冷却过程中出现低频效应,这种低频效应的表现方式为低冷却速率。软化区包括淬火区和过时效区,基板内部的软化范围明显大于基板近表层区域。通过红外测温实验验证了计算模拟结果的准确性。
关键词:冷金属过渡;有限元方法;等效热输入;低冷速阶段;软化区
(Edited by Hua YANG)
Foundation item: Project (9140C850205120C8501) supported by the Major Program of National Key Laboratory of Remanufacturing and the Army Foundation Project of China
Corresponding author: Peng HE; Tel/Fax: +86-451-86418746; E-mail: hepeng@hit.edu.cn
DOI: 10.1016/S1003-6326(14)63260-X

