������ע���������������ṹ�ĸ��Լ��丯ʴ��������
��Դ�ڿ����й���ɫ����ѧ��(Ӣ�İ�)2017���3��
�������ߣ�Fateme ABDI Hadi SAVALONI
����ҳ�룺701 - 710
�ؼ��ʣ�����ע�룻������ʴ���绯ѧ�����迹�ף���Ч��·
Key words��ion implantation; aluminum; corrosion; electrochemical impedance spectroscopy; equivalent circuit
ժ Ҫ���о��˲�ͬ����������ע���7049���Ͻ�������ṹ��Ӱ�켰����3.5% NaCl��Һ�еĸ�ʴ�������á�XRD���������������ע��ɵ��µ��������γɡ�ԭ��������(AFM)������������ŵ���������������������������Ϊע���������Ʒ�Ĵ��Ȳ����˽ϸߵ���ɢ���ʣ��Ӷ�����ȱ�ݡ����õ绯ѧ�����迹��(EIS)�о�����Ʒ����ʴ�ԣ�����������ŵ���������������ע�뵪���ӵ�����Ʒ����ʴ����֮������EIS���ݵõ���ע�뵪���ӵ�����Ʒ�ĵ�Ч��·���õ�Ч��·Ԫ��ǿ��������Ʒ��ò������о��˸�ʴ���ƺ͵�Ч��·Ԫ���Ĺ�ϵ��
Abstract: The influence of implantation of N+ ions of different energies on the nanostructure of 7049 Al substrates and the corrosion inhibition of produced Al samples in a 3.5% NaCl solution was studied. The X-ray diffraction (XRD) results confirmed the formation of AlN as a result of N+ ion implantation. The atomic force microscope (AFM) results showed that grains of larger scale are formed by increasing N+ energy which can be due to heat accumulation in the sample during implantation causing higher rate of diffusion in the sample, hence decreasing the number of defects. Corrosion resistance of the samples was studied by the electrochemical impedance spectroscopy (EIS) measurements. Results showed that corrosion resistance of implanted Al increases with increasing N+ ion energy. The equivalent circuits for the N+ implanted Al samples with different energies were obtained, using the EIS data which showed strong dependence of the equivalent circuit elements on the surface morphology of the samples. Finally, the relationship between corrosion inhibition and equivalent circuit elements was investigated.
Trans. Nonferrous Met. Soc. China 27(2017) 701-710
Fateme ABDI, Hadi SAVALONI
Department of Physics, University of Tehran, North-Kargar Street, P. O. Box 143951547, Tehran 1439955961, Iran
Received 22 February 2016; accepted 11 October 2016
Abstract: The influence of implantation of N+ ions of different energies on the nanostructure of 7049 Al substrates and the corrosion inhibition of produced Al samples in a 3.5% NaCl solution was studied. The X-ray diffraction (XRD) results confirmed the formation of AlN as a result of N+ ion implantation. The atomic force microscope (AFM) results showed that grains of larger scale are formed by increasing N+ energy which can be due to heat accumulation in the sample during implantation causing higher rate of diffusion in the sample, hence decreasing the number of defects. Corrosion resistance of the samples was studied by the electrochemical impedance spectroscopy (EIS) measurements. Results showed that corrosion resistance of implanted Al increases with increasing N+ ion energy. The equivalent circuits for the N+ implanted Al samples with different energies were obtained, using the EIS data which showed strong dependence of the equivalent circuit elements on the surface morphology of the samples. Finally, the relationship between corrosion inhibition and equivalent circuit elements was investigated.
Key words: ion implantation; aluminum; corrosion; electrochemical impedance spectroscopy; equivalent circuit
1 Introduction
Considering that Al and its alloys are light, cheap, have good electrical and thermal conductivity [1] and good corrosion resistance due to formation of an oxide layer on their surface [2,3], they have an expanded application in aerospace, car, electronic and other industries [4-6]. However, their surface oxide layer has a limited resistance against corrosion and wear therefore enforces a limitation on their applications. In the environments that contain aggressive anions such as chloride, Cl-, the passive film becomes unstable and degrades locally causing film breakdown and pitting corrosion [7-13]. Hence, protection of metal surface from corrosion in different environments is of prime importance which may be achieved by different coatings on the surface or surface modification using different methods [14-16].
One of the important techniques of surface modification is ion implantation. The injected ions interact with the target atoms to improve the hardness and corrosion resistance of the surface of the target [11-13,17-19]. The ion implantation has a number of advantages, for example, high temperatures are not needed, bulk material remains unaffected after implantation process and the modified surfaces by this technique can be tailored by controlling the implantation fluence and the accelerating potential [20].
Nitrogen substantially increases the mechanical strength of surfaces and enhances their resistance to localized corrosion [21-23]. Implantation of nitrogen ions in aluminum modifies its surface and enhances its hardness, corrosion and wear resistance [24-27]. Prior investigations have shown that the distribution of implanted nitrogen ions and the characteristics of the nitride layer formed are dependent on the substrate temperature and the fluence of the ions [28-31].
The electrochemical impedance spectroscopy (EIS) is a powerful technique for investigation of corrosion process. EIS as a non-destructive technique, provides the facility to study the corrosion resistance rate of coatings/samples when they are exposed to the corroding medium. One can model the equivalent circuit for the EIS data and obtain properties of coatings and metals, and investigate the electrochemical behavior of metal/ coating interface and solution resistance [32-39].
In this work, our aim is to study the formation of AlN layer on the surface of Al alloy (7049 with fifteen elements in its composition) substrate by N+ ions implantation as a function of N+ ions energy and investigate the corrosion resistance of the produced samples in a 3.5% NaCl solution that is considered in the literature corresponding to the sea water NaCl concentration, using the EIS technique. Correlation between surface morphology and nanostructure of produced samples and their corrosion behavior in chloride medium is also studied.
2 Experimental
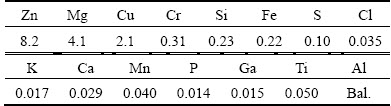
As-received commercial aluminum alloy (7049 with fifteen elements in its composition) of 3 mm in thickness was used in the form of square samples (20 mm ��20 mm). The composition of Al used in this work was obtained using X-ray fluorescence (XRF) method (Philips PW2404) and is given in Table 1. After thorough cleaning of the samples in ultrasonic bath with heated acetone then ethanol, they were mounted on the substrate holder and positioned in the implantation chamber.
Table 1 Chemical composition of 7049 Al alloy used in this work (mass fraction, %)
The N+ ion implantation was carried out at pressure of 2 Pa and initial substrate temperature of 300 K with fluence of 5��1017 ions/cm2 and different energies of 20, 22.5, 25 and 30 keV for 1800 s.
Crystallographic structure of the produced samples was obtained using a STOE model STADI MP diffractometer (Cu K�� radiation), Germany, with a step size of 0.01�� and count time of 1.0 s per step, while the surface physical morphology/nanostructure and roughness were obtained by AFM (Nt-mdt scanning probe microscope, BL022, Russia, with low stress silicon nitride tip of less than 200  radius and tip opening of 18��) analysis. Root mean square (RMS) and average surface roughness as well as average grain size of the samples were obtained from the 2D AFM images using Nova and JMicroVision Codes, respectively. Several samples (at least four samples) were used in all analyses to guarantee reproducibility of the results.
The electrochemical impedance spectroscopy (EIS) was performed using a potentiostat coupled to PC (Ivium, De Zaale 11, 5612 AJ Eindhoven , Netherlands) with reference to the open circuit potential (OCP) and in the frequency range of 100 kHz-0.01 Hz with a voltage amplitude of 0.01 V. In order to carry out this analysis, only an area of 1 cm2 was exposed to the 3.5% NaCl corroding medium. A saturated calomel electrode was used as a reference electrode and a platinum electrode was used as auxiliary one while the test sample was mounted in an inert fixture (polyamide) acted as the working electrode. Before starting the EIS test, the samples were immersed in the solution and the OCP measurement was carried out until it was stabilized.
3 Results and discussion
3.1 XRD and ion distribution simulation results
The XRD patterns of untreated aluminum sample is shown in Fig. 1. In order to make the figure more distinguishable it is divided into two sections. It can be observed that six aluminum diffraction peaks exist in this diffraction pattern at 38.43��, 44.68��, 65.03��, 78.14��, 82.35�� and 98.98�� that can be assigned to the following crystallographic orientations; Al(111), Al(200), Al(220), Al(311), Al(222) and Al(400), respectively (with reference to the JCPDS cards No. 85-1327.) and four other peaks at diffraction angles of 40.12��, 40.74��, 41.50�� and 43.29�� belong to the oxide phase of aluminum that can be assigned to Al2O3(311), Al2O3(006), Al2O3(123), and Al2O3(R,113) crystallo- graphic orientations, respectively (with reference to the JCPDS cards Nos. 86-1410, 71-1684, 88-0107, 42-1468).
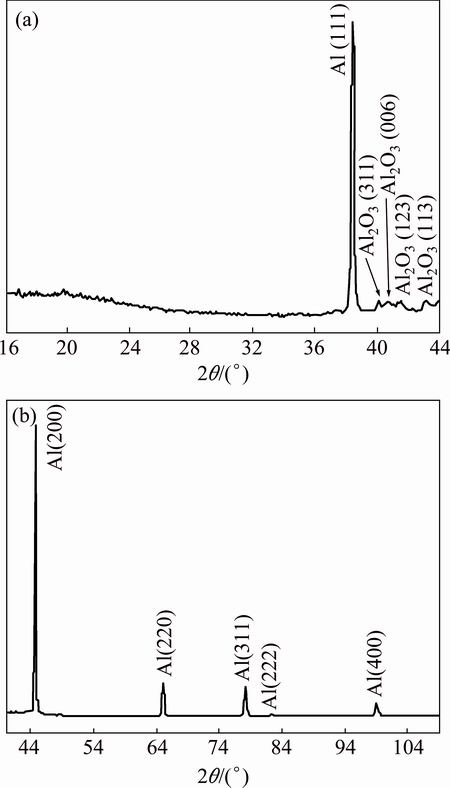
Fig. 1 XRD patterns of untreated 7049 Al alloy
The XRD patterns of the implanted samples with N+ ions of different energies are given in Fig. 2. The spectra obtained for these samples contain a number of diffraction peaks with distinct difference between their intensities that cause difficulty in proper observation of their presence in these spectra. Therefore, in order to obtain a clear view of these peaks, each diffraction spectrum was divided into few sections as presented in Fig. 2. It can be seen that the intensities of Al peaks are reduced relative to the untreated Al sample; however, a few of Al peaks have become twin peaks that the second peak at higher diffraction angle may be assigned to aluminum nitride. The latter mentioned peaks are formed at the following diffraction angles; 44.8��, 65.2��, 78.39��, 82.6�� and 99.31�� that can be assigned to AlN(200), AlN(220), AlN(311), AlN(222) and AlN(400) aluminum nitride diffraction lines, respectively (with reference to the JCPDS card No. 46-1200). In addition to the aluminum nitride peaks mentioned above, there are also other peaks in these spectra that belong to aluminum oxide (Al2O3) and zinc nitride (Zn3N2) phases. The peaks at 19.71�� and 20.87��, belong to Al2O3 (002) and Al2O3 (101), respectively (with reference to the JCPDS cards No. 0107-88 and 73-1199, respectively) and that at 22.34�� belong to Zn3N2(211) (with reference to the JCPDS card No. 88-0618). The increase of intensity of peaks at diffraction angles of 40.74�� and 41.5�� for implanted samples indicates the formation of zinc nitride phases of Zn3N2(117) and Zn3N2(132) (with reference to the JCPDS card No. 30-1473). The increase of intensities of aluminum oxide peaks (Al2O3 (002) and Al2O3 (101)) by N+ ions implantation relative to the untreated sample is due to energy transfer of N+ ions to Al atoms and conversion of this energy to heat which can act as a catalyzer for the reaction of Al atoms with the existing oxygen in the implantation chamber which was just pumped down to a pressure of 5 Pa.
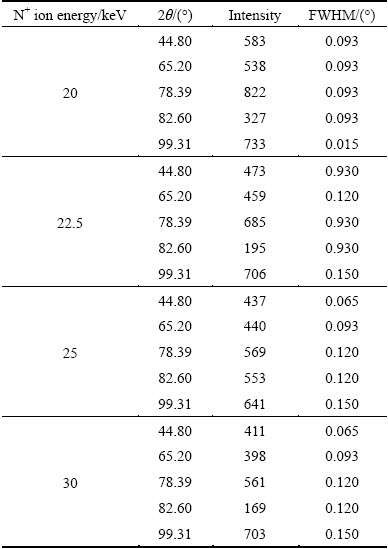
Variation of peak intensity and the full width at half maximum (FWHM) of aluminum nitride peaks with N+ ion energy are given in Table 2. The Voigt function was used to fit the peaks and obtain the intensity from the area under the peak with subtraction of the background. In order to resolve AlN peaks from Al peaks (see Fig. 2) in each case, two Voigt functions plus a level background were fitted to the experimental peaks [40]. Typical example of this is given in Fig. 3.
In order to obtain a theoretical estimation of the distribution of N+ ions of different energies used in this work for implantation in Al samples, the TRIM2008 (transport of ions in matter) code was used. TRIM is a group of programs that calculate the stopping power, average projected range of ions (10 eV/amu�C2 GeV/amu) and other parameters in the process of implantation using a quantum mechanical treatment of ion-atom collisions. The nominal N+ ion average projected range (Rp), lateral straggling (��Rp) at the end of implantation process (i.e., after 99999 ions were implanted), were obtained from TRIM2008 calculation. Results for different N+ energies are given in Table 3. It is worthwhile to note that since the binding energy of the surface atoms for Al is not available, the heat of sublimation is used instead in the TRIM2008 calculation, which apparently does not predict the realistic values and should be considered as a rough estimate. It should also be noted that the role of ion fluence, temperature and some other parameters such as surface roughening, hence, change of surface binding energy is not included in TRIM2008 computer simulation code.
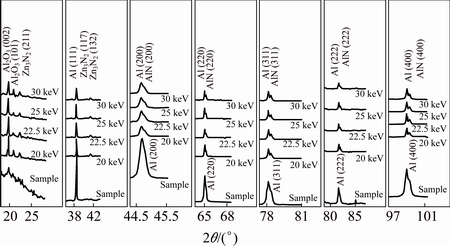
Fig. 2 XRD patterns of untreated 7049 Al alloy sample, and implanted 7049 Al alloy samples with N+ ions of different energies
Table 2 Variations of intensity and full width at half maximum of peaks obtained in XRD patterns of Al samples implanted with N+ ions of different energies
3.2 AFM results
The surface morphology of Al samples implanted with N+ ions of different energies was analyzed by AFM. In Fig. 4, the 2D and 3D AFM images of the untreated Al sample are given, while in Fig. 5, the 2D and 3D AFM images of Al samples implanted with different N+ ions energies are shown. Comparison of the AFM image of untreated Al sample with those of implanted samples shows that the structure of the implanted samples consists of smaller grains than that of untreated Al. The reason for this phenomenon may be the grain boundary sputtering by the N+ ions. The increase of grain size with N+ ions energy can be observed in Fig. 5 and their values are given in Table 3, which could be due to the increased diffusion effect as a result of higher kinetic energy (heat) transfer from higher energy N+ ions to the sample during implantation process.
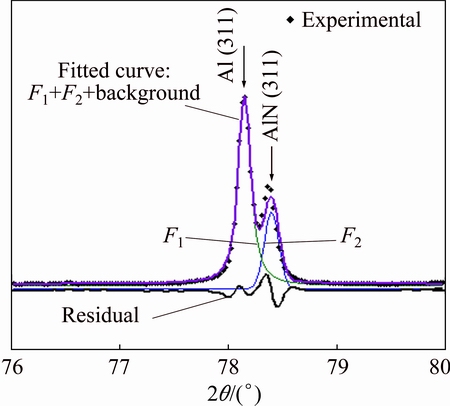
Fig. 3 XRD peaks of Al(311) and AlN(311) obtained for 20 keV N+ ions implanted in 7049 Al alloy sample, fitted to two Voigt functions and a level background
Table 3 Experimental results for untreated Al and implanted Al sample with N+ ions of different energies
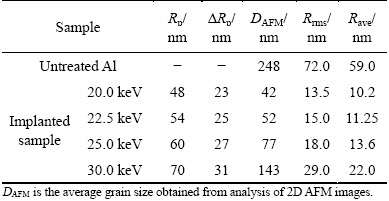
Average (Rave) and root mean square (Rrms) surface roughness results obtained from the AFM measurements are given in Table 3. It can be seen that the surface roughness increases with N+ ion energy, which can be due to the increased diffusion effect. In general, diffusion at higher temperatures is responsible for the grooving effect [41,42] which in turn increases surface roughness due to the formation of deep grooves between very large grains that can even extend to the substrate surface. In Fig. 5(d) two of such grooves can be observed. Table 3 gives the values obtained for the grain sizes from 2D AFM images.
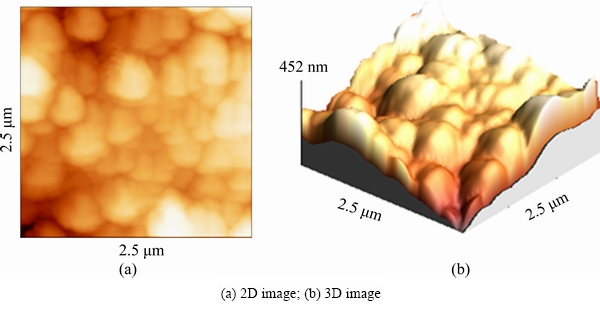
Fig. 4 AFM images of untreated 7049 Al alloy substrate

Fig. 5 AFM images of implanted 7049 Al alloy samples with N+ ions of different energies
3.3 Electrochemical impedance spectroscopy
The results of the electrochemical impedance spectroscopy (EIS) analysis of the untreated Al sample and the Al samples implanted with N+ ions of different energies are given in Fig. 6. These results also show that the implanted samples have better corrosion behaviors than the untreated samples. It can also be observed that with increasing the N+ ion energy, the corrosion inhibition of the Al samples improves. In Fig. 6, it can be seen that the Nyquist plots for the untreated Al samples and the samples implanted with 20 keV N+ ions have two semi-circles, each of which is in different directions with respect to Z' axis and is also formed above and below zero of -Z'' axis. The first semi-circle which is above zero of -Z'' axis (which occurs at higher frequencies) is indicative of capacitance behavior of the sample (as a result of positive phase difference of 90�� between current and voltage) and the second semi-circle which is below zero of -Z'' axis (which occurs at lower frequencies) is indicative of inductance behavior of the sample (as a result of negative phase difference of 90�� between current and voltage). The appearance of capacitance semi-circle before the inductance semi-circle is due to its smaller time constant. The inductance behavior of the sample is as a result of corrosion products and salt formation on the surface of the sample via pitting process by ions of solution on the surface of the sample [43-47]. The Nyquist plot of sample implanted with 22.5 keV N+ ions energy, in addition to the two above mentioned semi-circles shows another semi-circle at intermediate frequencies above the -Z'' axis and is indicative of capacitance behavior of this sample. The existence of this capacitance behavior may be accepted as the formation of an extra maximum in the phase diagram by introducing the Bode and phase diagrams.
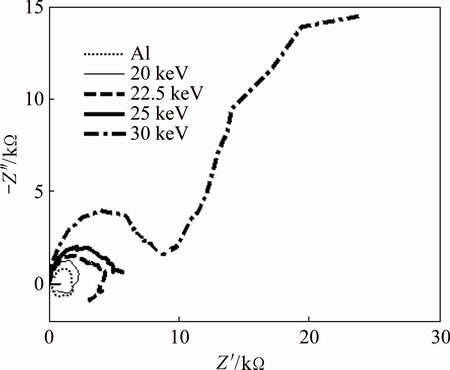
Fig. 6 Experimental Nyquist diagrams for Al, and Al implanted samples with different N+ energies using 3.5% NaCl solution as corroding environment at room temperature
The Nyquist plots of the samples implanted with 25 keV and 30 keV N+ ions also show two semi-circles, but they both are above zero of -Z'' axis and they are indicative of capacitance behavior of coating (modified surface layer of Al by N+ ions implantation) located between the corroding solution and the substrate (undisturbed thickness of Al by N+ ions implantation) (double layer) and capacitance behavior of the coating as an incomplete film (hereafter the term ��coating�� is used as the modified surface layer of Al by N+ ions implantation mentioned above). The latter arises from the incompleteness of the coating (i.e., the coating lets the corroding medium to penetrate into the structure and the substrate). In this case, a second capacitor is also formed and the Nyquist plot consists of two semi-circles above zero of -Z'' axis and depending on the time constants of these two capacitors their semi-circles occur in the plot. The more rigorous investigation on these results can be obtained from the Bode and the phase diagrams which can be obtained from the best fit procedure between experimental and the equivalent circuit.
The equivalent circuit for the untreated Al sample and the N+ ions implanted samples discussed above is given in Fig. 7. In these circuits, RS is the solution resistance, L is the inductance, C2 is the capacitance of the coating that is obtained for incomplete coatings that may be formed when the solution is penetrated into the coating, and C1 is the capacitance of the double layer and is given by
 (1)
(1)
where d is the thickness of the coating, A is the area of the sample exposed to the corroding medium and �� is the dielectric constant of the coating. This capacitance is much larger than that of the coating, because the coating capacitance is due to the incompleteness of the coating which in turn results from the combination of many capacitors which are connected in series, hence the higher the number of these capacitors, the smaller the total capacitance will be. R1, R2 and RL are resistances related to the C1, C2 and the inductance (L), respectively. R is equivalent to the resistances of C2 and L. Due to inhomogeneity of the formed layer structure and the roughness of the coating surface, C1 and C2 capacitors are not in an ideal state. Therefore, we may introduce parameters that identify the deviation of their capacitance from the ideal state as ��1 and ��2.

Fig. 7 Electrical equivalent circuits of untreated 7049 Al alloy and implanted 7049 Al alloy samples with 20 keV N+ energy (a), implanted Al sample with 22.5 keV N+ energy (b), implanted Al sample with 25 and 30 keV N+ energy (c)
The Bode and the phase diagrams obtained from the best fit procedure between the experimental and the simulation results discussed in the above paragraph and in Fig. 7 for different samples produced and discussed in this work are compared in Figs. 8 and 9.
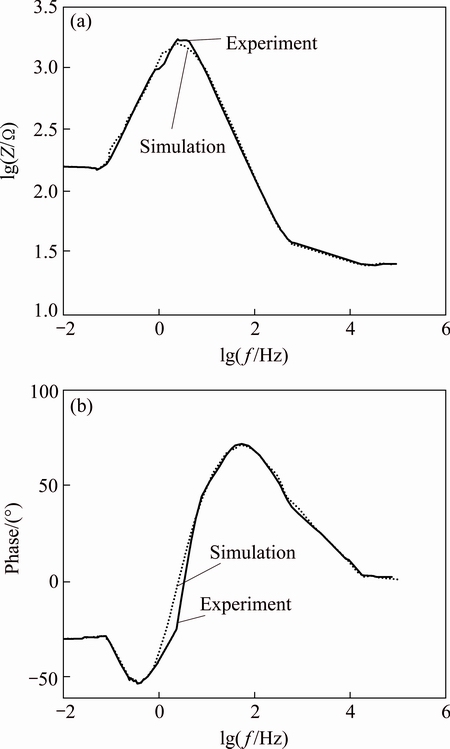
Fig. 8 Bode (a) and phase (b) diagrams of untreated 7049 Al alloy
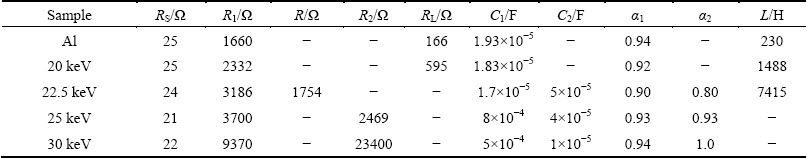
In Table 4, the data obtained from the fitting of equivalent circuits of Fig. 7 to the experimental results are given. These values are obtained using the simulation procedure by the aim of Zview code. These results show that by implantation of 20 keV N+ ions, the inductance value of the equivalent circuit (Fig. 7(a)) increases while the capacitance, C1, decreases relative to the untreated aluminum.
The reason for the increase of inductance could be the formation of oxide and nitride phases of aluminum that can increase the corrosion resistance of the sample and the reduction of capacitance could be due to higher thickness of nitride layer with respect to the surface oxide layer of the sample. These are consistent with the XRD results discussed in Section 3.1. Hence, these phenomena cause the increase of the corrosion inhibition of the sample. At 22.5 keV N+ ion energy implantation (Fig. 7(b)) the equivalent circuit of the Al sample shows an additional capacitor and resistor loop related to the capacitance behavior of the coating layer (C2). This can be due to the penetration of the corroding medium into the coating layer. At 25 and 30 keV, the inductance behavior of the samples disappeared and both C1 and C2 capacitances are decreased. The decrease in C1 can be due to the increased penetration of N+ ions into the body of the sample, while the higher N+ energies as discussed in Section 3.2 (AFM results) cause formation of larger grains, hence lower number of grain boundaries which in turn result in lower number of capacitors in series will cause reduction in the capacitance of C2. This improves the corrosion resistance of the sample. The penetration depth of N+ ion energies obtained using TRIM2008 code (average projected range Rp) for different ion energies which increases with ion energy is given in Table 3. It should also be mentioned that when the size of grains increases, the Cl- ions cannot penetrate in depth of the sample, hence corrosion resistance increases.
Table 4 Electrochemical parameters of untreated Al and implanted Al with N+ ions of different energies subjected to corrosion test in 3.5% NaCl solution, obtained from simulation procedure using Zview program
4 Conclusions
The EIS results show that 7049 Al alloy corrosion inhibition in 3.5% NaCl corroding solution is improved by N+ ions implantation of different energies, and the higher the N+ energy, the higher the corrosion resistance will be. The results are limited to the highest N+ energy value available to us by our implantation plant. This is achieved owing to the higher penetration (average projected range Rp) of the N+ ions in the Al target with increase of energy (results of TRIM 2008) and formation of nitride phase, hence, increase of electrical resistance of the sample. Higher N+ energy also transfers more energy to the sample and accumulation of more heat, hence, higher diffusion effect which in turn causes formation of larger grains and less grain boundaries (results of AFM) and decrease of defects. This results in reduction of capacitance and inductance of the sample hence increase of corrosion inhibition.
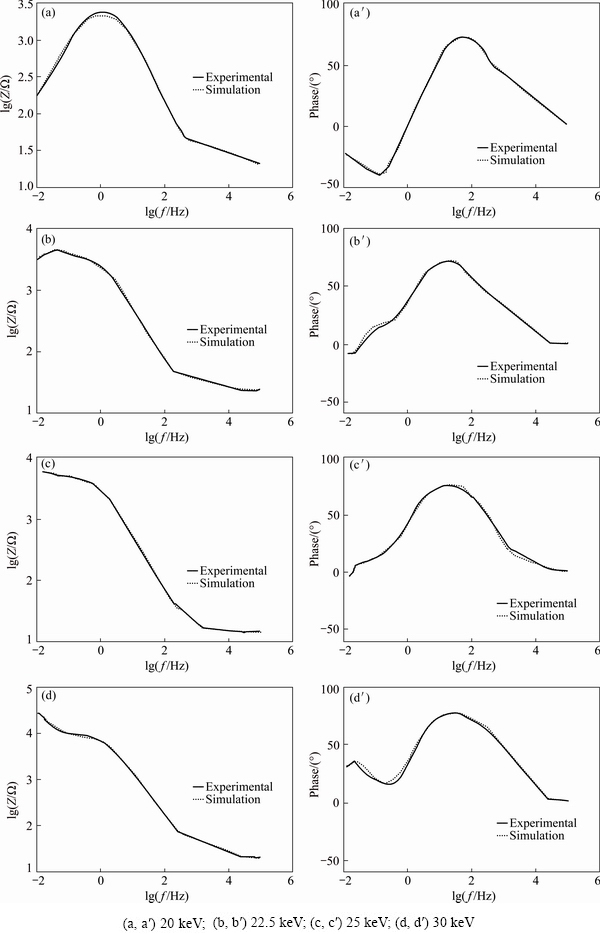
Fig. 9 Bode (a-d) and phase (a��-b��) diagrams of implanted 7049 Al alloy samples with N+ ions of different energies
Acknowledgements
This work was carried out with the support of the University of Tehran and the Iran National Science Foundation (INSF). Hadi SAVALONI is grateful to the center of excellence for structural and microscopic properties of matter, Department of Physics, University of Tehran for partial support of this work.
References
[1] ABDEL-GABER A M, ABD-EL-NABEY B A, SIDAHMED I M, EL-ZAYADY A M, SAADAWY M. Kinetics and thermodynamics of aluminium dissolution in 1.0 M sulphuric acid containing chloride ions [J]. Materials Chemistry and Physics, 2006, 98: 291-297.
[2] ZUBILLAGA O, CANO F J, AZKARATE I, MOLCHAN I S, THOMPSON G E, CABRAL A M, MORAIS P J. Corrosion performance of anodic films containing polyaniline and TiO2 nanoparticles on AA3105 aluminium alloy [J]. Surface and Coatings Technology, 2008, 202: 5936-5942.
[3] SONG J, WANG L, ZIBART A, KOCH C. Corrosion protection of electrically conductive surfaces [J]. Metals, 2012, 2: 450-477.
[4] BAJAT J B, MILOSEV I, JOVANOVIC Z, JANCIC-HEINEMANN R M, DIMITRIJEVIC M, MISKOVIC-STANKOVIC V B. Corrosion protection of aluminium pretreated by vinyltriethoxysilane in sodium chloride solution [J]. Corrosion Science. 2010, 52: 1060-1069.
[5] PANAGOPOULOS C N, GEORGIOU E P, GAVRAS A G. Corrosion and wear of 6082 aluminum alloy [J]. Tribology International, 2009, 42: 886-889.
[6] GOULD J E. Joining aluminum sheet in the automotive industry��A 30 year history [J]. Welding Journal, 2012, 91: 23-34.
[7] TRUEBA M, TRASATTI S P. Study of Al alloy corrosion in neutral NaCl by the pitting scan technique [J]. Materials Chemistry and Physics, 2010, 121: 523-533.
[8] SZKLARSKA-SMIALOWSKA Z. Pitting corrosion of aluminum [J]. Corrosion Science. 1999, 41(9): 1743-1767.
[9] EZUBER H, EL-HOUD A, EL-SHAWESH F. A study on the corrosion behavior of aluminum alloys in seawater [J]. Materials & Design, 2008, 29: 801-805.
[10] YUE T M, YAN L J, CHAN C P. Stress corrosion cracking behavior of Nd: YAG laser-treated aluminum alloy 7075 [J]. Applied Surface Science, 2006, 252: 5026-5034.
[11] BOOSKE J H, ZHANG L, WANG W, MENTE K, ZJABA N, BAUM C, SHOHET J L. Nitrogen plasma source ion implantation for corrosion protection of aluminum 6061-T4 [J]. Journal of Materials Research, 1997, 12: 1356-1366.
[12] ZHANG L, BOOSKE J H, SHOHET J L. Anti-corrosive surface modification of 6061 aluminum using plasma source ion implantation [J]. Materials Letters, 1995, 22: 29-33.
[13] McCAFFERTY E. Effect of ion implantation on the corrosion behavior of iron, stainless steels, and aluminum-A review [J]. Corrosion. 2001, 57: 1011-1029.
[14] NIE X, MELETIS E I, JIANG J C, LEYLAND A, YEROKHIN A L, MATTHEWS A. Abrasive wear/corrosion properties and TEM analysis of Al2O3 coatings fabricated using plasma electrolysis [J]. Surface and Coatings Technology, 2002, 149: 245-251.
[15] FRIGNANI A, ZUCCHI F, TRABANELLI G, GRASSI V. Protective action towards aluminum corrosion by silanes with a long aliphatic chain [J]. Corrosion Science, 2006, 48: 2258-2273.
[16] LIU T, ZHANG F, XUE C, LI L, YIN Y. Structure stability and corrosion resistance of nano-TiO2 coatings on aluminum in seawater by a vacuum dip-coating method [J]. Surface and Coatings Technology, 2010, 205: 2335-2339.
[17] GUNZEL R, WIESER E, RICHTER E, STEFFEN J. Plasma source ion implantation of oxygen and nitrogen in aluminum [J]. Journal of Vacuum Science & Technology B, 1994, 12: 927-930.
[18] WALTER K C. Nitrogen plasma source ion implantation of aluminum [J]. Journal of Vacuum Science & Technology B, 1994, 12: 945-950.
[19] LUCAS S, CHEVALLIER J. Nanohardness and transmission electron microscopy study of nitrogen-implanted aluminum [J]. Surface and Coatings Technology, 1994, 65:128-132.
[20] FAYEULLE S. Ion implantation in stainless steels: Microstructures and mechanical properties [J]. Defect and Diffusion Forum, 1988, 57: 327-358.
[21] RONDELLI G, VICENTINI B, CIGADA A. Influence of nitrogen and manganese on localized corrosion behaviour of stainless steels in chloride environments [J]. Materials and Corrosion, 1995, 46: 628-632.
[22] XIA L, WANG R, MA X, SUN Y. Structure and wear behavior of nitrogen-implanted aluminum alloys [J]. Journal of Vacuum Science & Technology B, 1994, 12(2): 931-934.
[23] LUCAS S, CHEVALLIER J, CHECHENIN N G. Temperature effects on nitrogen diffusion and hardness of aluminum surface implanted with nitrogen [J]. Surface and Coatings Technology, 1994, 663: 334-339.
[24] MANOVA D, SCHRECK M,  S, STRITZKER B, RAUSCHENBACH B. Orientation dependent sputter yield of aluminum [J]. Surface and Coatings Technology, 2002, 151: 72-75.
[25] BILEK M M, MCKENZIE D R, TARRANT R N, OATES T W, RUCH P, NEWTON�\MCGEE K, SHI Y, TOMPSETT D, NGUYEN H C, GAN B K, KWOK D. Practical plasma immersion ion implantation for stress regulation and treatment of insulators [J]. Contributions to Plasma Physics, 2004, 44: 465-471.
[26] SAKLAKOGLU I E. Surface morphology and tribological behavior of AlSi10 alloys treated by plasma immersion ion implantation for automotive applications [J]. Journal of Materials Processing Technology, 2009, 209: 1796-1802.
[27] RICHTER E,  R, PARASACANDOLA S, TELBIZOVA T, KRUSE O, MOLLER W. Nitriding of stainless steel and aluminum alloys by plasma immersion ion implantation [J]. Surface and Coatings Technology, 2000, 128: 21-27.
[28] LUCAS S, CHEVALLIER J, CHECHENIN N G. Temperature effects on nitrogen diffusion and hardness of aluminum surface implanted with nitrogen [J]. Surface and Coatings Technology, 1994, 66, 334-339.
[29] BUDZYNSKI P, YOUSSEF A A, SUROWIEC Z, PALUCH R. Nitrogen ion implantation for improvement of the mechanical surface properties of aluminum [J]. Vacuum, 2007, 81: 1154-1158.
[30] PIETTE M, TERWAGNE G, MOLLER W, BODART F. Nitrogen implantation into metals: A numerical model to explain the high temperature shape of the nitrogen depth profile [J]. Materials Science and Engineering B, 1989, 2: 189-194.
[31] SCHOSER S,  G, FORGET J, KOHLHOF K, WEBER T, VOIGT J, RAUSCHENBACH B. XPS investigation of AlN formation in aluminum alloys using plasma source ion implantation [J]. Surface and Coatings Technology, 1998, 103: 222-226.
[32] AMIRUDIN A, THIENY D. Application of electrochemical impedance spectroscopy to study the degradation of polymer-coated metals [J]. Progress in Organic Coatings, 1995, 26: 1-28.
[33] BEAUNIER L, EPELBOIN I, LESTRADE J C, TAKENOUTI H. Etude electrochimique par microscopie electronique a balayage [J]. Surface Technology, 1976, 4: 237-254.
[34] van WESTING E P, FERRARI G M, de WIT J H. The determination of coating performance with impedance measurements��I. Coating polymer properties [J]. Corrosion Science, 1993, 34: 1511-1530.
[35] van WESTING E P, FERRARI G M, de WIT J H. The determination of coating performance with impedance measurements��II. Water uptake of coatings [J]. Corrosion Science. 1994, 36: 957-77.
[36] van WESTING E P, FERRARI G M, de WIT J H. The determination of coating performance with impedance measurements��III. In situ determination of loss of adhesion [J]. Corrosion Science, 1994, 36: 979-994.
[37] KENDIG M, SCULLY J. Basic aspects of electrochemical impedance application for the life prediction of organic coatings on metals [J]. Corrosion, 1990, 46: 22-29.
[38] LEIDHEISER H. Electrochemical methods for appraising corrosion protective coatings[J]. Coating Technology, 1991, 63: 21-28.
[39] XIAO H, MANSFELD F. Evaluation of coating degradation with electrochemical impedance spectroscopy and electrochemical noise analysis [J]. Journal of the Electrochemical Society, 1994, 141: 2332-2337.
[40] SAVALONI H, GHOLIPOUR-SHAHRAKI M, PLAYER M A. A comparison of different methods for X-ray diffraction line broadening analysis of Ti and Ag UHV deposited thin films: Nanostructural dependence on substrate temperature and film thickness [J]. Journal of Physics D: Applied Physics, 2006, 39: 2231-2239.
[41] GRAYELI-KORPI A R, SAVALONI H. Effect of nitrogen ion implantation on corrosion inhibition of nickel coated 316 stainless steel and correlation with nano-structure [J]. Applied Surface Science, 2012, 258: 9982-9988.
[42] SAVALONI H, HABIBI M. Influence of Ni deposition and subsequent N+ ion implantation at different substrate temperatures on nano-structure and corrosion behaviour of type 316 and 304 stainless steels [J]. Applied Surface Science, 2011, 258: 103-112.
[43] XIN Y, LIU C, ZHANG W, JIANG J, TANG G, TIAN X, CHU P K. Electrochemical behavior Al2O3/Al coated surgical AZ91 magnesium alloy in simulated body fluids [J]. Journal of the Electrochemical Society, 2008, 155: 178-182.
[44] WU C S, ZHANG Z, CAO F H, ZHANG L J, ZHANG J Q, CAO C N. Study on the anodizing of AZ31 magnesium alloys in alkaline borate solutions [J]. Applied Surface Science, 2007, 253: 3893-3898.
[45] FANG D, LI X, LI H, PENG Q. Electrochemical corrosion behavior of backward extruded Mg-Zn-Ca alloys in different media [J]. International Journal of Electrochemal Science, 2013, 8: 2551-2565.
[46] LIU L L, YANG P X, SU CN, GUO H F, AN M Z. Microstructure and corrosion behavior of micro-arc oxidation film on magnesium alloy [J]. International Journal of Electrochemal Science, 2013, 8: 6077-6084.
[47] SOLMAZ R,  G, CULHA M, YAZICI B, ERBIL M. Investigation of adsorption and inhibitive effect of 2-mercaptothiazoline on corrosion of mild steel in hydrochloric acid media [J]. Electrochimica Acta, 2008, 53: 5941-5952.
Fateme ABDI, Hadi SAVALONI
Department of Physics, University of Tehran, North-Kargar Street, P. O. Box 143951547, Tehran 1439955961, Iran
ժ Ҫ���о��˲�ͬ����������ע���7049���Ͻ�������ṹ��Ӱ�켰����3.5% NaCl��Һ�еĸ�ʴ�������á�XRD���������������ע��ɵ��µ��������γɡ�ԭ��������(AFM)������������ŵ���������������������������Ϊע���������Ʒ�Ĵ��Ȳ����˽ϸߵ���ɢ���ʣ��Ӷ�����ȱ�ݡ����õ绯ѧ�����迹��(EIS)�о�����Ʒ����ʴ�ԣ�����������ŵ���������������ע�뵪���ӵ�����Ʒ����ʴ����֮������EIS���ݵõ���ע�뵪���ӵ�����Ʒ�ĵ�Ч��·���õ�Ч��·Ԫ��ǿ��������Ʒ��ò������о��˸�ʴ���ƺ͵�Ч��·Ԫ���Ĺ�ϵ��
�ؼ��ʣ�����ע�룻������ʴ���绯ѧ�����迹�ף���Ч��·
(Edited by Xiang-qun LI)
Corresponding author: Hadi SAVALONI; Tel: +98-21-88635776; Fax: +98-21-88004781; E-mail: savaloni@khayam.ut.ac.ir
DOI: 10.1016/S1003-6326(17)60078-5

