Mechanical performance of shear studs and application in steel-concrete composite beams
��Դ�ڿ������ϴ�ѧѧ��(Ӣ�İ�)2016���10��
�������ߣ������� ��־�� ���� ���� ���� ����
����ҳ�룺2676 - 2687
Key words��shear studs; push-out test; load-slip relationship; ultimate bearing capacity; steel-concrete composite beams
Abstract: This work experimentally investigates the effects of shear stud characteristics on the interface slippage of steel-concrete composite push-out specimens. ABAQUS is used to establish a detailed 3D finite element (FE) model and analyze the behavior of push-out specimens. The modeling results are in good agreement with the experimental results. Based on parametrical analysis using the validated FE approaches, the effects of important design parameters, such as the diameter, number, length to diameter ratio, and yield strength of studs, concrete strength and steel transverse reinforcement ratio, on the load-slip relationship at the interface of composite beams are discussed. In addition, a simplified approach to model studs is developed using virtual springs with an equivalent stiffness. This approach is demonstrated to be able to predict the load-displacement response and ultimate bearing capacity of steel-concrete composite beams. The predicted results show satisfactory agreement with experimental results from the literature.
J. Cent. South Univ. (2016) 23: 2676-2687
DOI: 10.1007/s11771-016-3329-0

ZHU Zhi-hui(��־��)1, ZHANG Lei(����)1, BAI Yu(����)2, DING Fa-xing(������)1,
LIU Jing(����)1, ZHOU Zheng(����)3
1. School of Civil Engineering, Central South University, Changsha 410075, China;
2. Department of Civil Engineering, Monash University, Clayton, VIC 3800, Australia;
3. National Engineering Laboratory for High-Speed Railway Construction, Changsha 410075, China
 Central South University Press and Springer-Verlag Berlin Heidelberg 2016
Abstract: This work experimentally investigates the effects of shear stud characteristics on the interface slippage of steel-concrete composite push-out specimens. ABAQUS is used to establish a detailed 3D finite element (FE) model and analyze the behavior of push-out specimens. The modeling results are in good agreement with the experimental results. Based on parametrical analysis using the validated FE approaches, the effects of important design parameters, such as the diameter, number, length to diameter ratio, and yield strength of studs, concrete strength and steel transverse reinforcement ratio, on the load-slip relationship at the interface of composite beams are discussed. In addition, a simplified approach to model studs is developed using virtual springs with an equivalent stiffness. This approach is demonstrated to be able to predict the load-displacement response and ultimate bearing capacity of steel-concrete composite beams. The predicted results show satisfactory agreement with experimental results from the literature.
Key words: shear studs; push-out test; load-slip relationship; ultimate bearing capacity; steel-concrete composite beams
1 Introduction
Stud connectors are the main type of shear connector used in steel-concrete composite beams. Deformation of stud connectors can cause relative slippage at the steel and concrete interface [1], thereby possibly affecting the structural stiffness and load carrying capacity of steel-concrete composite beams. The load-slip relationship between steel and concrete as a function of the properties of shear connectors has been an important research topic since the 1950s. Push-out tests are commonly used to determine the capacity of the shear connectors and load-slip behavior at the steel and concrete interface.
OLLGAARD et al [2] presented an experimental study on the push-out performance of stud connectors in lightweight and normal-weight concrete and proposed an empirical formula to describe the corresponding load- slip relationship. This formula was then used in a number of specifications worldwide, such as AISC-360-05 [3] and Chinese standard GB50017��2003 [4]. AN and CEDERWALL [5] conducted push-out tests on stud connectors with normal and high-strength concrete. It was concluded that the grade of concrete introduced significant effects on the shear bearing capacity of studs. A load-slip relationship formula was further proposed considering the interaction between the stud and the surrounding concrete. GATTESCO and GIURIANI [6] studied the behavior of the connectors in four specimens tests and two of them were subjected to monotonically increasing loading while the others were submitted to cyclic loading. The results of monotonic tests were compared with those obtained with a standard push-out test and showed good agreement. SHIM et al [7] proposed a formula to estimate shear bearing capacity of stud connectors with large diameters, again based on push-out tests. Their results also showed that the bearing capacity formula in Eurocode 4 was not suitable for large diameter studs. RAHIR et al [8] have completed senven push-off tests on pin-connected shear studs with composite steel-concrete beams and a new stud system fastened with high strength pins was investigated experimentally. SMITH et al [9] investigated 27 push-off tests to research some parameters influence on the test, such as mesh position, transverse spacing of shear connectors, number of shear connectors per trough and the slab depth and based on these tests, they put forward a design rules. LEE and KIM et al [10] studied the shear resistance of stud connectors when the concrete grade is high by 24 push-out specimens, then a shear resistance equation of stud connectors is proposed through a linear regression analysis based on the test results.
It is evident that push-out tests are a common approach to experimentally investigate the mechanical behavior of studs in composite structures. Efforts have also been made to study the mechanical behavior of studs examined in push-out tests using FE methods.
LAM et al [11] applied ABAQUS to model the load-slip characteristics of headed studs in a solid RC slab. C3D8 elements were used in the modeling of the concrete slab in ABAQUS, although this type of element may easily cause volumetric locking when subjected to bending loads.
NGUYEN and KIM [12] used ABAQUS to simulate the mechanical responses of large stud connectors in push-out tests, where the stud and concrete interface was modeled by TIE constraints (a tie constraint defined in ABAQUS may couple two separate surfaces so that no relative motion occurs between them). However, the stiffness of stud connectors was easily overestimated by such modeling techniques.
Nonlinear responses of a group of studs (more than 18 studs) in a pull-out test were modeled by XU and SURIURA [13] using ABAQUS. This work showed that the stiffness and shear bearing capacity per stud of such a group of studs in push-out specimens decreased in comparison to normally arranged studs, and the initial bending effect on shear stiffness decreased with the increase of stud diameter.
A parametric push-out analysis on group studs under effect of bending-induced concrete cracks has been carried out by XU et al [14]. Combining test results and ABAQUS analysis, stud shear stiffness, shear strength, and push-out damage were investigated.
It is noted that previous work mainly focused on the effect of concrete strength and stud diameter on the shear bearing capacity and load-slip relationship of stud shear connectors. However, the effect of stud yield strength has not been clarified. This work presents six push-out tests conducted on three groups of steel-concrete composite specimens with stud connectors, in order to investigate the influence of stud yield strength and stud diameter on the ultimate shear capacity per stud and the load-slip relationship at the interface of composite specimens. The experimental results are used to validate a detailed FE modeling approach and this enabled further parametric analysis to clarify the effects of concrete strength, stud diameter, and stud yield strength. Furthermore, a simplified modeling approach in which studs are represented by springs is developed. Modeling results from the simplified approach showed improved efficiency in calculation and satisfactory agreement with experimental results from the current study and the literature.
2 Experimental investigation
2.1 Specimens and materials
Six push-out specimens were designed and tested in three scenarios. The first scenario included two identical specimens labeled T1-1 and T1-2, where two studs (with stud shank diameter 16 mm and height 90 mm) were welded on each side of a steel beam, as shown in Fig. 1(a). Concrete slabs were cast with reinforcements on both sides of the steel beam (see Fig. 1 and Table 1 for more detail). The second scenario also included two identical specimens, T2-1 and T2-2, with similar configuration to those in scenario 1 except that the stud shank diameter was 19 mm. Specimens T3-1 and T3-2 were examined in the third scenario, where only one stud was welded on each side of the steel beam and the stud shank diameter was 16 mm (see Fig. 1(b) and Table 1). For all the specimens, grade 4.6 cheese head studs (as specified in Chinese standard GB/T10433��2002 [15]) was used and steel beams were made of Q235 steel with the detailed geometry shown in Fig. 1. Longitudinal and transverse reinforcements in the concrete slab had diameters of 10 mm. Before the push-out experiments, the mechanical properties of the steel and the cubic concrete specimens were tested in accordance with relevant standard methods. The corresponding material properties are summarized in Table 1, together with geometric information and reinforcement ratio details.
2.2 Experimental setup and instrumentation
The push-out specimens were tested in a hydraulic testing machine with a capacity of 2000 kN at Central South University, China. A layer of sand was laid under the concrete slabs before loading to ensure that the bottom of a concrete slab would not be crushed prematurely. To accurately measure the longitudinal relative slippage between the steel beam and the concrete slab, four dial gauges D1 to D4 were installed on both sides of the specimen at the stud positions (see Figs. 2 and 3) to measure the relative displacement (i.e. the slippage) between steel and concrete surfaces.
Specimens were placed within the loading frame and sat directly on the strong floor. Compressive load was applied to the top of the steel in the specimen using a load control mode. The load was first applied at 30% of the expected failure load (calculated according to the stud shear bearing capacity formula given in Eurocode 4 [16]) at a step of 10 kN, and then cycled three times between 0 and 30% of the expected failure load at the same load step. Subsequently, load was increased up to failure of the specimen. When the ultimate load was approaching, specimens were loaded slowly and continuously until final failure. The entire loading process took about 30 min. The experimental setup is shown in Fig. 3.
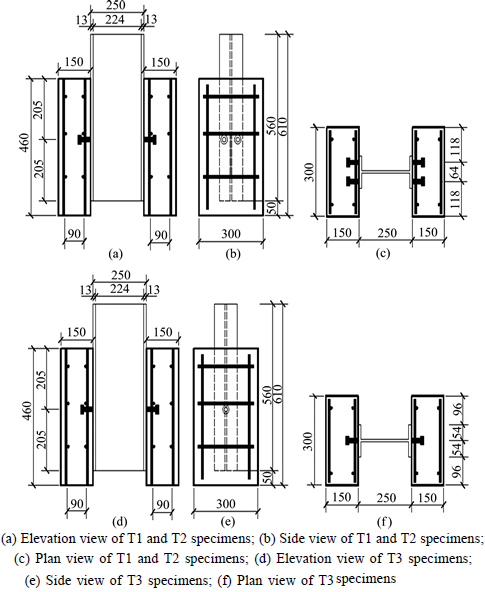
Fig. 1 Details of push-out specimens (Unit: mm):
Table 1 Details of specimens
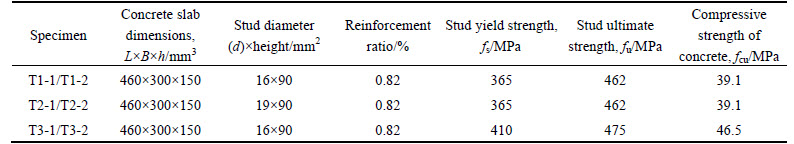
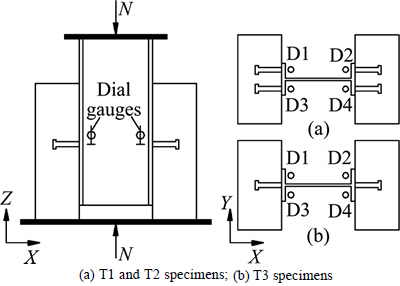
Fig. 2 Experimental instrumentation:

Fig. 3 Experimental setup
2.3 Experiment results and discussion
In general, when the load increased to 60%-70% of the ultimate load, cracks are observed along the transverse direction (i.e. Y direction in Fig. 2) of the inner surface of the concrete slabs at the positions of the studs. As the load continued to increase, the slippage between the steel flange and concrete slab became significant. When the ultimate load is reached, the studs are sheared off from the steel beam with a sudden loud noise, and the load dropped rapidly. The failure mode observed from the push-out tests on all specimens is stud shank failure. No concrete crushing around the studs is observed. In that typical shank failure, the ultimate stress of the headed stud is achieved before the compressive strength of the concrete is reached. Figure 4 presents the failure mode of the tested specimens.
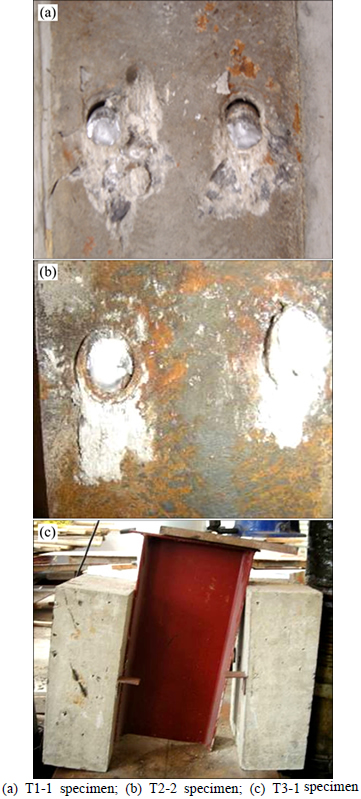
Fig. 4 Failure modes of studs in shear from tested push-out specimens:
Figure 5 shows the load (P)-slip (s) curves of all the specimens. An elastic stage is observed at lower load levels until about 40% of the maximum load value. The slippage between steel beam and concrete slab is very small at this stage. The second stage corresponds to the development of concrete deformation under local compression and stud deformation under bending and shear. The load-slip curves show the slope decreasing with the increase of the load; and the slippage increases rapidly in this stage while the load increases slowly because of the yielding process of the studs.
Stud diameter showed significant effects on the load capacity of the specimens. The maximum load of the T2 specimens (with 19 mm shank diameter, 18.8% greater than 16 mm) is about 21% higher than that of the T1 specimens, as shown in the Fig. 5. The T3 specimens, with 18.9% higher concrete strength and 12.3% higher yield strength of stud than the T1 specimens, demonstrated higher capacity of about 11%. The slope of the load-slip curves also improved with the increase of stud diameter and concrete strength (concrete modulus increased with strength).
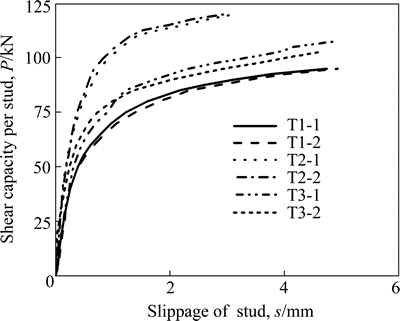
Fig. 5 Experimental load-slip curves per stud from tested push-out specimens
3 Detailed FE modeling
3.1 Material definitions
FE software ABAQUS/Standard6.8 [17] is used in this work for detailed FE modeling. The compressive constitutive relationship of the concrete is defined in Eq. (1) and the corresponding parameter values are according to Ref. [18].
 (1)
(1)
where k is the ratio of the initial tangent modulus to the secant modulus at peak stress and equals 9.1 ; m is a parameter that controls the decrease in the elastic modulus along the ascending branch of the axial stress-strain relationship and equals 1.6(k-1)2. For the concrete under local compression, parameter ��1 can be taken as 0.15. Poisson ratio vc of concrete is assumed to be 0.2. Equation (1) can describe the stress-strain relationship of concrete with strengths ranging from 20 to 140 MPa and validated by experimental results in Ref. [18].
An elasto-plastic model, considering von Mises yielding criteria, Prandtl-Reuss flow rule, and isotropic strain hardening, is used to describe the constitutive behavior of the steel studs as formulated below:
 (2)
(2)
where ��i is the equivalent stress of steel; fs is the yield strength and fu is the ultimate strength of steel. Studs generally had a higher yield strength (300 to 600 MPa), and the elastic-plastic hardening behavior is more apparent and the ultimate strength to yield strength ratio (fu/fs) is between 1.2 and 1.3 according to the present results (1.2 is used in this study). Es is the elastic modulus of steel as 2.06��105; ��i is the equivalent strain, ��y is the yield strain and ��u is ultimate strain of steel.
The ideal elastic-plastic model is used for the steel beams and reinforcement bars in the concrete slabs, and the constitutive relation is
 (3)
(3)
3.2 Model establishment and meshing
The FE model is composed of four components �C concrete slab, steel beam, headed studs, and steel reinforcement bars. The concrete slab is meshed using solid element C3D8R available from the ABAQUS element library. This element type is an 8-node brick element with three translational degrees of freedom for each node. It can be used for nonlinear analysis of properties including contact, large deformation, plasticity, and failure. The steel beam and headed studs are modeled and meshed using solid element C3D8R. The steel rebars are meshed by truss element T3D2. Due to the symmetry of the specimens, only a quarter of a specimen is modeled, as shown in Fig. 6. Fine mesh is applied in the region around the interface between concrete and studs to achieve more accurate and detailed results. For the headed stud, the mesh size is also refined at the joint region where the stud would fail under shear force. Coarse mesh is then applied for the remaining parts to promote efficient calculation. The structured meshing technique provided by the software is used in element meshing as shown in Fig. 6.
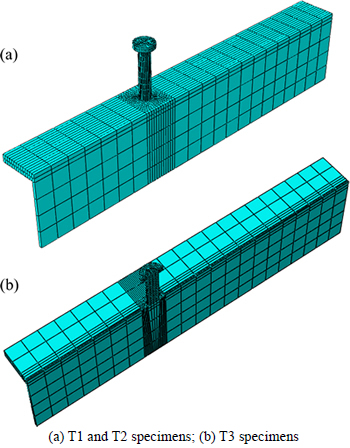
Fig. 6 Detailed FE models after meshing for tested push-out specimens:
3.3 Interface interactions and constrains
In the push-out experiments, the steel beam flange surface in contact with the concrete slab is usually greased to reduce friction. In the analysis, therefore frictionless contact interaction is applied between the steel flange and concrete slab surface.
Surface-based interaction is applied at interfaces between studs and concrete for all specimens. It consisted of contact in the normal direction and bond-slip interaction in the directions tangential to the surface between the stud and concrete. In the tangential directions, a friction coefficient of 0.6 is used in the analysis. The sliding formulation adopted finite sliding, that allowed relative slip along the tangential directions at the interface between the studs and concrete but defined a hard contact to transfer surface pressure between contacting surfaces, with possible separation indicated by a negative pressure in the normal direction. The type of contact between stud and concrete is surface-to-surface, where the stud is considered the master face and the concrete is the slave face.
An embedded constraint is applied between the steel rebar and surrounding concrete in the reinforced concrete slab. In this constrained form, the translational degrees of freedom (DOFs) of the nodes on the rebar elements are constrained to the interpolated values of the corresponding DOFs of the concrete elements (ABAQUS can automatically couple the DOFs of two materials after embedding). Therefore, the slippage and debonding of the rebar within the concrete are not considered.
3.4 Boundary conditions and loading
Because of the symmetry of the push-out test specimens, the symmetric boundary condition is applied to the surfaces at the symmetric planes of the specimen as shown in Fig. 7. All nodes along the middle of the steel beam web (surface 1, see Fig. 7) are restricted from moving in the Y direction. All concrete nodes, stud nodes, nodes of steel beam flanges and webs that lay on the other symmetric surface (surface 2, see Fig. 7) are restricted from moving in the X direction. In terms of the support conditions, all nodes of the concrete slab in the direction opposite to loading (surface 3, see Fig. 7) are restricted from moving in the Z direction to resist the compression load.

Fig. 7 Boundary condition and loading definition for tested push-out specimens
For better modeling of the decrease in load-bearing capacity of specimens, load is applied through increments of displacement and both material and structural nonlinearities are considered and solved using the incremental-interactive method provided in ABAQUS. Slippage is calculated as the relative displacement between the nodes on the steel flange and on the concrete slab at the stud positions. The load is measured as the total reaction acting on the surface 3 (see Fig. 7).
3.5 Modeling results and verification
Comparisons of the experimental and modeling load-slip curves are shown in Fig. 8. Good agreement between experimental and FE modeling results is found in the elastic stage, as demonstrated in Fig. 8. In the plastic stage, stud deformation increased very quickly, compromising the agreement between FE modeling and experimental curves. However, the ultimate shear capacity for each stud predicted by FE modeling showed high accuracy, with 4.7% overestimation for the T1 specimens, 3.6% underestimation for the T2 specimens, and 3.8% overestimation for the T3 specimens.
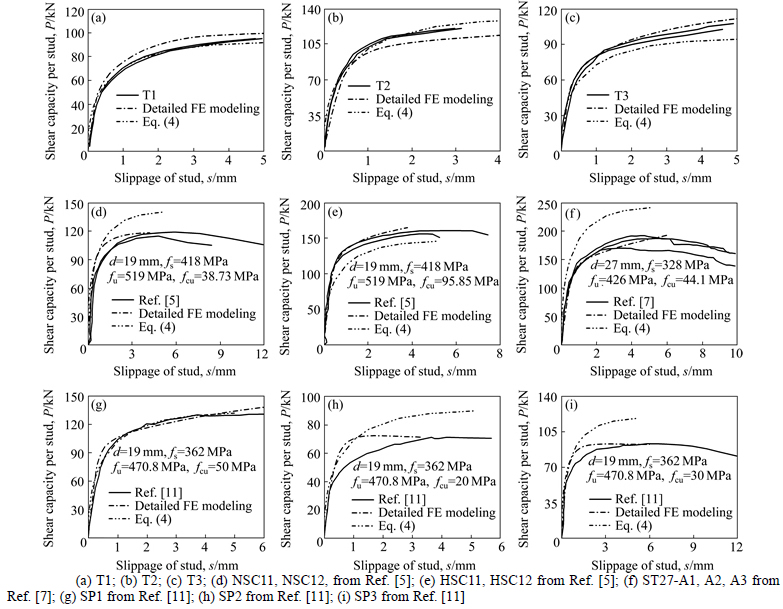
Fig. 8 Comparison of load-slip curves from results of detailed FE modeling and Eq. (4) and those from experiments, for push-out specimens:
The stress contours of steel, stud, and concrete for specimens T1, T2, and T3 at the ultimate state are shown in Fig. 9. It can be seen that, when the specimens failed, the maximum von Mises stress in the steel beam is small (less than 293 MPa) in comparison to that (440 MPa) of the headed stud. The stud displacement in the Z direction and the von Mises stress decreased gradually from the bottom to the top, and the bottom end of the studs is the first to reach the plastic stage. The upper surface of the headed stud is separated from the lower side of the concrete surface in the process of loading, as shown in Fig. 9(c).

Fig. 9 Stress contours of steel stud (a) and concrete (b) for specimens T1, T2, and steel stud and surrounding concrete (c) for specimens T3 at ultimate state
4 Parametric study of push-out specimens
We have shown that the detailed FE modeling approach can accurately describe the shear bearing capacity for the studs of the push-out specimens. In the following, a parametric study is conducted to investigate the dominant factors on the ultimate shear bearing capacity per stud. Published research results [19] have shown that the main factors are 1) concrete strength, 2) stud diameter, 3) yield strength of stud, 4) number of studs in push-out specimen, 5) length to diameter ratio of stud, and 6) transverse reinforcement ratio. The effects of those factors are investigated and are quantified in this section. The overall geometry of specimens in this parametric investigation, namely the geometry of concrete slab, steel beam, headed studs, and steel rebars, is identical to that of the validated FE models (i.e. the tested specimens as shown in Fig. 1).
4.1 Influence of concrete strength
In this investigation, the studs in the FE specimens are specified with the yield strength of 390 MPa and with diameters ranging from 16 to 30 mm. A number of concrete strengths fcu from 20 to 100 MPa are taken into account, resulting in 54 specimens in the FE calculation. The calculated ultimate shear capacity per stud is defined according to the maximal value in the load-slip curve from push-out specimens, as shown in Fig. 10(a). As can be seen from the figure, the ultimate shear capacity per stud increased with the increase of concrete strength in a range from 20 to 100 MPa, but the growth rate slowed with the increase of concrete strength. This conclusion is consistent with existing experimental results from Refs. [5, 11] As can be seen from Fig. 10(a), the increase of ultimate shear capacity per stud is about 123.1% for the stud diameter of 16 mm, 118.8% for the diameter of 19 mm, 101.0% for the diameter of 22 mm, 88.5% for the diameter of 25 mm, 84.4% for the diameter of 27 mm, and 66.7% for the diameter of 30 mm when the concrete strength increased from 20 to 100 MPa.
4.2 Influence of stud diameter
In this investigation, the studs of FE specimens are specified with the yield strength of 390 MPa. The calculated ultimate shear capacity per stud for each push-out specimen with different stud diameters as shown in Fig. 10(b). As can be seen from the figure, the ultimate shear capacity per stud increased with the increase of stud diameter in a range from 16 to 30 mm. More specifically, as the stud diameter increased from 16 to 30 mm, the increase in ultimate shear capacity per stud is 138.1% for 20 MPa concrete strength, 133.8% for 30 MPa concrete strength, 115.1% for 40 MPa concrete strength, 106.7% for 50 MPa concrete strength, 106.5% for 60 MPa concrete strength, 105.1% for 70 MPa concrete strength, 99.0% for 80 MPa concrete strength, 99.2% for 90 MPa concrete strength, and 99.7% for 100 MPa concrete strength.
4.3 Influence of yield strength of studs
In this investigation, the FE specimens are specified with the concrete strength of 50 MPa. The calculated ultimate shear capacity per stud for each push-out specimen with different yield strengths is shown in Fig. 10(c). As can be seen from the figure, as the yield strength of the studs increased from 345 MPa to 500 MPa, the increase in ultimate shear capacity per stud is 33.3% for the 16 mm diameter stud, 30.7% for the 19 mm stud, 27.2% for the 22 mm stud, 28.3% for the 25 mm stud, 27.1% for the 27 mm stud, and 27.9% for the 30 mm stud.
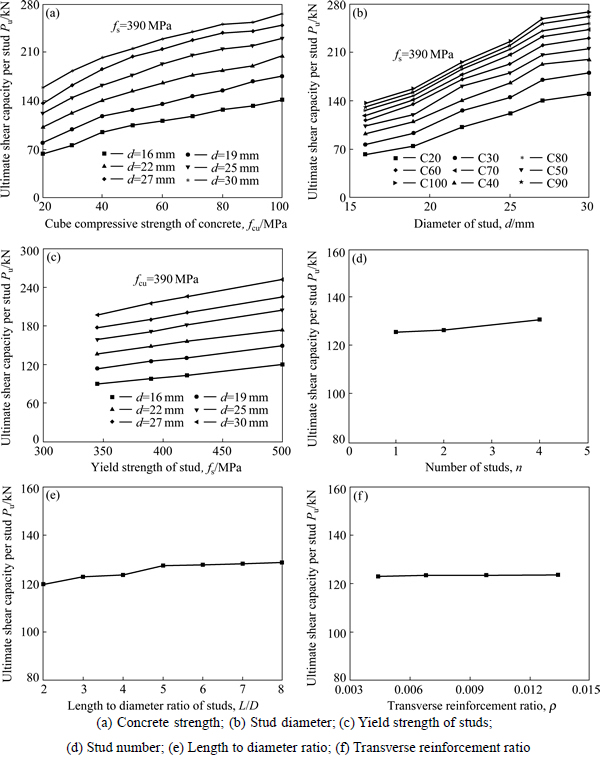
Fig. 10 Effects of main factors on shear bearing capacity per stud in push-out specimens:
4.4 Influence of number of studs
In this investigation, the FE specimens are specified with the concrete strength of 50 MPa and yield strength of 390 MPa for studs, but are assembled with 1 to 4 studs on each concrete slab. The studs all had the same diameter of 16 mm. The calculated ultimate shear capacity averaged by the number of studs is shown in Fig. 10(d). As can be seen from Fig. 10(d), the increase in ultimate shear capacity per stud is about 4.15% when the number of studs on each concrete slab increased from 1 to 4. That is, the change of ultimate shear capacity per stud is not obvious with the increase in the number of studs.
4.5 Influence of length to diameter ratio of studs
In this investigation, the concrete strength, steel yield strength, and stud diameter are the same as those defined in Section 4.4. Each specimen is modeled with 4 studs and the length to diameter ratio of the studs increased from 2 to 8. The calculated ultimate shear capacity per stud is shown in Fig. 10(e) as a function of the length to diameter ratio of the stud. As can be seen from Fig. 10(e), the increase of ultimate shear capacity per stud is about 7.36% when the length to diameter ratio of stud increased from 2 to 8. Therefore, the length to diameter ratio of studs appeared to have no obvious effect on the ultimate shear capacity.
4.6 Influence of transverse reinforcement ratio
In this investigation, the concrete strength, diameter, and yield strength of studs are the same as those defined in Section 4.4, and only one stud is assembled on each concrete slab. The calculated ultimate shear capacity per stud for the specimens with different transverse reinforcement ratios of 0.44%, 0.68%, 0.98%, and 1.34% is shown in Fig. 10(f). As can be seen from Fig. 10(f), the increase in ultimate shear capacity per stud is about 0.45% when the transverse reinforcement ratio increased from 0.44% to 1.34%. Thus, the transverse reinforcement ratio showed no effect on the ultimate shear capacity of the studs.
5 Simplified FE modeling approach of studs in composite beams
The shear studs are modeled using solid elements in the above detailed FE modeling. This approach normally required a large number of elements, so that the solution process required time and a large data storage space. Such a process may not be convenient for structural analysis of steel-concrete composite beams. For a steel- concrete composite beam, studs can also be simulated by beam or spring elements. A simplified modeling approach is developed to describe the load-slip relationship of shear studs in steel concrete composite beams under monotonic loading, where they are represented by springs with specified load-slip relationships in the transverse direction, or by beam elements with their transverse stiffness calculated by ABAQUS.
5.1 Lateral stiffness of shear studs
For the load-slip curves of the shear studs, a well-known formula was proposed by OLLGAARD et al [2] in 1971 that has been widely used.
P/Pu=(1-e-0.71s)0.4 (4)
where s is the average slip, P is shear capacity per stud. For a slip up to 5 mm, P reaches 99% of the ultimate load Pu.
A few formulas have been suggested to calculate the shear capacity of studs. That proposed by OLLGAARD et al [2] is adopted in the latest steel structure design code�CAISC 360 [3] as follows:
 (5)
(5)
where As is the cross-section area of the stud, Ec is the elastic modulus the of concrete, fu is the ultimate strength of the stud and  is the cylinder compressive strength, which can be converted to cubic compressive strength fcu.
The proposed formula for stud shear capacity in Chinese standard GB50017��2003 is
 (6)
(6)
where fc is the uniaxial compressive strength of concrete.
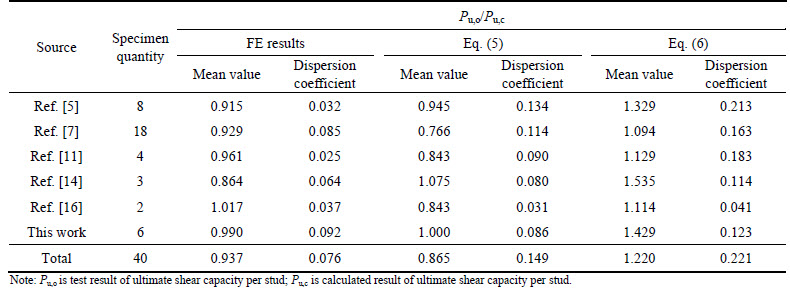
The experimental results from the push-out specimens are compared with those calculated by detailed FE modeling and by the recommended formula in GB50017��2003 and AISC 360 (i.e. Eq. 5), and are shown in Table 2. The average value of the ratios between the test results and calculated results by detailed FE modeling is 0.937 with a dispersion coefficient of 0.076. The average ratios of the experimental results to calculated results using Eq. (5) are 0.865 with a dispersion coefficient of 0.149. The average ratios of the test results and calculated results using Eq. (6) from Chinese standard GB50017��2003 are 1.220 with a dispersion coefficient of 0.221.
Figure 8 shows a comparison of load-slip curves for the experimental results from push-out specimens, Eq. (4), and detailed FE modeling. When the ultimate shear capacity Asfu of a stud is high and the concrete strength is low (i.e. the cases in Figs. 8(e), (f) and (i)), the curves calculated by Eq. (4) showed an overestimation of the load compared to that from the detailed FE modeling and the test results. Overall good agreement is found, especially as shown in Figs. 8(a), (b), (c), and (d). It appears reasonable to use Eq. (4) or the load-slip curves from detailed FE modeling to define the stiffness of springs in the transverse direction along the steel- concrete interface. These springs can be used to simulate studs, thereby providing a simplified FE modeling approach rather than the detailed FE modeling presented in Section 3.
5.2 Simplified FE models
Simplified FE models are established using ABAQUS. In these models, the constitutive relations of concrete, steel, studs, and steel rebar are defined in Eqs. (1) to (3). The parameter ��1 in Eq. (1) is taken as 2.5  and other parameters are consistent with those used in the detailed FE modeling. Again, concrete is meshed with solid element C3D8R. 4-node reduced integral format shell elements (S4R) are used to mesh the steel beam. Also, 9-node Simpson integration is adopted along the thickness of shell elements. The rebar part is also meshed by the truss element T3D2. Embedded constraint is applied between the rebar and surrounding concrete in the reinforced concrete slab. There is no contact between the steel beam and the concrete. The transverse stiffness (i.e. perpendicular to the axial direction of the studs) of the springs for consideration of the nonlinear load-slip relationship could be taken from Eq. (4) or from the detailed FE modeling results respectively, and the DOFs of the springs in other directions are coupled with concrete.
Table 2 Comparison between tested and calculated curves on shear bearing capacity of studs
5.3 Validation on steel-concrete composite beam specimens
As the push-out specimen had fewer studs and is small in size, it could not reflect the advantage of studs simulated by the spring. Therefore, larger full-scale steel concrete composite beams with more studs are chosen to verify the calculation efficiency of the proposed simplified modeling approach. In the full-scale steel-concrete composite beams, a number of such studs are used as springs. The specimen SCB3 in Ref. [20] is adopted, and the main parameters of the steel-concrete composite beam are shown in Fig. 11(a), where the yield strength of the steel bar is 290 MPa, the yield strength of the steel beam is 310 MPa, and the ultimate tensile strength of the studs (��19��90@148) is 431 MPa. The cubic compressive strength of the concrete is 32 MPa. The specimen from DING et al [18] is also selected, and the main parameters of the steel-concrete composite beam are shown in Fig. 11(b), where the yield strength and ultimate tensile strength of the steel bar are 294 and 450 MPa, the yield strength and ultimate tensile strength of the steel beam are 304 and 436 MPa respectively, and the yield strength and ultimate tensile strength of the studs (��16��70@120) are 410 and 475 MPa respectively. The cubic compressive strength of the concrete is 56.4 MPa.
Full size models of steel-concrete composite beams are established and the boundary of the steel-concrete composite beam is simply supported as in the experiments. The detailed geometries of the concrete- composite beams can be found from Refs. [18] and [20]. The load is applied through increments of displacement and material nonlinearities are considered and solved using the incremental-interactive method in ABAQUS. Two approaches are used to establish the FE models for stud connectors. In the FE model shown in Fig. 12(a), the studs are represented by springs and their nonlinear stiffness to reflect the load-slip relationship is defined according to Eq. (4) or the results from detailed FE analysis. In the FE model shown in Fig. 12(b), beam element (B31) is used to model the studs; the stiffness of the beam elements to represent the nonlinear load-slip relationship is then calculated by ABAQUS.
The results of load (Pb) and mid-span deflection (yc) curves from the simplified FE modeling are compared with the experimental results for the simply supported composite beams from DING et al [18] and NIE et al [20], as shown in Fig. 11. Figure 13 shows similar comparisons for the relationships between the load (Pb) and the slippage (sb) at the beam end. In these comparisons, the studs are simulated either by beam elements defined by a nonlinear load-slip relationship calculated by ABAQUS, or by springs defined by the load-slip relationship of studs from the detailed FE analysis. No obvious differences are found between the results obtained from these three simplified modeling approaches for the shear studs with the investigated geometries. The simplified FE modeling approach using springs or beam elements can provide satisfactory modeling results for the experimental scenarios investigated.
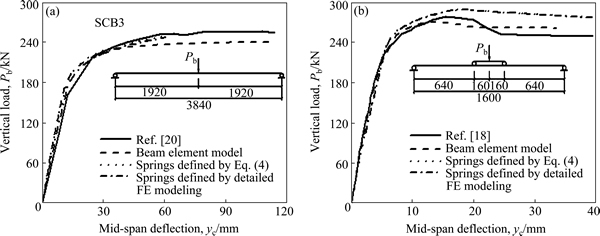
Fig. 11 Comparison of load and mid-span displacement curves between experimental results and simplified modeling results using beam elements and spring elements for steel-concrete composite beams from experiments by NIE et al [20] (a) and experiments by DING et al [18] (b)
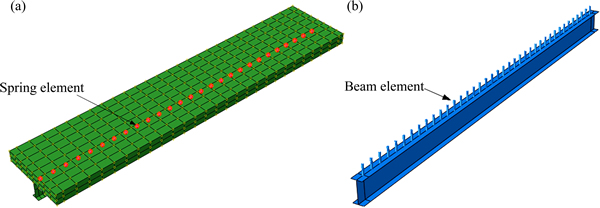
Fig. 12 Simplified FE models for steel-concrete composite beams using spring elements (a) and beam elements for studs (b)
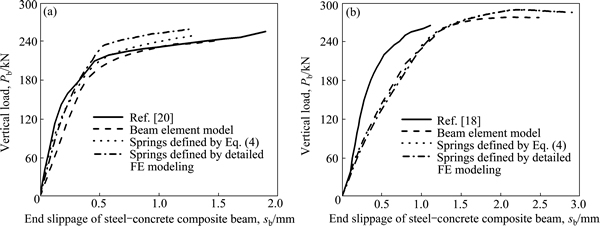
Fig. 13 Comparison of load-end slip curves between experimental results and simplified modeling results using beam elements and spring elements for steel-concrete composite beams from experiments by NIE et al [20] (a) and experiments by DING et al [18] (b)
6 Conclusions
1) The experimental results demonstrate that the ultimate shear capacity per stud in the push-out specimens increased with the diameter and yield strength of the studs. More specifically, when the stud diameter increases from 16 mm to 19 mm, the ultimate shear capacity per stud increases by about 21%. The ultimate shear capacity per stud increased by about 11% when the yield strength of studs increases from 365 MPa to 410 MPa, or when the concrete strength increased from 39.1 MPa to 46.5 MPa.
2) A detailed FE modeling approach is developed in which the shear studs are modeled by solid elements. This approach shows high precision in terms of the ultimate shear capacity per stud but less efficiency in calculation. It would be applicable for modeling push-out specimens when not many studs are installed. A parametric study is performed using the detailed FE to quantify the ultimate shear capacity per stud in the push-out specimens. It is found that the ultimate shear capacity per stud is dominated by concrete strength and by the diameter and yield strength of the studs.
3) A simplified FE modeling approach is developed to model shear studs using beam or spring elements. For the latter, the spring stiffness could be defined using the formulation of load-slip curves developed for shear studs by Ollgaard or the load-slip curves of studs in push-out specimens from our detailed FE modeling. The simplified modeling approach developed in the current study predicted the load displacement responses of steel- concrete composite beams and compared well with experimental scenarios from the literature. Our simplified approach further demonstrates much higher efficiency in calculation than the detailed FE modeling approach, especially for large scale steel-concrete composite structures with a number of shear studs. Finally, no obvious differences are found from the results in terms of modeling using beam or spring elements for the shear studs over the investigated range.
References
[1] ZHOU Wang-bao, JIANG Li-zhong, LIU Zhi-jie. Closed-form solution for shear lag effects of steel-concrete composite box beams considering shear deformation and slip [J]. Journal of Central South University of Technology, 2012, 19(10): 2976-2982.
[2] OLLGAARD J G, SLUTTER R G, FISHER J W. Shear strength of stud connectors in lightweight and normal-weight concrete [J]. AISC Engineering Journal, 1971, 8(2): 55-64.
[3] ANSI/AISC 360-05. Specification for structural steel buildings [S].
[4] GB 50017��2003. Design of steel structures [S]. (in Chinese)
[5] LI A, CEDERWALL K. Push-out tests on studs in high strength and normal strength concrete [J]. Journal of Construct Steel Research, 1996, 36(1): 15-29.
[6] GATTESCO N, GIURIANI E. Experimental study on stud shear connectors subjected to cyclic loading [J]. Journal of Constructional Steel Research, 1996, 38: 1-21.
[7] SHIM C S, LEE P G, YOON T Y. Static behavior of large stud shear connectors [J]. Engineering Structures 2004, 26(12): 1853-1860.
[8] TAHIR M M, SHEK P N, TAN C S. Push-off tests on pin-connected shear studs with composite steel�Cconcrete beams [J]. Construction and Building Materials, 2009, 23(9): 3024-3033.
[9] SMITH A L, COUCHMAN. Strength and ductility of headed stud shear connectors in profiled steel sheeting [J]. Structural Engineering and Mechanics, 2014, 66(6): 748-754.
[10] LEE Y H, MIN S K, KIM H, KIM D J. Shear resistance of stud connectors in high strength concrete [J]. Steel and Composite Structures, 2014, 52(4): 647-661.
[11] LAM D, EL-LOBODY E. Behavior of headed stud shear connectors in composite beam [J]. Journal of the Structural Engineering, ASCE, 2005, 131(1): 96-107.
[12] NGUYEN H T, KIM S E. Finite element modeling of push-out tests for large stud shear connectors [J]. Journal of Constructional Steel Research 2009, 65 (2): 1909-1920.
[13] XU Chen, SUGIURA K. Parametric push-out analysis on group studs shear connector under effect of bending-induced concrete cracks [J]. Journal of Constructional Steel Research, 2013, 89(5): 86-97.
[14] XU Chen, SUGIURA K, WU Chong. Parametrical static analysis on group studs with typical push-out tests [J]. Journal of Constructional Steel Research, 2012, 72: 84-96.
[15] GB/T 10433��2002. Cheese head studs for arc stud welding [S]. (in Chinese)
[16] Eurocode 4. Design of composite steel and concrete structures, Part 1.1: General rules and rules for buildings [M]. Brusseles, Belguim: European Committee for Standardization (CEN), 2004.
[17] HIBBIT T, KARLSON S. ABAQUS version 6.4: Theory manual, users�� manual, verification manual and example problems manual [M]. Hibbitt, Karlson: Sorenson Inc, 2003.
[18] DING Fa-xing, YING Xiao-yong, ZHOU Lin-chao. Unified calculation method and its application in determining the uniaxial mechanical properties of concrete [J]. Front Archit Civ Eng China, 2011, 5(3): 381-393.
[19] ZHANG Pei-xin. Design of steel-concrete composite structure [M]. Shanghai: Shanghai Science and Technology Press, 2004: 114-117. (in Chinese)
[20] NIE Jian-guo, CAI C S. Steel-concrete composite beams considering shear slip effects [J]. Journal of Structural Engineering, 2003, 129(7): 495-506.
(Edited by DENG L��-xiang)
Foundation item: Project(2011BAJ09B02) supported by the National Key Technology R&D Program, China; Projects(51578548, 51378511, 51678576) supported by the National Natural Science Foundation of China
Received date: 2015-10-08; Accepted date: 2015-12-08
Corresponding author: DING Fa-xing, Ph.D., Professor; Tel: +86-13975801697; E-mail: dingfaxin@csu.edn.cn

