J. Cent. South Univ. Technol. (2010) 17: 593-602
DOI: 10.1007/s11771-010-0528-y 
Numerical simulation of cyclic behavior of double sand lenses and corresponding liquefaction-induced soil settlement
Y. PASHANG PISHEH, S. M. MIR MOHAMMAD HOSSEINI
Department of Civil and Environmental Engineering, Amirkabir University of Technology, Tehran, Iran
? Central South University Press and Springer-Verlag Berlin Heidelberg 2010
Abstract: A two-dimensional numerical model was used to explain the liquefaction mechanism of double sand lenses and the corresponding soil deformation due to the cyclic loading. Moreover, in order to investigate the influences of the soil characteristics and input loading data a parametric study was carried out on the essential parameters affecting the soil settlement, and so the variation of these parameters with the corresponding displacements was mainly examined. At last, the results obtained from the numerical analyses of double sand lenses and a continuous sand layer with similar characteristics were compared with those of an estimating method proposed by ISHIHARA and YOSHIMINE. The comparisons show that the settlements due to liquefaction of the continuous sand layer in both numerical and the estimating method are in a good agreement with and are obviously greater than those of double sand lenses.
Key words: liquefaction; ground failure; cyclic loading; double sand lenses; deformation
1 Introduction
As one of the most complex and controversial topics in geotechnical earthquake engineering, liquefaction is a major seismic hazard to structures. Many failures of various structures such as tailing dams, retaining structures, and harbors have been attributed to the liquefaction of saturated soils. The soil liquefaction refers to the occurrence of ground failure induced by strong earthquakes when the effective stress within the soil approaches zero as a result of the increase in pore water pressure during earthquakes. Although liquefaction seems to be a major cause of all damages mentioned above, little harm occurs unless the liquefied condition leads to some forms of ground disruption or ground failure.
Ground failure in the form of sand boils, lateral spreads and settlement is the common effect of liquefaction in soil deposits. However, in many regions with proper soil specifications, large deformations have been observed in the ground surface after huge earthquakes. These areas were situated near the seas containing some sedimentary layers of loose and comparatively uniform fine sand surrounded by clayey or silty soils. Indeed, the settlement of these coastal areas after earthquake is related to liquefaction of the sand layers commonly named sand lenses due to their rather small thickness and ends curvature. Thus, the liquefaction of these sand lenses and the corresponding ground disruption can result in extreme damages in structures such as buildings, bridges, dams, railroads over these layers.
The main reason of destructions due to the San Francisco earthquake on April 18, 1906 has been revealed for the existence of loose and saturated sand lenses and liquefaction occurrence in these materials. During and after this disaster some landslides and ground failures took place inside and outside the city [1]. Furthermore, the role of sand lenses liquefaction in earthquake devastations could be clearly observed in the Good Friday Earthquake in which a subduction zone struck Alaska on March 27, 1964, causing extensive subsidence along the south-central coast [2]. The earthquake triggered thousands of landslides, including many at Government Hill and Turnagain Heights and was responsible for several casualties and damages to many buildings. The regional stratigraphy generally consists of (1) glacial till unconformably overlying bedrock; (2) silty clay of the Bootlegger Cove Formation resting on the till or bedrock; and (3) outwash sand and gravel on the surface [3]. The silty clay deposits of 30- 45 m in average thickness contained discontinuous layers of sand and scattered pebbles [4]. Extensive geotechnical investigations by SEED [1] illustrated that liquefaction of sand layers and sand lenses within the clay deposits might have contributed to the failure of the bluffs. Stratigraphic sections (Figs.1 and 2) produced shortly after the earthquake were helpful for elucidating the mechanics of these dramatic ground failures and demonstrating an average ground deformation of 10.5 m in these regions [1, 4-5]. In Figs.1 and 2, dashed lines approximate the prequake ground surface and scales are the same in each diagram with no exaggeration.

Fig.1 Geological cross sections through Government Hill landslide modified from HANSEN [5] (a) and Turnagain Heights landslide modified from SEED and WILSON [4] (b)
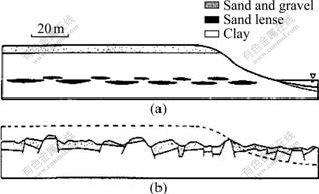
Fig.2 Sand lenses liquefaction and landslides in Turnagain Heights: (a) Before earthquake; (b) After earthquake
In addition, some relative disasters happened during Chile earthquake in 1960, Washington earthquake in 1965 and Guam earthquake in 1993. The main or one of the most important causes for the corresponding destructions has been known to be the liquefaction of sand lenses located in the soil deposits in these areas [6-8]. According to some disasters mentioned above, in current study, the behavior of double sand lenses subjected to a dynamic loading is studied and then a post-liquefaction analysis is performed to assess the dissipation of the excess pore pressure and the effective stress increase in liquefied sand soil material. Afterwards, the influence of some affecting parameters including surrounding soil and lenses characteristics and input acceleration on the soil deformation is investigated. Thus, the sand lenses and surrounding fine soil have been modeled with the FLAC software and analyzed by the use of finite difference method (FDM). FLAC is a two-dimensional explicit finite difference program for engineering mechanics computation. This program can be used to simulate the behavior of structures built of soil, rock or other materials that may undergo plastic flow when their yield limits are reached. The dynamic feature in this software can be coupled to the ground water flow model; this permits the analyses involving the time-dependent pore pressure change associated with liquefaction [9-10].
2 Soil parameters and static modeling
In the static stage of analyses, the initial stress and pore water pressure in different types of existing soils should be determined. Hence, a grid was generated with 100 m in length and 20 m in height; then, double sand lenses were placed in the depth of 8 m from the ground surface. In mentioned model, the horizontal spacing between two lenses was equal to 4 m. As shown in Figs.3 and 4, the elliptical geometry was chosen for the sand lenses shape. Moreover, it should be noted that the water table in the corresponding model is in ground surface elevation. So, the sand lenses and surrounding fine soils are completely saturated. Table 1 illustrates the geometric properties of the reference model including the dimensions of the elliptical-shaped lenses.
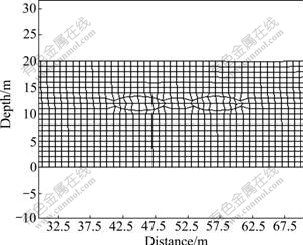
Fig.3 Enlarged grid used for modeling
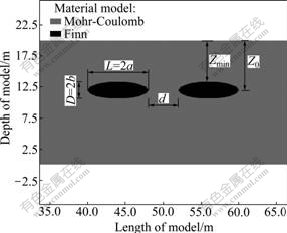
Fig.4 Geometric parameters of sand lenses and surrounding fine soil
Table 1 Geometric properties of elliptical shaped lenses and other dimensions
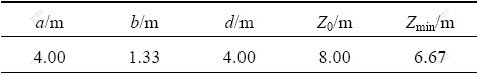
In Table 1, a and b are the semi-major and minor axes, respectively, d is the horizontal spacing between two adjacent lenses, Z0 is the distance between sand lenses origin and ground surface, and Zmin is the minimum distance between sand lenses and ground surface.
Modeling of the stress-strain behavior of surrounding clayey soil was carried out with simulating this material as an elasto-plastic material with Mohr-Coulomb criterion and a non-associated flow rule. This constitutive model is the conventional model commonly used to represent stress-strain behavior and the corresponding shear failure in soils and rocks. In addition, simulation of loose and saturated sand lenses behavior in analyses was made considering Finn model. Using this constitutive model, the dynamic pore pressure generation, especially, related to the liquefaction can be modeled by accounting for irreversible volume strains. This model captures the basic mechanisms that can lead to liquefaction in saturated sand soils.
It is worth noting that in the corresponding numerical model the strength-deformation characte- ristics related to the surrounding fine soil are set to clay with medium plasticity; further, the maximum shear modulus in loose sand soil has been estimated based on an equation proposed by SEED and IDRISS [11] for the relation between shear modulus and confining pressure as follows:
 (1)
(1)
 (2)
(2)
where K2,max is a constant determined from the void ratio or relative density,  is the mean effective normal stress,
  is Poison ratio, Gmax is the maximum shear modulus, and Kmax is the maximum bulk modulus in the sand lenses.
The mechanical properties of cohesive and granular soils used in the analyses are represented in Tables 2 and 3, respectively. In Tables 2 and 3, E is the modulus of elasticity, is the effective internal friction angle, c′ is the effective cohesion, n is the porosity, k is the permeability coefficient, (N1)60 is the modified standard penetration test value, and Dr is the relative density of the soil materials. It should be noted that in the current study, the analyses are carried out using the granular soil with Dr=40% and the rest types of materials considered in Table 3 are only used for the parametric study.
The model subjected to its weight is analyzed statically. The results obtained from this analysis are shown in Fig.5 as stress and pore pressure contours.
3 Dynamic modeling
Numerical methods relying on the discretization of a finite region of space require the appropriate conditions enforced at the artificial numerical boundaries. In static analyses, fixed or elastic boundaries can be realistically placed at some distance from the region of interest. But in dynamic problems, however, such boundary conditions cause the reflection of upward propagating waves back into the model and do not allow the necessary energy radiation. So, instead of simple boundary conditions used in static analyses the free-field boundary conditions were applied to the left and right side vertical boundaries [12]. These conditions cause absorbing most of the energy in the wave reflected from the side boundaries and preventing disorder of propagating waves.
Table 2 Clayey soil specifications used for analyses

Table 3 Sand soil parameters used for analyses
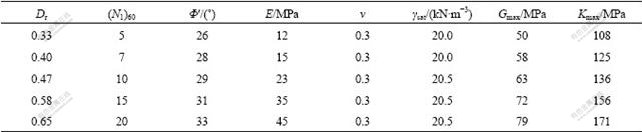
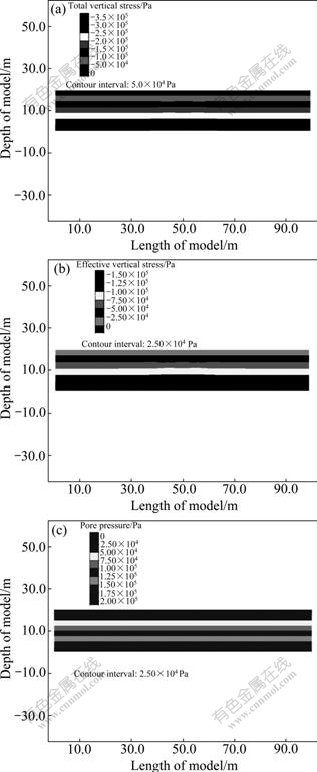
Fig.5 Initial total stress contours (a), initial effective stress contours (b) and initial pore pressure contours (c) in model
Basically, granular materials exhibit permanent volumetric deformation during drained cyclic loading. This permanent volumetric deformation is the primary reason for the progressive build-up of excess pore pressure during undrained cyclic loading that leads to liquefaction. Several empirical formulas have been proposed to compute the volumetric strains due to shear strain changes. MARTIN et al [13] proposed an empirical relationship that relates the incremental volumetric strain, ?εvd, to cyclic shear strain amplitude, γ, where in the following equation (Eq.(3)), γ is presumed to be the engineering shear strain and εvd is the current accumulated volumetric strain.
 (3)
(3)
where C1, C2, C3, and C4 are constants. It can be noted that the above equation enables the volumetric strain increment to decrease with accumulation of strain. Another alternative and simple formula that was used in this work is proposed by BYRNE [14]:
 (4)
(4)
where C1 and C2 are constants with different interpretations from those of Eq.(3) and can be related to the relative density, Dr, by the following equations [14]:
 (5)
(5)
 (6)
(6)
The Finn model incorporates Eq.(4) into the standard Mohr-Coulomb plasticity model to simulate the mechanism which can lead to liquefaction. In addition to this model and simulating the variation of secant shear modulus of each element of sand with the increase of cyclic shear strain amplitude, a program was coded with C++. This program that employs the extended Masing model [15] could simulate the stiffness degradation nature and plot the hysteresis loops of stress-strain variation diagram of loose sand soils during applying the cyclic loading as it can be seen later.
Before performing the main dynamic analyses, some analyses were carried out to examine the influence of input frequency on the soil settlement response by using distinct values of this parameter. The results related to the maximum vertical deformation of soil due to liquefaction of sand lenses are presented in Fig.6 for different values of input frequency. As shown in Fig.6, the maximum soil deformation in these series of analyses

Fig.6 Maximum vertical displacement histories for different input frequencies
is obtained through applying dynamic input with frequency equal to 5 Hz. So, this frequency was chosen for making the main analyses in the latter sections as the fundamental frequency.
After evaluation of the model fundamental frequency, the main dynamic analyses of double sand lenses subjected to horizontal basement acceleration were carried out. Thus, a constant-amplitude harmonic acceleration wave as a sinusoidal signal (see Eq.(7)) was applied horizontally to all nodes of the basement in x-direction corresponding to xy-axes for the model.
 (7)
(7)
where Amax is the wave amplitude, f is the frequency, and t is the time duration. Considering the amplitude of this wave, Amax=1.96 m/s2, the reference frequency, f=5 Hz, and duration, t=10 s, the mechanisms of sand lenses liquefaction and soil deformation due to this event are investigated. It can be seen from Fig.7(a) that the effective stress in sand lenses decreases and tends to zero after a few cycles of loading and liquefaction occurs in sand soils in this time (t=2.4 s). Also, as illustrated in Fig.7(b), after advent of liquefaction in sand lenses, the maximum excess pore pressure tends to stabilize; although, the cyclic loading in the model is still going on. This may confirm that a critical pore pressure exists, corresponding to the initiation of liquefaction, which cannot be exceeded.
The residual pore water pressure at the end of each cycle increases progressively with increasing number of cycles. The rate of pore water pressure development accelerates as liquefaction is approached, at which point strain amplitudes rapidly increase (Fig.8). In addition, Fig.9 represents the vertical effective stress contours at the end of loading. It can be seen that at the end of loading stage, the granular soil in the lenses is completely liquefied and the effective stress of these materials decreases extensively to the value near zero.

Fig.7 Vertical effective stress (a) and pore water pressure (b) in sand lenses during cyclic loading
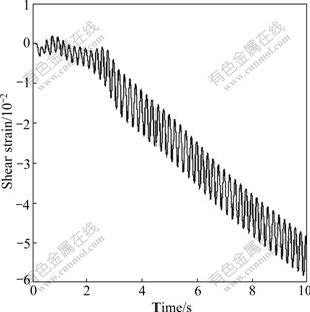
Fig.8 Shear strain increase in sand lenses elements during applied loading
The hysteresis loops were modeled during increase in shear strain in sand lenses as shown in Fig.10. It can be considered that the shear modulus decreases with increasing shear strain and at the end of loading the shear modulus magnitude decreases down to 5% of its initial values.
The soil vertical displacement after liquefaction of sand lenses is shown as contours in Fig.11. It can be observed that occurring liquefaction in double sand lenses and settlement formation in sand soils, a bowled settled medium in the middle of double sand lenses is established. Also, the maximum magnitude of soil settlement occurs near the liquefied lenses while this deformation decreases with increasing distance of lenses horizontally and vertically. So, in a distance of 3 to 4 times of lenses length, the settlements are approximately negligible.
4 Post-liquefaction analysis
At the end of dynamic loading, the soil situated in
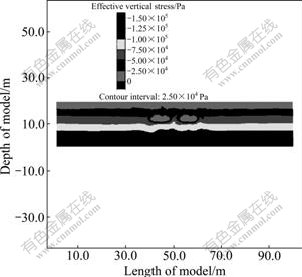
Fig.9 Effective stress contours at end of loading

Fig.10 Hysteresis loops in sand lenses during cyclic loading

Fig.11 Soil vertical deformation contours due to liquefaction of double sand lenses
lenses region is completely liquefied, and the effective stress in sand lenses approaches to approximately zero. In this occasion, with initiation of sand soil consolidation and excess pore pressure dissipation, the latter stage starts just at the end of applying the acceleration wave and is characterized by an exponential decrease of residual pore pressure with time as discussed by KUDELLA and OUMERACI [16]. The excess pore water pressure dissipations after 1, 10, and 60 min of loading are shown in Figs.12(a)-(c), respectively. It can be seen that the rate of the pore pressure decrease is huge at first and then becomes lower; therefore, vast time is needed for the complete dissipation of pore pressure in the sand lenses.
Figs.13(a)-(c) respectively show soil vertical deformation increase after 1, 10, and 60 min of the loading. It can be seen that the increase in the deformations of the soil layers occurs very slowly, and only 4 mm of settlement is added to the existing deformation after 60 min of end of the loading.
5 Parametric studies
In order to investigate the influence of various parameters on the ground displacements due to liquefaction of double sand lenses, a parametric study was carried out in the models with different parameters for cohesive and granular soils subjected to dynamic excitation. It should be noted that the acceleration used to shake the base in the analyses was equal to 1.96 m/s2; besides, to assess the effect of lenses geometry and dimensions, these analyses were performed on the sand lenses in elliptical shape with different values for semi-major and minor axes, a and b, but a constant ratio (a/b=3) for these parameters.
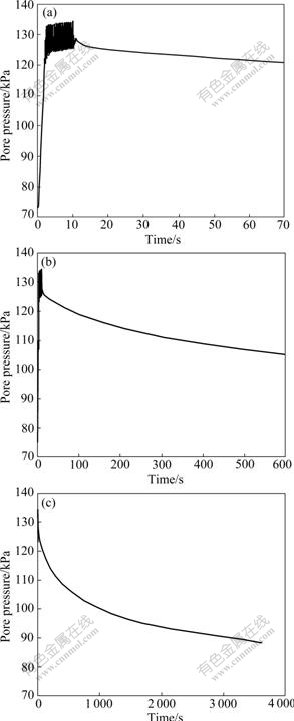
Fig.12 Excess pore water pressure dissipation after 1 min (a), 10 min (b) and 60 min (c) of loading
5.1 Influence of surrounding clayey soil cohesion
Figs.14(a) and (b) show the effect of clayey soil cohesion on vertical ground displacements relating to the regions close to the liquefied lenses and the ground surface layer, respectively. It can be seen that increasing the cohesion parameter of the clayey soil from 5 to 40 kPa, the maximum magnitudes of vertical displacements decrease either near the liquefied sand lenses or the ground surface layer. Moreover, the ratio of this decrease is rapid in the low cohesion, whereas in models with the clay cohesion greater than 30 kPa this tendency seems to remain relatively constant.
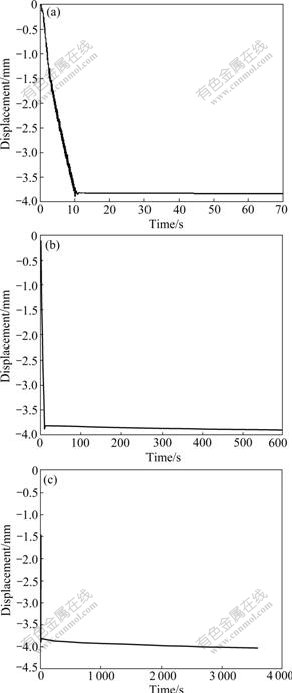
Fig.13 Maximum soil vertical deformation after 1 min (a), 10 min (b) and 60 min (c) of loading
5.2 Influence of friction angle of cohesive soil
Figs.15(a) and (b) represent the displacements near the sand lenses and on the ground surface far from the lenses, respectively. According to Fig.15, as expected, the vertical displacements diminish with increasing internal friction angle in clay soil; however, for clays with internal friction angle less than 8? or greater than 20? the decrease of the displacement is very small. So, the vertical displacement seems to be more sensitive to the value of clay frictional angle in the range from 10? to 20?.
5.3 Influence of sand material relative density
The effects of improvement in sand soil characteristics used in lenses as an increase in relative density, Dr, or standard penetration test values, (N1)60, are shown in Figs.16(a) and (b). It can be seen that increasing the SPT magnitudes in the sand lenses may result in the decrease of the soil deformations due to liquefaction of sand lenses. In addition, the trend of this decrease in the case of sand materials with relative density values lower than 40% (or (N1)60<7) is clearly slow and increasing this parameter from 40% to 55%, as a deep slope zone for 7<(N1)60<15 in Fig.16(a), leads to a high decrease in soil deformation due to liquefaction of sand materials.
Furthermore, the number of cycles required for liquefaction occurrence increases with increasing material density and decreasing soil porosity. In other words, the more the sand soil density is, the more time for pore pressure ratio to reach unique magnitude will be needed.
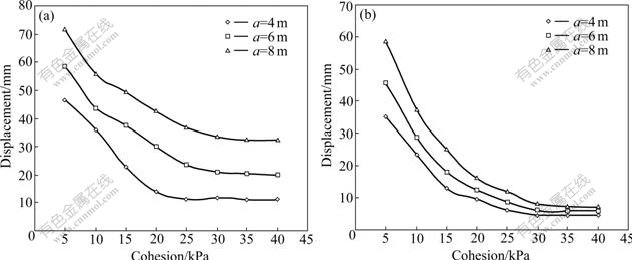
Fig.14 Effect of clayey soil cohesion changes on maximum vertical displacements (a) and maximum ground surface settlement (b)
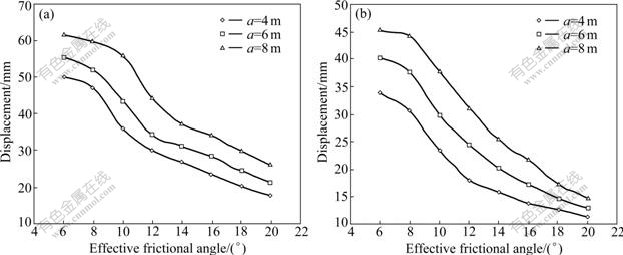
Fig.15 Influence of clayey soil friction angle changes on maximum vertical displacements (a) and maximum ground surface settlement (b)
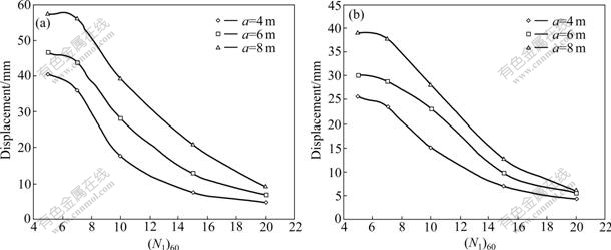
Fig.16 Effect of sand lenses compressibility characteristics on maximum vertical displacement (a) and maximum ground surface settlement (b)
5.4 Influence of input acceleration
Figs.17(a) and (b) summarize the variation of vertical displacements close to the sand lenses and on the ground surface during variation of input base shaking acceleration. As expected, increasing the input acceleration applied to the base of the model, the corresponding displacements increase consequently; however, in low or high acceleration (i.e. Amax< 1.47 m/s2 or Amax>3.92 m/s2) the rate of this variation appears to be very low. Yet, for moderate acceleration this rate leads to very rapid changes in the soil deformation.
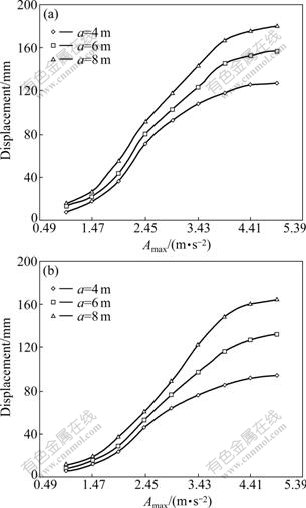
Fig.17 Influence of input acceleration variation on maximum vertical displacements (a) and maximum ground surface settlement (b)
6 Verification and comparison
In order to verify the numerical analyses used in this work, a model containing a continuous sand layer (Fig.18) was analyzed by FDM. Then, the results were compared with those using an empirical method to estimate the liquefied soil settlement by estimating graphs introduced by ISHIHARA and YOSHIMINE [17]. It should be noted that in this work, the analyses were performed on the soil groups similar to the former analyses except that the sand soil geometry was changed from double lenses to a continuous layer. In addition, to compare the soil displacement due to liquefaction of double sand lenses with those of a continuous sand layer with various densities, the results are plotted together in Fig.19. As shown in Fig.19, the results corresponding to the numerical analyses of liquefaction produced in continuous sand layer are in a good agreement with those from Ishihara-Yoshimine method. Moreover, comparing the analyses results related to double sand lenses and continuous sand layer demonstrates smaller deformations occurred due to liquefaction in the sand soil lenses. However, It should be noted that the deformations mentioned in this work are just related to the volumetric strains happened during liquefaction of loose and saturated sand soil and deformations due to sand boils or landslides which sometimes happen during liquefaction were not considered herein.
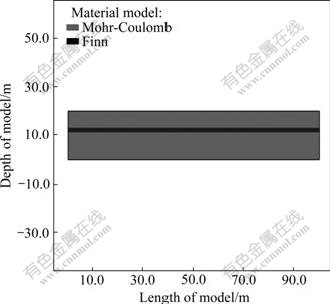
Fig.18 Continuous buried sand soil layer and surrounding fine soil material

Fig.19 Comparison between numerical and approximating methods for sand lenses and continuous layer analyses
7 Conclusions
(1) The mechanisms of double sand lenses liquefaction during undrained uniform cyclic loading and corresponding soil deformation due to this occurrence are studied. Accordingly, effective stress decrease, pore pressure increase and upper soil layers settlements are simulated by a finite difference method.
(2) After occurrence of liquefaction in sand lenses, large deformations as a bowled settled medium in the middle of double sand lenses are established. The maximum magnitude of the soil settlement occurs near the liquefied zone and however, in a distance of 3 to 4 times of lenses length, the corresponding settlements are negligible.
(3) Several significant parameters such as loading characteristics and material properties that could affect the sand lenses response are discussed and their influences on the soil deformation and ground surface settlement values are revealed.
(4) Performing numerical analyses on the models containing sand lenses and continuous sand layer in different values of densities and comparing them with an estimating method for the continuous layer illustrate a good agreement between numerical and the estimating methods for continuous buried sand layer. Besides, the ground settlements due to liquefaction of double sand lenses are considerably smaller than those of continuous sand layer.
References
[1] SEED H B. Landslides during earthquakes due to soil liquefaction [J]. Journal of the Soil Mechanics and Foundations Division, ASCE, 1968, 94(5): 1055-1122.
[2] PLAFKER G. Tectonics of the March 27, 1964 Alaska earthquake [R]. Reston, Virginia: U.S. Geological Survey Professional Report, 1969: I1-I74.
[3] MILLER R D, DOBROVOLNY E. Surficial geology of anchorage and vicinity, Alaska [R]. Reston, Virginia: U.S. Geological Survey Bulletin, 1959: 16-26.
[4] SEED H B, WILSON S D. The Turnagain Heights landslide, Anchorage, Alaska [J]. Journal of the Soil Mechanics and Foundations Division, ASCE, 1967, 93: 325-353.
[5] HANSEN W R. Effects of the earthquake of March 27, 1964, at Anchorage, Alaska [R]. Reston, Virginia: U.S. Geological Survey Professional Report 542-A, 1965: A1-A68.
[6] SHOKRI M. Investigation of liquefaction potential in sand lenses [D]. Tehran: Amirkabir University of Technology, 1996.
[7] MIR MOHAMMAD HOSSEINI S M, NATEGHI F. The crack development due to liquefaction of sand lenses during earthquake loading [C]// Proceeding of the Fourth International Conference on Recent Advances in Geotechnical Earthquake Engineering and Soil Dynamics. San Diego, California, 2001: 407-413.
[8] PASHANG PISHEH Y. Mechanism of soil deformation due to double lenses liquefaction and critical depth determination [D]. Tehran: Amirkabir University of Technology, 2004.
[9] CUNDALL P. Fast Lagrangian analysis of continua manual [EB/OL]. [2001-07-06]. http://www.itascacg.com/pdf/pub/cundall-pub.pdf.
[10] CUNDALL P. Explicit finite difference methods in geomechanics, in numerical methods in engineering [C]// Proceedings of the EF Conference on Numerical Methods in Geomechanics. Blacksburg, Virginia, 1976: 132-150.
[11] SEED H B, IDRISS I M. Soil moduli and damping factors for dynamic response analyses [R]. Berkeley: Report EERC70-10, Earthquake Engineering Research Center, University of California, 1970.
[12] FLAC: Fast Lagrangian analysis of continua. Version 4 [M]. Minneapolis: ITASCA Consulting Group Inc, 2002.
[13] MARTIN G R, FINN W D L, SEED H B. Fundamentals of liquefaction under cyclic loading [J]. Journal of the Geotechnical Engineering, ASCE, 1975, 101(5): 423-438.
[14] BYRNE P. A cyclic shear-volume coupling and pore-pressure model for sand [C]// Proceedings of the second International Conference on Recent Advances in Geotechnical Earthquake Engineering and Soil Dynamics. St. Louis, Missouri, 1991: 47-55.
[15] FINN W D L, LEE K W, MARTIN G R. An effective stress model for liquefaction [J]. Journal of the Geotechnical Engineering Division, ASCE, 1977, 103(GT6): 517-533.
[16] KUDELLA M, OUMERACI H. Liquefaction around marine structures (LIMAS)-large scale experiments on a Caisson Breakwater [R]. Brauncschweig: Technical University Braunschweig, 2004.
[17] ISHIHARA K, YOSHIMINE M. Evaluation of settlements in sand deposits following liquefaction during earthquakes [J]. Soil and Foundations, 1992, 32(1): 173-188.
Received date: 2009-07-23; Accepted date: 2009-10-16
Corresponding author: Y. PASHANG PISHEH, Doctoral candidate; Tel: +98-21-77825680; E-mail: yadolah_p@yahoo.com
(Edited by YANG You-ping)

