J. Cent. South Univ. Technol. (2008) 15: 700-705
DOI: 10.1007/s11771-008-0130-8

Fault detection of excavator’s hydraulic system based on dynamic principal component analysis
HE Qing-hua(何清华), HE Xiang-yu(贺湘宇), ZHU Jian-xin(朱建新)
(School of Mechanical and Electrical Engineering, Central South University, Changsha 410083, China)
Abstract: In order to improve reliability of the excavator’s hydraulic system, a fault detection approach based on dynamic principal component analysis(PCA) was proposed. Dynamic PCA is an extension of PCA, which can effectively extract the dynamic relations among process variables. With this approach, normal samples were used as training data to develop a dynamic PCA model in the first step. Secondly, the dynamic PCA model decomposed the testing data into projections to the principal component subspace(PCS) and residual subspace(RS). Thirdly, T2 statistic and Q statistic performed as indexes of fault detection in PCS and RS, respectively. Several simulated faults were introduced to validate the approach. The results show that the dynamic PCA model developed is able to detect overall faults by using T2 statistic and Q statistic. By simulation analysis, the proposed approach achieves an accuracy of 95% for 20 test sample sets, which shows that the fault detection approach can be effectively applied to the excavator’s hydraulic system.
Key words: hydraulic system; excavator; fault detection; principal component analysis; multivariate statistics
1 Introduction
Hydraulic system is the primary component of an excavator, and any occurrence of its faults during operation would greatly degrade the performance of the entire excavator. Recently, to meet the increasing demand of fast and efficient construction, mechanical and electric technology has been widely employed on the excavator. Hydraulic system is becoming more and more complex[1]. Therefore, there is an important significance to develop an effective fault detection approach for excavator’s hydraulic system.
Principal component analysis (PCA) is a linear dimensionality reduction technique[2-3]. PCA method can generalize lower dimensional representation of the original data, in terms of capturing the data direction that has the largest variance. PCA has been widely used to monitor the industrial processes with multiple variables and diagnose the system faults[4-5]. However, conventional PCA cannot reveal the exact correlations among the variables of dynamic processes. For this reason, an extension of PCA method, dynamic PCA, has been proposed for the dynamic process, which takes serial correlation into account by augmenting the observation vector with lagged variables[6-7]. In addition, the dynamic PCA method is valid to deal with data from nonlinear process[8]. The dynamic PCA has been successfully applied to monitoring process and fault diagnosis in chemical industry[9-11].
As the excavator’s hydraulic system is nonlinear with dynamic property, it is difficult to develop a fault detection technique based on analytic model[12]. Therefore, in this work, a fault detection approach based on dynamic PCA was put forward. In this approach, a dynamic PCA model was developed by the training data at first, and then used to decompose testing data into two projections on principal component subspace(PCS) and residual subspace(RS). Finally, T2 statistic and Q statistic performed fault detection in PCS and RS, respectively.
2 Dynamic principal component analysis
2.1 Principal component analysis
Consider an auto-scaled data matrix X with m variables and n observations, which is configured as follows:
 (1)
(1)
where xi (i=1, 2, …, n) is an observation vector of dimension m.
Since each variable in matrix X has been auto-scaled to zero mean and unit variance, the covariance matrix can be defined as
 (2)
(2)
As covariance matrix  is symmetrical, it can be computed via the singular value decomposition (SVD)
 (3)
(3)
with

where  diag(λ1, λ2, …, λm) is the eigenvalue matrix with elements in decreasing magnitude order and P=[p1, p2, …, pm]T is the eigenvector matrix (loading matrix) corresponding to
 .
.
The principal components(PCs) can be constructed as a linear transformation of X by combining P in following manner[2]:
 (4)
(4)
where T=[t1, t2, …, tm]T and t1, t2, …, tm are the first, second, …, mth PC of X, respectively.
To retain the optimal number of PCs, the total variance explained is often used as the criterion[3], as defined by
 (5)
(5)
where ηk is the percentage of total variance explained by the first k(<m) PCs.
If the first k PCs retained in the PCA model are chosen, matrix X in the measure space can be decomposed into the summation of projections to two subspaces[4]
 (6)
(6)
where
 (7)
(7)
is the projection to PCS, and
 (8)
(8)
is the projection to RS and Pk represents the first k columns of P.
2.2 Dynamic principal component analysis
PCA is basically a static method, which assumes that the observations at one time instance and observations at past time instances are independent. Considering dynamic correlations, the PCA method can be integrated by auto-regressive with extra input (ARX) model. By augmenting each observation vector with the previous l observations, a dynamic observation vector at time t can be constructed as follows[5]:
xd(t)=[xT(t), xT(t-1), …, xT(t-l)]T (9)
where xd(t) is the dynamic data matrix of M=m(l+1) dimensions and l is the lagged time. Then, the data matrix for dynamic PCA is as follows:
 (10)
(10)
where N is the sample number.
By applying PCA to the dynamic data matrix in Eqn.(10), the dynamic relationships among variables are extracted from the data, rather than a static approximation. This method used for analysis of dynamic data is referred to as dynamic PCA.
3 T2 statistic and Q statistic
A measure of variation within PCS is given by T2 statistic which is defined as[4]
 (11)
(11)
where  represents the first k rows and columns of and x is a observation vector of dimension m. Then, the threshold for the T2 statistic can be calculated using the probability distribution:
 (12)
(12)
where α is the confidence level of F distribution with k and n-k degrees of freedom.
Q statistic is used to monitor the variation inside RS, which can be defined as[10]
 (13)
(13)
where  The threshold can be obtained to approximate fit to the normal distribution:
 (14)
(14)
where 


 and cα is the standard normal variable with a confidence level of (1-α).
4 Fault detection approach
The procedure of the fault detection based on dynamic PCA is given as follows.
1) Use sample datasets at a certain sample frequency under normal condition as training data.
2) Properly choose the lagged time l for dynamic PCA model in order to extract the exact relationships among dynamic variables.
3) Construct the dynamic data matrix as Eqn.(10).
4) Apply PCA to calculating the eigenvalues and eigenvectors of the covariance matrix of the matrix in Step 3.
5) Select the optimal number of principal components(PCs) using the variance explained criterion.
6) Develop the dynamic PCA model by decomposing measure space into two subspaces: PCS and RS.
7) Use sample datasets at a certain sample frequency under fault condition as test data and construct a dynamic data matrix as Eqn.(10).
8) Project the dynamic data matrix constructed in Step 7 on PCS and RS of the dynamic PCA model, respectively.
9) Calculate T2 statistic and Q statistic in PCS and RS, respectively.
10) Compare T2 statistic and Q statistic with thresholds at a certain confidence level to detect the presence of fault.
5 Simulation analysis
In this section, a simulation model of the excavator’s hydraulic system was developed to test the fault detection approach presented in the previous section.
5.1 Simulation model
The simulation model was based on the hydraulic system of SWE85 intelligent excavator produced by Hunan Sunward Intelligent Machinery Co. Ltd. AMESim[13-15], and an advanced hydraulic simulation environment, was used for modeling. The simulation model mainly contains twin-spool electric-hydraulic proportion valves, a hydraulic cylinder, a fixed displacement pump and a crank with a rotary load. The schematic diagram of the model is shown in Fig.1.
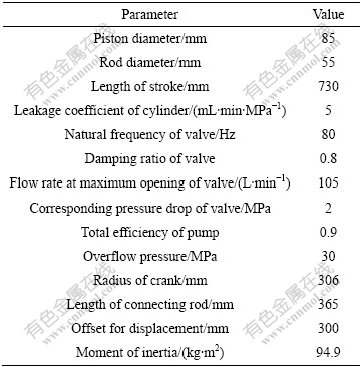
Before running a simulation, the parameters of each component should be carefully adjusted in terms of the prototype system. AMESim offers a parameter mode for model customization, by which one can readily set parameter values. In this work, numeric values of parameters that should be modified are listed in Table 1.
5.2 Fault detection
The observation vector at time t, which is composed of the variables from the simulation model, may be written as
x(t)=[ne, qs, ps, q1, p1, x1, q2, p2, x2]T (15)
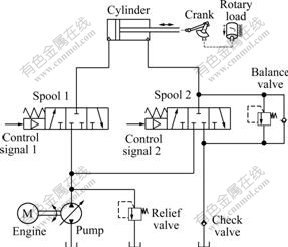
Fig.1 Schematic diagram of simulation model
Table 1 Parameters modified for simulation model
where ne is the engine speed; qs and ps are the flow rate and the pressure at pump outlet, respectively; q1 and p1 are the flow rate and the pressure at port A of spool 1 respectively; x1 is the signal input of spool 1; q2 and p2 are the flow rate and the pressure at port A of spool 2, respectively; x2 is the signal input of spool 1. Set the lag time l=2, the observation vector at time t for dynamic PCA can be rewritten as
xd(t)=[xT(t), xT(t-1), xT(t-2)]T (16)
and the dynamic data matrix can be constructed as Eqn.(10).
Assuming that the occurrence of faults is associated with the change of parameters, the following three faults were considered as representative.
Fault 0: No fault.
Fault 1: Decrease the total efficiency of pump by 20%.
Fault 2: Increase the leakage coefficient of cylinder of 0.05.
Fault 3: Decrease the proportion gain of spool 1 of 0.4.
The cases that more than one fault occur at the same time were not under consideration in this work. To obtain adequate resolution of the hydraulic system, the sample frequency can be taken as 100 Hz. Firstly the simulation model generated one sample set under fault 0, which was taken as training sample. Secondly, the simulation model randomly generated 20 sample sets from fault 0 to fault 3.
The computation and analysis of sample data to verify the fault detection approach were implemented in Matlab environment[16-17]. In order to avoid particular variables inappropriately dominating the procedure, the training data should be normalized before developing a dynamic PCA model. The normalization consisted of two steps: the first step was to subtract the mean from each variable in the data; the second step was to divide each mean-centered variable by its standard deviation. This scaled each variable in the training data to zero mean and unit variance. Since the training data represented the normal condition, test data should be scaled with mean and variance vector of training data.
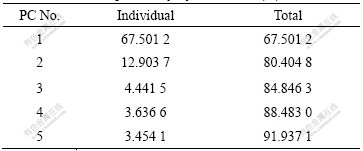
It is commonly known that the loading vectors associated with the larger eigenvalues describe most of the state variations in the process, and the loading vectors associated with the smaller eigenvalues describe the residual variation. Hence, determining the optimal number of PCs can effectively separate the state variation from residual variation. In this study, total variance explained was employed to choose optimal number of PCs according to Eqn.(5). With respect to the training data, the first four and five PCs respectively captured 88.483 0% and 91.937 1% of the total variance explained of the training data, which could sufficiently represent the entire system variance, as shown in Table 2. Therefore,the optimal number of PCs retained is 4.
Table 2 Variance explained by dynamic PCA (%)
By applying the dynamic PCA model, the test samples were decomposed into projections on PCS and RS, respectively. 99% was chosen as the confidence level in determining the threshold, while the thresholds for T2 statistic and Q statistic were 13.954 and 11.090, respectively. In calculating T2 statistic of projection on PCS and Q statistic of projection on PCS and RS respectively, a fault is indicated when one of the statistic values exceeds the threshold. Fig.2 shows the detection results of fault 0 using T2 statistic and Q statistic, where both plots are below the thresholds. Regarding to fault 1, the Q statistic clearly detects the fault while T2 statistic fails, as shown in Fig.3. And in Fig.4, Q statistic detects fault 2 while the T2 statistic just slightly exceeds the threshold. However, in Fig.5, both T2 statistic and Q statistic can successfully detect fault 3. Since fault 3 is the fault associated with the variation of control input, T2 statistic can show out of control in PCS as Q statistic can do in RS. Comparatively, fault 1 and fault 2 are caused by the shift of physical parameters, accordingly, Q statistic in RS is usually more sensitive than T2 statistic in PCS.
As illustrated above, for the four test sample sets, the dynamic PCA model is able to properly detect the faults in all cases using T2 statistic and Q statistic. The other test sample sets were analyzed by the proposed fault detection approach. Only one sample’s detection result is wrong after 20 test sample sets are analyzed,reaching an accuracy of 95%. The results show that the approach based on dynamic PCA effectively performs fault detection on the excavator’s hydraulic system.
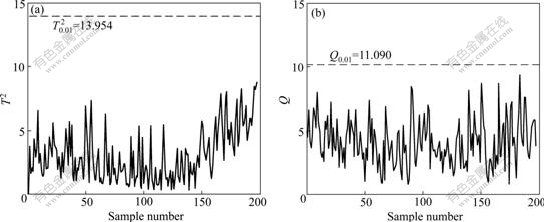
Fig.2 T2 (a) and Q (b) statistics for fault detection for fault 0
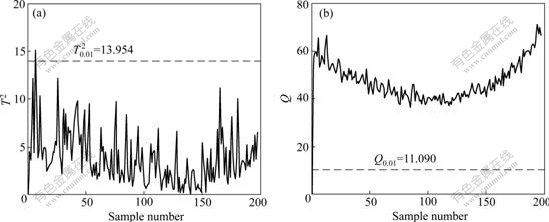
Fig.3 T2 (a) and Q (b) statistics of fault detection for fault 1
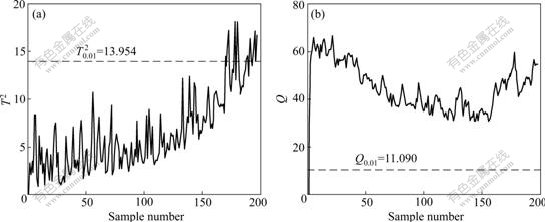
Fig.4 T2 (a) and Q (b) statistics of fault detection for fault 2

Fig.5 T2 (a) and Q (b) statistics of fault detection for fault 3
6 Conclusions
1) Aiming at the hydraulic system of excavator, a fault detection approach based on dynamic PCA is put forward. As an extension of static PCA method, dynamic PCA reveals dynamic relationships among process variables. With this method, a dynamic PCA model is developed using training data; test data are decomposed into projections to PCS and RS using this dynamic PCA model; and T2 statistic and Q statistic are used as indexes of fault detection in subspaces, respectively.
2) A simulation model based on the hydraulic system of SWE85 excavator is developed to verify the fault detection approach. Several simulated faults are introduced as representative during the simulation. For most of the faults, Q statistic is more sensitive to detect faults in RS than T2 statistic in PCS. The fault detection approach can achieve an accuracy of 95% after analyzing 20 test sample sets. The simulation results show that the proposed approach based on dynamic PCA can be effectively applied to the fault detection of the excavator’s hydraulic system.
References
[1] HE Qing-hua, ZHANG Da-qing, HAO Peng, ZHU Jian-xin. Model and experimental research on control of hydraulic excavator’s manipulator [J]. Journal of Central South University: Science and Technology, 2006, 37(3): 542-546. (in Chinese)
[2] LATTIN J M, CARROLL J D, GREEEN P E. Analyzing multivariate data [M]. Beijing: China Machine Press, 2003.
[3] WANG Hui-wen. Partial least squares regression approach and application [M]. Beijing: National Defense Industry Press, 1999. (in Chinese)
[4] CHIANG L H, RUSSELL E L, BRAATZ R D. Fault detection and diagnosis in industrial systems [M]. London: Springer-Verlag London Limited, 2001.
[5] CHEN J H, LIU K C. On-line batch process monitoring using dynamic PCA and dynamic PLS models [J]. Chemical Engineering Science, 2002, 57(1): 63-75.
[6] FALLAHATI D M, BACKONJA M, EGHBALNIA H, ASSADI A H. Dynamic PCA for network feature extraction in multi-electrode recording of neurophysiological data in cortical substrate of pain [J]. Neurocomputingm, 2002, 44/46: 401-405.
[7] P?LL?NEN K, H?KKINEN A, REINIKAINEN S P, RANTANEN J, MINKKINEN P. Dynamic PCA-based MSPC charts for nucleation prediction in batch cooling crystallization processes [J]. Chemometrics and Intelligent Laboratory Systems, 2006, 84(1/2): 126-133.
[8] LIN Wei-lu, QIAN Yu, LI Xiu-xi. Nonlinear dynamic principal component analysis for on-line process monitoring and diagnosis [J]. Computers and Chemical Engineering, 2000, 24(2/7): 423-429.
[9] ISERMANN R. Fault-diagnosis systems: An introduction from fault detection to fault tolerance [M]. Berlin: Springer-Verlag, 2006.
[10] CHIANG L H, RUSSELL E L, BRAATZ R D. Fault detection in industrial processes using canonical variate analysis and dynamic principal component analysis [J]. Chemometrics and Intelligent Laboratory Systems, 2000, 51(1): 81-93.
[11] LEE C K, CHOI S W, LEE I B. Sensor fault identification based on time-lagged PCA in dynamic processes [J]. Chemometrics and Intelligent Laboratory Systems, 2004, 70(2): 165-178.
[12] ZHOU Ru-sheng, JIAO Zong-xia, WANG Shao-ping. Current research and developing trend on fault diagnosis of hydraulic systems [J]. Chinese Journal of Mechanical Engineering, 2006, 42(9): 6-14. (in Chinese)
[13] HE Qing-hua, ZHANG Da-qing, HAO Peng, ZHANG Xin-hai. Study on motion simulation of hydraulic excavator’s manipulator [J]. Acta Simulata Systematica Sinica, 2006, 18(3): 735-738. (in Chinese)
[14] MARQUIS-FAVRE W, BIDEAUX E, SCAVARDA S. A planar mechanical library in the AMESim simulation software (Part I): Formulation of dynamics equations [J]. Simulation Modeling Practice and Theory, 2006, 14(1): 25-46.
[15] MARQUIS-FAVRE W, BIDEAUX E, SCAVARDA S. A planar mechanical library in the AMESim simulation software (Part II): Library composition and illustrative example [J]. Simulation Modelling Practice and Theory, 2006, 14(2): 95-111.
[16] PRATAP R. Getting started with MATLAB 7: A quick introduction for scientists and engineers [M]. New York: Oxford University Press USA, 2005.
[17] KAY S. Intuitive probability and random processes using Matlab [M]. New York: Springer, 2006.
(Edited by CHEN Wei-ping)
Foundation item: Project(2003AA430200) supported by the National High-Tech Research and Development Program of China
Received date: 2008-02-26; Accepted date: 2008-04-03
Corresponding author: HE Xiang-yu, PhD; Tel: +86-731-8879055; E-mail: iamhexiangyu@yahoo.com.cn

