
Si3N4/Ni nanocomposite formed by electroplating: Effect of average size of nanoparticulates
M. A. KHAZRAYIE, A. R. S. AGHDAM
Department of Materials Engineering, Faculty of Engineering, Tarbiat Modares University,
P.O. Box: 14115-143, Tehran, Iran
Received 10 August 2009; accepted 11 January 2010
Abstract: Properties of Si3N4/Ni electroplated nanocomposite such as corrosion current density after long time immersion, roughness of obtained layer and distribution of nanometric particulates were studied. Other effective factors for fabrication of nanocomposite coatings were fixed for better studying the effect of the average size of nanoparticulates. The effects of the different average size of nanometric particulates (ASNP) from submicron scale (less than 1 ?m) to nanometric scale (less than 10 nm) were studied. The nanostructures of surfaces were examined by scanning electron microscopy (SEM), transmission electron microscopy (TEM) and atomic force microscopy (AFM). Corrosion rates of the coatings were determined using the Tafel polarization test. It is seen that decreasing the ASNP will lead to lower corrosion current densities; however, in some cases, pitting phenomena are observed. The roughness illustrates a minimum level while the distribution of nanometric particulates is more uniform by decreasing the ASNP. The effects of pulsed current on electrodeposition (frequency, duty cycle) and concentration of nanoparticulates in electrodeposition bath on trend of obtained curves have been discussed. Response surface methodology was applied for optimizing the effective operating conditions of coatings. The levels studied were frequency range between 1 000 and 9 000 Hz, duty cycle between 10% and 90% and concentration of nanoparticulates of 10-90 g/L.
Key words: corrosion; electrodeposition; nanocomposite; nanostructure; nano diamond
1 Introduction
Nanoscaled and nanocomposite materials are of great interest for their usual better properties than microscaled materials[1-3]. The rapid development of nanostructured materials in recent years have resulted in increased interest in the research about their different properties[4-5]. One of the globally accepted and very easy methods of formation of nanocomposite layers is electrodeposition. Various kinds of nanocomposites by different nanopowders and metal matrixes can be produce by electrodeposition[6-10].
The various effects of nanometric particulates in electrodeposited layers with different kinds of particulates and matrixes were also studied in recent years. However, some properties were not studied in details. Also, the effect of the average size of nanometric particulates (ASNP) seems not to be focused by researchers as well as other effective parameters. Some reports have been published about common properties of electrodeposited nanocomposite layers with respect to the average size of particulates. These reports mainly discuss about the changing of average size of particulates from several microns to several nanometers which is not expected to be affected among the specific properties of nanometric particulates. Usually, as it is well accepted by nanotechnologists, particulates with sizes less than 100 nm will show their specific properties which can be discussed with respect to quantum physics. It is also well believed that by decreasing the size of nanometric particulates from 100 to 1 nm these effects will show themselves more and more.
So, in this investigation, the effect of ASNP in the range of submicron scale (less than 1 ?m) to nanometric scale (less than 10 nm) has been studied on the properties of nanocomposite electrodeposited layers which have not been studied well or rarely studied in open literature. These properties include corrosion current density after long time immersion, roughness of obtained layer and distribution of nanometric particulates. Other effective factors for fabrication of nanocomposite coatings have been fixed for better studying the effect of the ASNP.
2 Experimental
2.1 Materials and methods
Nickel sulphate bath for electrodeposition is composed of 150 g/L NiSO4?7H2O, 15 g/L NH4Cl, 15 g/L H3BO3, 0.1 g/L C12H25NaSO4, with 0.01 g/L saccharin (C7H5NO3S), 0.01 g/L SDS (C12H25NaO4S) and 10-90 g/L Si3N4 nanometric particulates (relative to its studied level). Si3N4 nanometric particulates with different ASNPs were used through this investigation. ASNPs were calculated with high precision figure analysis and those nanometric particulates were used which had a narrow distribution around the magnitude of ASNP. Fig.1 shows an example of used nanometric particulates with ASNP equal to 72 nm (SEM and TEM nanostructures). Pure copper 50 mm��50 mm��1 mm sheets were used as cathodic electrodes. The preparing process for all specimens was as follows. First they were mechanically polished with different grades of emery papers up to 3000 grit and then degreased in sodium hydroxide solution; after that they were inserted in 10% HCl solution to be activated and finally rinsed with acetone. The operating conditions for electrodeposition were average current density of 10 A/dm2, stirring rate of 200 r/min and bath temperature of 60 �� while the frequency and duty cycle of monopolar pulsed current were adjusted at 1 000 Hz and 50%, respectively.
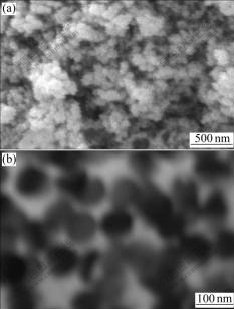
Fig.1 SEM (a) and TEM (b) images of used nanometric particulates with ASNP equal to 72 nm
After coating process, samples were rinsed thoroughly with distilled water and then dried in flowing air. The nanostructures of surfaces were examined by a Philips XL-30 scanning electron microscopy (SEM). The corrosion rate of the coatings was determined using the Tafel polarization test in 3.5% (mass fraction) NaCl solution after 1, 6, 12, 24, 48, 96, 192, 384 and 768 h of immersion at room temperature. The polarization corrosion potential was swept from -200 mV below to 200 mV above the open circuit potential at a scanning rate of 0.1 mV/s. Tafel polarization was performed using an EG&G A273 potentiostat and analyzed by SoftcorrIII Software. Surface roughness of treated samples was measured via a Taylor-Hobson Surtronic 25 roughness checker. The obtained data were analyzed by Talyprofile (Gold) software. For better study of nanostructures, some measurements have been done by atomic force microscope (AFM). The AFM part was a NanoScope II from Digital Instruments, USA. Non-scraping Si3N4-tips were used throughout. Nanostructures of nanopowder layers have been also analyzed by transmission electron microscopy (TEM) (CM200-FEG, Phillips). To measure average size of nanometric particulates (ASNP), 5 SEM nanostructures with same magnification were analyzed through commercial software for figure analysis called a4iDocu for each treated sample. Different measurements were interpolated to obtain average results. At least 40 measurements were done in each nanostructure for minimizing systematical errors.
2.2 Experimental design and optimization
One set of independent variables[11-13] are frequency, duty cycle and concentration of nanoparticulates in electrodeposition bath. For a statistical investigation concerned with coating process, Y, which depends on the factors X1, X2, X3, ��, Xk, the relationship among response and effective variables can be expressed by
Y=f(X1, X2, ��, Xk)+�� (1)
where �� is an error term which represents sources of variability not captured by f. It is assumed that �� is independent by different runs and has mean value of zero.
The test variables were coded according to the following equation:
 (2)
(2)
where xi is independent variable coded value; Xi is independent variable real value; Xcp is independent variable real value at the centre point; and ��Xi is the step change of the real value of the variable i corresponding to a variation of a unit for the dimensionless value of the variable i.
The response variable (average size of nanoparticles in coating) was fitted by a second order model in order to correlate the response variables to the independent variables. The general equation of the second degree polynomial equation is
 (3)
(3)
where Yi is the predicted response; Xi and Xj are input variables which influence the response variable Y; ��0 is the ith linear coefficient; bii is the quadratic coefficient and bij is the linear-by-linear interaction between Xi and Xj, where i changes from 1 to 3.
A 23 full factorial central composite design (CCD) for three independent variables at five levels with six star points and six replicates at the centre points was employed to fit a second-order polynomial model which indicated 20 experiments to be required for this procedure. The ��Minitab 15�� software was used for regression and graphical analysis of the data obtained. The statistical analysis of the model was performed in the form of analysis of variance (ANOVA). This analysis includes the Fisher��s F-test (overall model significance), its associated probability P(F), correlation coefficient R, determination coefficient R2 which measures the goodness of fit of regression model. It also includes the t-value for the estimated coefficients and associated probabilities, P(t). For each variable, the quadratic models are represented as response surface plots.
3 Results and discussion
3.1 Corrosion current density
Fig.2 illustrates the changing trend of corrosion current densities (CCD) after immersion in 3.5% NaCl solution at room temperature. As it can be seen from this figure, CCD will increase a little after long time immersion in corrosive solution but lowering the ASNP will lead to lower CCDs, which at first indicates that decreasing ASNP is useful for decreasing CCD. However, observations with naked eye did not indicate the presence of pitting phenomena but AFM studies show that nanocomposites with very low ASNP will show some nanometric pits. Fig.3 shows the observed pits for the nanocomposite layer with ASNP equal to 9 nm.
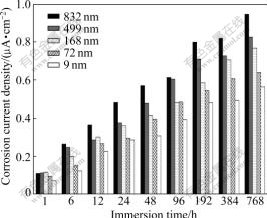
Fig.2 Changing trend of corrosion current densities for different ASNPs after immersion in 3.5% NaCl solution at room temperature

Fig.3 AFM nanostructure of nanometric pits of layer with ASNP equal to 9 nm
3.2 Roughness
Fig.4 illustrates the effect of different ASNPs on the Ra of coatings. Interpolated equation shows that there is a quadratic relation between the roughness of obtained layer and ASNP. It can be concluded that the interaction among nanoparticulates with low ASNP (approximately less than 90 nm) will increase the roughness of obtained layer. The minimum roughness has been obtained for the nanocomposite layer with ASNP equal to 93 nm.
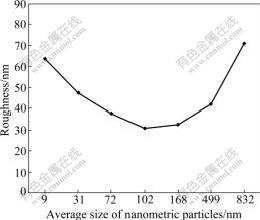
Fig.4 Effect of different ASNPs on Ra of coatings
3.3 Distribution of nanometric particulates
The effect of ASNP on the distribution of nanometric particulates is illustrated in Fig.5. It can be easily concluded that the gaussian shape of distribution curves are narrower for lower amounts of ASNP. Also, it can be seen that the distribution curves of obtained layer for higher amount of ASNP are wider, which means that although the nanometric powders with narrow distribution of particulates around the specific ASNP have been used, the distribution of nanometric particulates in obtained nanocomposite layer is not as same as the distribution of used nanometric particulates for large amounts of ASNP. So, in this point of view, it is better to use the nanometric particulates for fabrication of nanocomposite layer with lower amounts of ASNP.
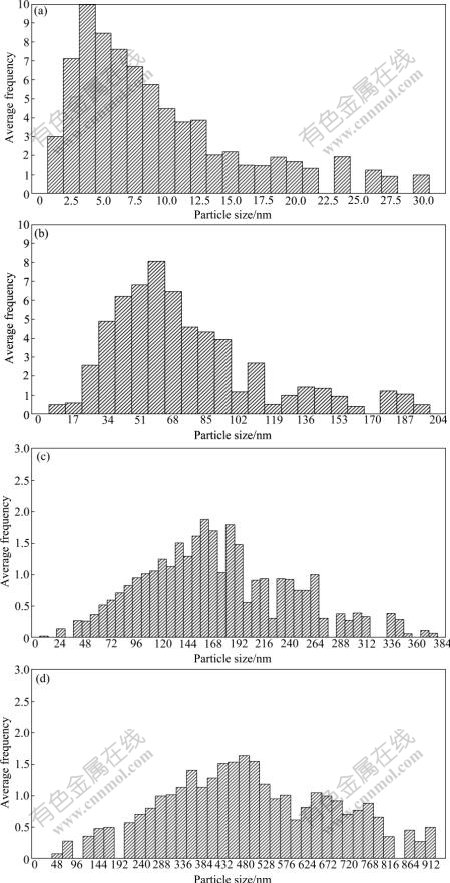
Fig.5 Distribution of nanocomposite layer with different ASNPs: (a) 9 nm; (b) 72 nm; (c) 168 nm; (d) 499 nm
3.4 Optimization
The levels of the variables for the minimum average sizes of nanoparticles (ASN) were selected as the central points in the more elaborate second-order experiment. In the response surface methodology (RSM) study, the three variables studied were frequency (X1), duty cycle (X2) and concentration of nanoparticulates in electrodeposition bath (X3). The main goal of the second phase of the response surface was to obtain an accurate approximation to the response surface in a small region around the optimum and to identify the optimum process conditions. The range and the levels of the variables investigated in this study are listed in Table 1. The central values (zero level) chosen for experimental design were 5 000 Hz for frequency, 50% for duty cycle and 50 g/L for concentration of nanoparticulates in electrodeposition bath. In the quest for the optimum combination of the variables, experiments were performed according to the CCD experimental plan (Table 2). The experiment used a CCD which consists of three parts. The eight runs involving the ��1�� and ��-1�� coded values (Table 2) form a 23 design. Because they are on the corners of the 23 cube, they are called cube points or corner points. The six runs involving the ����1�� and ��0�� coded values from three pairs of points along the three coordinate axes are therefore called the axial points or star points. The two runs involving the ��0�� coded values are at the centre of the design region and are called the centre points. This design is a second-order design, and it allows all the linear and quadratic components of the main effects and the linear-by-linear interactions to be estimated.
Table 1 Experimental range and levels of independent variables

The results of the response surface model fitting in the form of analysis of variance (ANOVA) are shown in Table 3. The ANOVA of the quadratic regression model demonstrated the model to be significant with a low probability value (Pmodel��F=0). The goodness of the fit of the model was checked by determination coefficient (R2). In this case, the value of the determination coefficient, R2, is 0.999 9. The value of the adjusted determination coefficient is 0.999 7. Table 4 compares the RSM predicted and experimental average sizes of nanoparticles.
Table 2 CCD plan in coded values and observed response (average size of nanoparticles)

Table 3 ANOVA for quadratic model
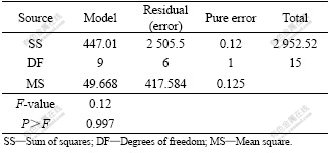
Table 4 Measured and predicted response values together with values for residuals and standard errors

The application of RSM yields the following regression equation which is the empirical relationship between average sizes of nanocrystallites (Yi) and the test variables in coded units:
Yi=61.69+2.01X1-0.95X2-4.83X3-1.27(X1��X1)+
1.13(X2��X2)-4.47(X3��X3)-1.4(X1��X2)+
1.8(X1��X3)+2.22(X2��X3) (4)
where Yi is the predicted response and X1, X2 and X3 are the coded values of the test variables.
The significance of each coefficient determined by t-test and P-values are listed in Table 5. Larger magnitudes of the t-value and smaller amounts of the P-value will lead to the more significant of the corresponding coefficient. Values of P��0.050 0 indicate model terms to be significant. The response surface plots are generally the graphical representations of the regression equation and are presented in Figs.6-8, from which the values of average sizes of nanoparticles for different levels of the variables can be predicted. Each response plot represents an infinite number of combinations of two test variables with the other maintained at its respective zero level.
Table 5 Least-squares fit and coefficient estimates (significance of regression coefficients)
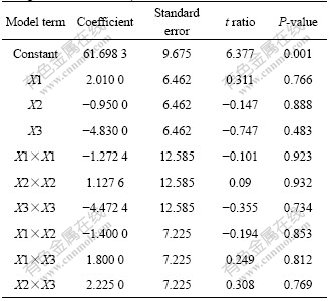

Fig.6 Contour plot between X1 and X2 with X3 kept at zero level
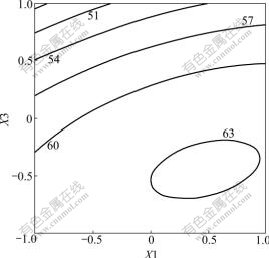
Fig.7 Contour plot between X1 and X3 with X2 kept at zero level

Fig.8 Contour plot between X2 and X3 with X1 kept at zero level
4 Conclusions
Electrodeposited Ni/Si3N4 nanocomposite layers have been synthesized successfully through electrolytic deposition from a sulphate bath and the effect of average size of used nanometric particulates (ASNP) in the range of submicron scale (less than 1 ?m) to nanometric scale (less than 10 nm) have been studied. The investigated properties were corrosion current density, roughness and distribution of nanometric particulates in obtained layer. It is seen that decreasing the ASNP will lead to lower corrosion current densities; however, in some cases pitting phenomena are observed. The roughness illustrates a minimum level while the distribution of nanometric particulates in obtained nanocomposite layer is more uniform by decreasing the ASNP. Response surface methodology is proved to be accurate in prediction and optimization of the average sizes of nanoparticles. The effects of frequency, duty cycle and concentration of nanoparticulates in electrodeposition bath have been discussed and the proposed equation has been obtained by relative software.
Acknowledgement
The authors would like to express their thanks to Iranian Nanotechnology Initiative for financial support of this research.
References
[1] SARWAR M I, ZULFIQAR S, AHMAD Z. Investigating the property profile of polyamide�Calumina nanocomposite materials [J]. Scripta Mater, 2009, 60(11): 988-991.
[2] YOON S, LEE J, KIM H, IM D, DOO S, SOHN H. An Sn-Fe/carbon nanocomposite as an alternative anode material for rechargeable lithium batteries [J]. Electrochim Acta, 2009, 54(10): 2699-2705.
[3] JIN H X, LI L, CHU N J, LIU Y P, WANG L Y, LU Q, QIAN J, SUN L N, TANG Q, GE H L, WANG X Q. Magnetic properties of nanocomposite Fe-doped SBA-15 magnetic materials [J]. Mater Chem Phys, 2008, 112 (1): 112-114.
[4] LANGDON T G. Research on bulk nanostructured materials in Ufa: Twenty years of scientific achievements [J]. Mater Sci Eng A, 2009, 503(1): 6-9.
[5] RATH M C, SUNITHA Y, GHOSH H N, SARKAR S K, MUKHERJEE T. Investigation of the dynamics of radiolytic formation of ZnO nanostructured materials by pulse radiolysis [J]. Rad Phy Chem, 2009, 78(2): 77-80.
[6] XIA F, WU M, WANG F, JIA Z, WANG A. Nanocomposite Ni-TiN coatings prepared by ultrasonic electrodeposition [J]. Current App Phys, 2009, 9(1): 44-47.
[7] ZHENG H, AN M. Electrodeposition of Zn-Ni-Al2O3 nanocomposite coatings under ultrasound conditions [J]. J Alloy Compound, 2008, 459(1): 548-552.
[8] JEON Y S, BYUN J Y, OH T S. Electrodeposition and mechanical properties of Ni-carbon nanotube nanocomposite coatings [J]. J Phys Chem Solid, 2008, 69(5): 1391-1394.
[9] YAO Y, YAO S, ZHANG L, WANG H. Electrodeposition and mechanical and corrosion resistance properties of Ni-W/SiC nanocomposite coatings [J]. Mater Lett, 2007, 61(1): 67-70.
[10] ZIMMERMAN A F, CLARK D G, AUST K T, ERB U. Pulse electrodeposition of Ni-SiC nanocomposite [J]. Mater Lett, 2002, 52(1): 85-90.
[11] ALIOFKHAZRAEI M, HASSANZADEH-TABRIZI S A, SABOUR ROUHAGHDAM A, HEYDARZADEH A. Nanocrystalline ceramic coating on ��-TiAl by bipolar plasma electrolysis (effect of frequency, time and cathodic/anodic duty cycle) [J]. Ceramic Int, 2009, 35(3): 2053-2059.
[12] ALIOFKHAZRAEI M, SABOUR ROUHAGHDAM A, HEYDARZADEH A, ELMKHAH H. Nanostructured layer formed on CP-Ti by plasma electrolysis (effect of voltage and duty cycle of cathodic/anodic direction) [J]. Mat Chem Phys, 2009, 113(2/3): 607-612.
[13] ALIOFKHAZRAEI M, SABOUR ROUHAGHDAM A, HEYDARZADEH A. Strong relation between corrosion resistance and nanostructure of compound layer of treated 316 austenitic stainless steel [J]. Mater Character, 2009, 60(2): 83-89.
Corresponding author: M. A. KHAZRAYIE; Tel: +98-912-6905626; Fax: +98-21-66960664; E-mail: khazrayie@modares.ac.ir
DOI: 10.1016/S1003-6326(09)60251-X
(Edited by YANG Bing)

