Field analysis of metallogenic information and its application
来源期刊:中南大学学报(英文版)2011年第1期
论文作者:毛先成 胡超 周尚国 张宝一 汪凡云 曾文波
文章页码:196 - 207
Key words:metallogenic information; field model; metallogenic prognosis; manganese ore
Abstract: Focusing on the issue to deal with inadequate extraction of metallogenic information especially geological information, a new method of extracting metallogenic information based on field model, i.e. the field analysis method of metallogenic information, was proposed. In addition, a case study by using the method of the extraction of metallogenic information from the west Guangxi and southeast Yunnan district as an example was performed. The representation method for the field models of metallogenic information, including the metallogenic influence field model and the metallogenic distance field model, was discussed by introducing the concept of the field theory, based on the characteristic analysis of the distance gradualness and the influence superposition of metallogenic information. According to the field theory superposition principle and the spatial distance analysis method, the mathematical models for the metallogenic influence field and the metallogenic distance field of point, line and area geological bodies were derived out by using parameter equation and calculus. Based on the metallogenic background analysis, the metallogenic information field models of synsedimentary faults and manganese sedimentary basins were built. The relationship between the metallogenic information fields and the manganese mineralization distribution was also investigated by using the method of metallogenic information field analysis. The instance study indicates that the proposed method of metallogenic information field analysis is valid and useful for extracting the ore-controlling information of synsedimentary faults and manganese sedimentary basins in the study area, with which the extraction results are significant both statistically and geologically.
J. Cent. South Univ. Technol. (2011) 18: 196-207
DOI: 10.1007/s11771-011-0680-z
![]()
MAO Xian-cheng(毛先成)1, 2, HU Chao(胡超)1, ZHOU Shang-guo(周尚国)3,
ZHANG Bao-yi(张宝一)1, 2, WANG Fan-yun(汪凡云)1, ZENG Wen-bo(曾文波)1
1. School of Geosciences and Info-physics, Central South University, Changsha 410083, China;
2. Key Laboratory of Metallogenic Prediction of Non-ferrous Metals,
Ministry of Education, Changsha 410083, China;
3. China Metallurgical Geology Bureau, Beijing 100025, China
? Central South University Press and Springer-Verlag Berlin Heidelberg 2011
Abstract: Focusing on the issue to deal with inadequate extraction of metallogenic information especially geological information, a new method of extracting metallogenic information based on field model, i.e. the field analysis method of metallogenic information, was proposed. In addition, a case study by using the method of the extraction of metallogenic information from the west Guangxi and southeast Yunnan district as an example was performed. The representation method for the field models of metallogenic information, including the metallogenic influence field model and the metallogenic distance field model, was discussed by introducing the concept of the field theory, based on the characteristic analysis of the distance gradualness and the influence superposition of metallogenic information. According to the field theory superposition principle and the spatial distance analysis method, the mathematical models for the metallogenic influence field and the metallogenic distance field of point, line and area geological bodies were derived out by using parameter equation and calculus. Based on the metallogenic background analysis, the metallogenic information field models of synsedimentary faults and manganese sedimentary basins were built. The relationship between the metallogenic information fields and the manganese mineralization distribution was also investigated by using the method of metallogenic information field analysis. The instance study indicates that the proposed method of metallogenic information field analysis is valid and useful for extracting the ore-controlling information of synsedimentary faults and manganese sedimentary basins in the study area, with which the extraction results are significant both statistically and geologically.
Key words: metallogenic information; field model; metallogenic prognosis; manganese ore
1 Introduction
With the growing demand for mineral resources by human society and the rapid development of information technologies such as GIS, the prediction and assessment of mineral resources entered a scientific, quantitative and digital stage. The so-called “three-part” resource evaluation method [1], advocated by the US Geological Survey, was promoted in the United States and Global Mineral Resource Assessment Program (GMRAP). The “weights of evidence”, a method for mineral resources assessment based on grid GIS, buffer analysis and overlay analysis, was proposed for the mineral resources potential mapping based on GIS by the Geological Survey of Canada [2]. Based on the concept of ore-formation system, the GIS methodology for mineral resources assessment was developed in Australia [3]. Besides these nationwide works of mineral resources potential assessments, many geologists had carried out a lot of researches on quantitative assessment of mineral resources based on GIS [4-7]. Since 1990s, geologists from China have used GIS widely in mineral resources prediction and assessment [8-10], and have developed mineral resources prediction and assessment system based on MapGIS, such as “Mineral Resource Assessment System (MRAS)” [11] and “Mineral Ore Resources Perspective and Assessment System (MORPAS)” [12]. Since 2006, the national project for potential assessment of mineral resources had been carried out, and subsequently the methodology of deposit modeling and mineral resources potential assessment using integrated geological information had been put forward [13].
Because of the above research and practice development, the quantitative assessment of mineral resources based on GIS is getting to be maturity, with the core works composing of three parts: 1) integration of multivariate geo-spatial data, 2) extraction and integration of multivariate metallogenic information and 3) mineral potential mapping. The metallogenic information includes geological, geophysical, geochemical and remote sensing information, etc, in which, the geological information is the basis for explaining, extracting and integrating the other metallogenic information. In the “three-part” resource evaluation carried out by US, the geological information is the prerequisite for delineating prospective areas of ore-formation [14]. The application of GIS spatial analysis technology has promoted the development of the methods of extracting geological information, whereas the buffer and overlay analysis can be used to extract stratum, magmatic, structure and other metallogenic information [14], such as the buffer area of the lineament, the entropy of the strata combination, the influence domain of the magmatic rock, the geological anomaly [15], and the anomaly parameter of the lineament [16]. However, faced with the issues of inadequately revealing or containing wrong metallogenic information, the application of metallogenic information extraction is yet not so satisfactory, which seriously damages the quantitative assessment of mineral resources [17-18].
The present study is a part of the “Research on Large Manganese Ore Prospecting and Assessment in the West Guangxi and Southeast Yunnan District”―Project (2006BAB01A12) supported by the National Science and Technology Pillar Program during the 11th Five-Year Plan Period of China. In the course of extracting metallogenic information based on GIS, it was found that the manganese ore deposits in the west Guangxi and southeast Yunnan district mainly formed in the deep sink basins and their margins were controlled by the extensional activities of large deep-seated faults, and that the influence of the synsedimentary faults on the manganese mineralization distribution was superposable. The carried-out extraction works indicated that there existed some limitations when using the traditional spatial analysis (such as buffer analysis) to reveal such spatial correlations. Therefore, a new method of extracting metallogenic information oriented from geological information, namely the field analysis method of metallogenic information, was proposed in this work. With this method, the control laws of the manganese sedimentary basins, the synsedimentary faults and the other geological factors over the manganese mineralization distribution could be revealed more precisely, the metallogenic information could be extracted more effectively and the problems of inadequately revealing the metallogenic information could be avoided at the greatest degree, forming a good foundation for building models to predict and delineating target locations. Introducing the concept of the field theory, the field analysis method of metallogenic information adopts field models to express the influence of the geological bodies (sedimentary basins, synsedimentary faults and so on) on the surrounding space, and then the correlations between the influence fields of the geological bodies and the manganese mineralization distribution are further analyzed.
2 Metallogenic information field models
2.1 Concept of metallogenic information field
There exist spatial correlations between the manganese mineral occurrences and the sedimentary basins, the synsedimentary faults and the other geological factors in the west Guangxi and southeast Yunnan district. Based on detailed analysis, the correlations can be divided into two kinds of forms:
1) The controls of the synsedimentary faults over the manganese mineral occurrences have characteristics of distance gradualness and influence superposition. In other words, the manganese mineral occurrences are not only related with their distances to the faults, but also influenced by the composite superpositions of multiple faults.
2) The controls of the sedimentary basins over the manganese mineral occurrences have characteristic of the distance gradualness, but not the influence superposition, i.e., the manganese ore deposits distribute in a certain distance between the inside and the edge of the sedimentary basins.
The traditional buffer analysis can only identify the neighborhood or influence area of the geological bodies in the surrounding space when revealing the spatial correlations, and the influence area is only a homogeneous region. The buffer area thus fails to reflect the distance gradualness and the influence superposition, namely the characteristics of the influence of the sedimentary basins and faults on the spatial distribution of deposits. Furthermore, only considering the area around the geological bodies, the buffer model may cause more difficulties to express the influence force of the sedimentary basins on the manganese mineral occurrences inside the basins. As shown in Fig.1, the influence area of the buffer generated by two cross faults is homogeneous because of not considering the distance gradualness and the influence superposition of the faults (Fig.1(a)), while the field model can reflect these two characteristics of the influence force of the faults with higher precise (Fig.1(b)).
According to the above analysis, the two forms of metallogenic information can be expressed or simulated better by field models. To solve the differences of influence between the two forms of metallogenic information, two kinds of field models of metallogenic
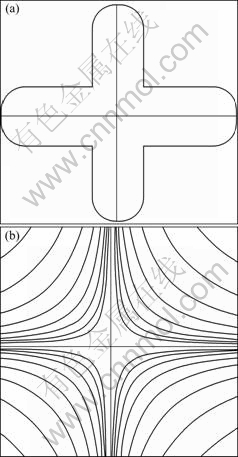
Fig.1 Models for influence force of two cross faults on surrounding space: (a) Influence force described by buffer model; (b) Influence force described by field model
information were proposed:
1) The metallogenic influence field: Based on field model in the field theory [19], the control information of the geological bodies (such as synsedimentary faults) relative to the spatial location and distribution of the deposits can be described, which is not only related with the shortest distance to the geological bodies, but also related with the influence superposition of a number of similar geological bodies. So, the metallogenic influence field describes the influence strength of single or multiple similar geological bodies in the surrounding space.
2) The metallogenic distance field: According to the distance model in spatial analysis [20], the key information of the geological bodies (such as synsedimentary faults) to the spatial location and distribution of the deposits can be described, in which only the shortest distance to the geological bodies is considered but not the influence superposition of the geological bodies in the surrounding space. So, the metallogenic distance field describes the correlations of distance or location between single geological body and the surrounding space.
2.2 Mathematical models of metallogenic influence fields
In physics, the field can be subdivided into scalar field and vector field according to the fact that the physical quantity is a scalar or a vector. For example, density field and temperature field of objects are scalar fields, whereas gravitation field of space and velocity field of liquid are vector fields. The physical quantity of the metallogenic information field, that is, the influence strength of geological bodies in the surrounding space, is a relative value, namely a scalar. Thus, metallogenic influence field is a scalar field. As a result, the metallogenic influence field can be described by the mathematical model of scalar field.
The field and its field source are inseparable and fields generated by different field sources have the characteristic of superposition in space. Geological bodies controlling the location and distribution of the deposits are field sources of the metallogenic influence field. In the two-dimensional space, the geological bodies can be divided into point, line and area according to their modes. For the punctual geological body, the field can be directly calculated by the basic formula of field. For the linear geological body, because of the field superposition, the field of the linear geological body can be regarded as the superposition of the fields in numerous punctual geological bodies distributed on the line, and it thus needs to be solved with the line integral. Similarly, the field of area geological bodies needs to be calculated by the surface integral.
In order to solve the field model, the field model of punctual field source must be defined first. According to physical theory, field strength is usually related with the distance to the field source, so that the field strength function is defined as the field that is inversely proportional to the square of the distance. Because the influence strength of the geological bodies in the surrounding space decreases with increasing the distance between them, the field strength of the metallogenic influence field is also related with the distance to the geological bodies of the field sources, which increases with the decrease of the distance. Considering that the field strength of the metallogenic influence field decreases with the distance, and that the metallogenic influence field is a field with geological significance which has no definition of physical dimension, the field strength of the metallogenic influence field can be described by choosing a certain attenuation model to describe. At present, the most common attenuation models include the linear attenuation model, the second attenuation model, the exponent attenuation model, the inverse attenuation model, the inverse square attenuation model and so on. Taking the geological significance and the convenience of calculation into account, the method of choosing the inverse square attenuation model to define the field strength function of the metallogenic influence field f is introduced:
![]() (1)
(1)
where f(xp, yp) denotes the field strength of a point geological body G at some point P(xp, yp) in the space, f0 is a constant, and r is the Euclidean distance between the spatial point P and the point geological body G .
For a single point geological body, the model of metallogenic influence field is the same as Eq.(1), while for multiple point geological bodies, the field model is
![]() (2)
(2)
where F(xp, yp) denotes the field strength of n point geological bodies at some point P(xp, yp) in the space, and fi(xp, yp) denotes the field strength of the i-th point geological body.
The linear geological body can be considered a complex composed of n line segments (Fig.2). Because of the field superposition, the field strength of the linear geological body is the sum of the field strength of n line segments, that is
![]() (3)
(3)
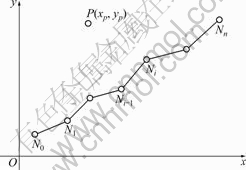
Fig.2 Sketch showing calculating metallogenic influence field of linear geological body
In Eq.(3), F(xp, yp) denotes the field strength of a linear geological body at some point P(xp, yp) in the space, and Fi(xp, yp) denotes the field strength of the i-th line segment. Fi(xp, yp) is the sum of field strength at some point P(xp, yp) when taking all these points on the Li line segment as field sources, which can be calculated by the line integral.
For the i-th line segment Li, let Ni-1(xi-1, yi-1), Ni(xi, yi) denote the coordinates of the endpoints, respectively, and then the parameter equation of this line segment can be reached:
![]() (4)
(4)
where t is the parameter of the parameter equation of the
line segment, t![]() [0, l], and l is the length of the line
[0, l], and l is the length of the line
segment with ![]() . The slope
. The slope
angle of the line segment, α, can be calculated by the slope k (k=tan α) and the slope formula (k=(yi-yi-1)/ (xi-xi-1)), that is
 (5)
(5)
The distance from any point N(x, y) on the line segment to the point P(xp, yp) can be expressed as
![]() (6)
(6)
Inserting Eq.(5) into Eq.(4), and Eq.(4) into Eq.(6), it can be reached that
![]()
![]() (7)
(7)
Let
![]()
![]()
Then, r can be denoted as
![]() (8)
(8)
Using Eq.(8), the field strength of the spatial point P(xp, yp) on the line segment Li can be deduced as
![]()
![]()
In other words, the field strength can be denoted as
![]()
![]() (9)
(9)
When the spatial point P(xp, yp) distributes right on the line segment Li, the integral result expressed by Eq.(9) is divergent and thus in the actual works of programming and computation, the integral result is assigned by the maximum.
2.3 Mathematical models of metallogenic distance fields
As distance is related to the metric space, let E denote the metric space, xi=(xi1, xi2, …, xim) and xj=(xj1, xj2, …, xjm) denote two points in E, the Minkowski distance (metric) between point xi and xj can be defined as
![]() (10)
(10)
In Eq.(10), when p=1, the metric L1 can be reached and the distance is called absolute distance. In the case of p=1, the metric L2 can be reached, and this distance is called Euclidean distance. When p=∞, the metric L∞ can be reached, and the distance is called Chebyshev distance. In addition, Eq.(10) can be used to define the distance on surface, the distance between network nodes and so on. For a certain geographical object, any point in the surrounding space has some distance to this object. These kinds of distances are presented as the distribution of distance in the space, which is called distance field. According to the different distance metric, the distance field is called absolute distance field, Euclidean distance field and so on.
The metallogenic distance field describes the shortest distance between the point in space and the geological body. So, in the present study, the intuitive Euclidean distance field was chosen as the mathematical model of the metallogenic distance field. In the following section, the discussion will mainly be focused on describing the models of metallogenic distance field of punctual geological body, linear geological body and area geological body, respectively.
1) Metallogenic distance field of punctual geological body
Using the Euclidean distance between point (spatial point) and point (punctual geological body), metallogenic distance can be directly expressed as
![]() (11)
(11)
where DPG denotes the metallogenic distance between a certain point P(xp, yp) in the space and the punctual geological body G(xg, yg).
2) Metallogenic distance field of linear geological body
A linear geological body can be viewed as a complex composed by n linear segments L1, L2, …, Ln (Fig.3). Then, the Euclidean distance from the spatial point P(xp, yp) to the linear geological body G(L1, L2, …,
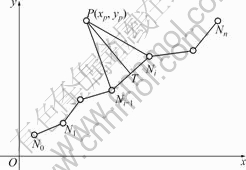
Fig.3 Sketch showing calculating metallogenic distance field of linear geological body
Ln) is the minimum Euclidean distance from the spatial point P(xp, yp) to all the line segments composing the linear geological body G(xg, yg), i.e.
![]() (12)
(12)
where DPG denotes the metallogenic distance between a certain point P(xp, yp) in the space and the punctual geological body G(xg, yg), and the parameter equation of the i-th line segment Li is presented in Eq.(4).
Through the spatial point P(xp, yp), a line that is vertical to the line through the line segment Li can be constructed, and let the foot drop be T(x, y). Then, ![]() can be reached. By the nature of inner product of vector, the formula listed as follows can be reached:
can be reached. By the nature of inner product of vector, the formula listed as follows can be reached:
![]() (13)
(13)
Using the coordinates of points and the nature of vector, we get
![]()
![]() (14)
(14)
Inserting Eq.(14) into Eq.(13), it can be reached that
![]() (15)
(15)
Now, inserting the parameter of Eq.(4) into Eq.(15), it can be reached that
![]()
When t<0, i.e., the foot drop T(x, y) is located on the extended line of the line segment Li from the point Ni(xi, yi) to Ni-1(xi-1, yi-1). Then, the shortest distance from the spatial point P(xp, yp) to the line segment Li is the distance between point P(xp, yp) and Ni-1(xi-1, yi-1), that is
![]()
When 0≤t≤l, i.e., the foot drop T(x, y) is located on the extended line of the line segment Li, the shortest distance is from point P(xp, yp) to the line segment Li, that is,

When t≥l, i.e., the foot drop T(x, y) is located on the extended line of the line segment Li from the point Ni-1(xi-1, yi-1) to Ni(xi, yi), the shortest distance from the spatial point P(xp, yp) to the line segment Li is the distance between point P(xp, yp) and Ni(xi, yi), that is
![]()
So, the shortest distance from the spatial point to the line segment Li is
 (16)
(16)
where l denotes the length of the line segment Li.
Using Eq.(16), the shortest distance form the spatial point to all line segments L1, L2, …, Ln can be obtained. Then, using Eq.(12), the shortest distance of the spatial point P(xp, yp) to the linear geological body G(L1, L2, …, Ln) can be obtained.
3) Metallogenic distance field of area geological body
In the case of two dimension, because the boundary of an area geological body is composed of a lot of lines, the distance from the spatial point to the area geological body can be converted to get the distance from the point to the boundary line, and then converted to get the shortest distance from the point to every line segment. In other words, the distance between point P(xp, yp) and the area geological body G is
![]() (17)
(17)
where L1, L2, …, Ln denote the line segments of the boundary lines of the geological body G.
3 Case study of field analysis of metallogenic information
The field analysis method of metallogenic information is a method of extracting metallogenic information based on field model, which is mainly used to extract various kinds of metallogenic information that can be suitably expressed by field model, especially the geological information. The basic procedure to extract the metallogenic information using this method consists of 1) building the multivariate geo-spatial database, 2) studying and summarizing the metallogenic regularity, and constructing the conceptual model of metallogenic information, 3) constructing the metallogenic information field model, and 4) quantitatively analyzing the correlations between the metallogenic information field and the manganese mineralization distribution.
The field analysis method of metallogenic information was used to extract the metallogenic information of the synsedimentary faults and the manganese sedimentary basins by taking the west Guangxi and southeast Yunnan district as an example in this work.
3.1 Metallogenic background analysis of study area
The study area covers the district of southwest Guangxi and southeast Yunnan, ranging from Xuanwu- Guangnan in Yunan and Bama in Guangxi in the north to the Sino-Vietnamese border in the south, and from Pingguo-Long’an in Guangxi in the east to Kaiyuan- Menzi in Yunnan in the west. The scope of the geographical coordinates is 103°30′-107°30′E, 22°40′- 26°30′N, with an area of about 40 000 km2.
The area covers the manganese ore concentration areas of the southwest Guangxi and the east Yunan, which is tectonically located in the southwest edge of Yangtze platform. The manganese ore concentration area of the southwest Guangxi is located in the southwest of the Youjiang regeneration geosynclines of the Nanhua paraplatform, including three third-order tectonic units: the western Guangxi depression, the Jingxi-Tiandong uplift, and the Xialei-Lingma depression. The strata can be divided into three sets: the pre-Devonian basement rock series, the cover rock series based on marine deposits from the Late Palaeozoic to Triassic, and the Cenozoic piedmont facies, fluvial facies and lacustrine facies. The manganese ore concentration area of the southeast Yunan is located in the fold belt of the southeast Yunnan, Huanan fold system, the north and west of which are respectively adjacent to the eastern Yunnan-Taiwan fold belt of the Yangtze paraplatform and the Ailaoshan fault block, taking the Mile-Shizong and Red River Fault as its boundary [21]. In this area, the main strata are Mesozoic in the north and Palaeozoic in the south, the distribution of which is bounded by the nearly EW-trending fault, and the Triassic is mainly distributed in the regional syncline axle and the area of Xichou-Malipo in the northeastern of the Wenshan- Malipo fault.
The study area is an important manganese ore concentration area in China [22]. More than 200 manganese ore deposits have been found, in which a lot of large manganese ores are well known, such as Xialei and Dounan. In this area, the genetic types of deposits are diverse and the ore-forming geological conditions are good, so it has bright future in prospecting. The metallogenic laws and temporal and spatial evolution laws in the study area are controlled by the process of marginal tectonic evolution of the South China Palaeo-continent, and dominated by the nature of continental marginal seas and the environment of manganese-forming basins [23]. The main geological factors controlling the formation and distribution of manganese ore include the nature of manganese sedimentary basins and their geotectonic conditions, metallogenic epoch, stratigraphic horizon and sedimentary formation, accumulation conditions of superposition and transformation, conditions of supergene enrichment and so on [24].
Based on the integration of the available geological data and the summary of the metallogenic regularity, the main metallogenic information denoting the formation and distribution of manganese ore in the west Guangxi and southeast Yunnan district is briefly summarized as follows:
1) Information of stratigraphic age and horizon;
2) Synsedimentary faults (Tectonic-magmatic dynamic field): the influence field of the synsedimentary faults of the Late Devonian Epoch and the influence field of the synsedimentary faults of the Middle Triassic Epoch;
3) Manganese sedimentary basins: the distance field of the shallow water platforms of the Late Devonian Epoch, the distance field of the deep water basins of the Late Devonian Epoch, the distance field of the turbidite basins of the Early Triassic Epoch, the distance field of the shallow water platforms of the Early Triassic Epoch, the distance field of the deep water basins of the Middle Triassic Epoch, and the distance field of the shallow marine carbonate platforms of the Middle Triassic Epoch;
4) Distribution of the sedimentary facies: distributions of the Famennian sedimentary facies of the Late Devonian Epoch, the Frasnian of the Late Devonian Epoch, the Eifelian of the Middle Devonian Epoch and the Givetian of the Middle Devonian Epoch, as well as the distribution of the lithofacies of the Ladinian of the Middle Triassic Epoch;
5) Distribution of the lithologic associations: distributions of the lithologic associations of the Famennian of the Late Devonian Epoch, the Frasnian of the Late Devonian Epoch, the Eifelian of the Middle Devonian Epoch and the Givetian of the Middle Devonian Epoch;
6) Thickness of the strata with manganese: distributions of the isopach of the Famennian of the Late Devonian Epoch, the Frasnian of the Middle Devonian Epoch, the Givetian of the Middle Devonian Epoch, the Eifelian of the Middle Devonian Epoch and the Falang Formation of the Middle Triassic Epoch in the southeast Yunnan;
7) Terrain condition: DEM elevation, DEM slope, DEM amplitude and DEM incision;
8) The distribution of the aeromagnetic anomalies.
The above metallogenic information was extracted by the methods of GIS spatial analysis and field analysis of metallogenic information proposed in this work. In the following section, the discussion will mainly be focused on describing the progression of extracting the metallogenic information of the synsedimentary faults (Tectonic-magmatic dynamic field) and the manganese sedimentary basins using the field analysis method of metallogenic information.
In order to extract the metallogenic information, the study area was divided into unit cells with a fixed size (2 km×2 km), and the total number of the unit cells was 44 298 (rows: 214, columns: 207).
3.2 Establishment of metallogenic information field models
The ore-controlling effects of the synsedimentary faults have the characteristic of superposition, and thus are modeled by the metallogenic influence field; whereas the ore-controlling effects of the sedimentary basins on the manganese mineral occurrences inside are related with the distance to the edge of the sedimentary basins, and thus are modeled by the metallogenic distance field.
1) Metallogenic influence field of synsedimentary faults
In the study area, there are two sets of synsedimentary faults: the synsedimentary faults of the Late Devonian Epoch in the southwest Guangxi (Fig.4) and the synsedimentary faults of the Middle Triassic Epoch in the southeast Yunnan.
In order to calculate the metallogenic influence field of synsedimentary faults, the module of building fields is implemented using VC++6.0 based on MapGIS API. This module used the mathematical model of the metallogenic influence field as its calculation model, as listed in Eqs.(3)-(6).
The main calculating procedures of building the metallogenic influence field of the synsedimentary faults
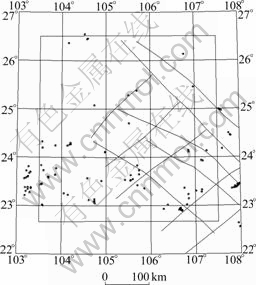
Fig.4 Synsedimentary faults and manganese mineral occurrences of Late Devonian Epoch in southeast Guangxi
include: 1) creating the layers of the synsedimentary faults using MapGIS; 2) selecting all elements of the synsedimentary faults to build the metallogenic influence field in MapGIS; 3) using the module to calculate the field strength of the metallogenic influence field of the central points of all unit cells in the study area, then outputting the calculations of the metallogenic influence fields of all central points (using the file format of text or excel); 4) according to the calculations of the metallogenic influence field, using Sufer to generate contour map, grayscale map, stereographic map and so on.
The grayscale map of the metallogenic influence field of the synsedimentary faults of the Late Devonian Epoch in the southwest Guangxi (fF_D3) is shown in Fig.5.
2) Metallogenic distance field of manganese sedimentary basins
In the study area, the main sedimentary basins include the deep water basins of the Late Devonian Epoch (Fig.6), the shallow water platforms of the Late Devonian Epoch, the shallow water platforms of the Early Triassic Epoch, the deep water basins of the Middle Triassic Epoch, and the shallow marine carbonate platforms of the Middle Triassic Epoch.
In order to calculate the metallogenic distance field of the manganese sedimentary basins, the module of building field was implemented using VC++6.0 based on MapGIS API, which used the mathematical model of the metallogenic distance field as its calculation model, as listed in Eqs.(12)-(16).
The specific calculating processes for building the metallogenic distance field of the manganese sedimentary basins consist of 1) creating the layers of
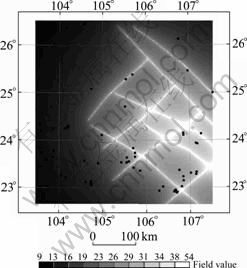
Fig.5 Grayscale of metallogenic influence field of synsedimentary faults of Late Devonian Epoch in southeast Guangxi
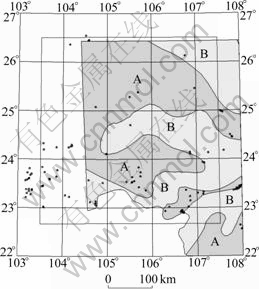
Fig.6 Deep water basins and manganese mineral occurrences of Late Devonian Epoch (A―Deep water basin; B―Shallow water plat from)
the manganese sedimentary basins using the MapGIS; 2) selecting all elements of the manganese sedimentary basins to build the metallogenic distance field in MapGIS; 3) using the module to calculate the field strength of the metallogenic distance field of the central points of all unit cells in the study area, then outputting the calculations of the metallogenic distance fields of all central points (using the file format of text or excel); 4) according to the calculations of the metallogenic distance field, using Sufer to generate contour map, grayscale map, stereographic map and so on.
The grayscale map of the metallogenic distance field of the deep water basins of the Late Devonian Epoch (dPSS_D3) is shown in Fig.7. In the process of calculating the metallogenic distance field of the basins, more attention must be paid to the following items: 1) The metallogenic distance field of the basin is the shortest distance from the central point of the unit cell in the basin to the margins (the boundary lines of the basin); 2) The basin margins, but not the boundaries of the study area, may be regarded as linear geological bodies to participate in the calculation; 3) The metallogenic distance of the unit cells outside the basins cannot be calculated or it has no meaning, because the metallogenic information of the manganese sedimentary basins does not take the unit cells outside the basins into consideration.
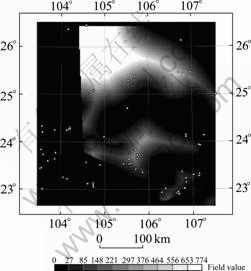
Fig.7 Grayscale of metallogenic distance field of deep water basins of Late Devonian Epoch
3.3 Analysis of correlations between metallogenic information fields and manganese mineralization distribution
Although the field models of metallogenic information can be used to simulate the ore-controlling effects of the manganese sedimentary basins and the synsedimentary faults, in order to extract the correlations between the metallogenic information and the mineralization distribution further, the statistical method is also needed to analyze the correlations between the metallogenic information fields and the mineralization distribution. The mineralization distribution is described directly by the total resources of the manganese ore deposits that just fall in the unit cell (which is called the mineralization index).
The process of using the statistical method to analyze the correlations between the metallogenic information field and the mineralization distribution is as follows: 1) regarding the field strength of the metallogenic information (as fF_D3 and dPSS_D3 aforementioned) as geological variables, figuring out the scatter pattern for “geological variable-mineralization distribution” and observing the mineralization distribution; 2) using the nonlinear model V=β0+ β1|g-d|n+ε, where V denotes the strength of mineralization distribution, g denotes the geological variable, β0, β1, d, n denote the unknown parameters to be solved, and ε denotes the random variable whose expected value is zero, to fit the scatter pattern for “geological variable-mineralization distribution” by the statistical analysis software, such as SPSS and other self-complied software, and after proper refrigeration, obtaining the value of d where the fitting effect is the optimal. If the regression effectiveness of the nonlinear regression is not significant, further choosing the complex nonlinear transformation to fit the processing; 3) making nonlinear transformation to the geological variables to convert them to geological variables that have significant linear correlation with the mineralization index. Then, the linear regression model, the correlation coefficient and the F statistical test of “the index of advantage degree of ore-formation-mineralization distribution” can be solved.
The scatter pattern for the metallogenic influence field fF_D3 and the mineralization index V is shown in Fig.8, and the scatter pattern for the metallogenic distance field dPSS_D3 and the mineralization index V is shown in Fig.9.
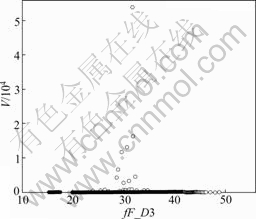
Fig.8 Scatter pattern for metallogenic influence field fF_D3 and mineralization index V
As for the correlations between the metallogenic influence field fF_D3 and the mineralization index V, by solving the nonlinear model, it can be gotten that d=31.696, and n=0.332. And as for the correlation between the metallogenic distance field dPSS_D3 and the mineralization index V, by solving the nonlinear model, it can be gotten that d=10.0 and n=1. Then,

Fig.9 Scatter pattern for metallogenic distance field dPSS_D3 and mineralization index V
making nonlinear transformation respectively to the geological variables fF_D3 and dPSS_D3 as follows, the geological variables ofF_D3 and dPSS_D3 can be gotten:
ofF_D3 = |ofF_D3-31.696|0.332
odPSS_D3 = | dPSS_D3-10.0| (18)
Performing linear regression analysis on the metallogenic variable ofF_D3 and the mineralization index V, it can be gotten that the correlation coefficient R=0.051 and the F statistical test, F(1, 6 078)=15.744> F0.05(1, 6 078)=3.85, and the regression effectiveness is significant. Performing linear regression analysis on the metallogenic variable odPSS_D3 and the mineralization index V, it can be gotten that the correlation coefficient R=0.043 and the F statistical test, F(1, 2 901)=5.444> F0.05(1, 2 901)=3.85, and the regression effectiveness is significant.
The above results of the statistical analysis indicated that there existed remarkable spatial correlations between both of the metallogenic influence field of the synsedimentary faults of the Late Devonian Epoch in the southwest Guangxi (fF_D3) and the metallogenic distance field of the deep water basins of the Late Devonian Epoch (dPSS_D3), and the manganese mineralization distribution (V) in the study area. And such correlations are nonlinear, which can be expressed by the nonlinear regression models.
As for the metallogenic influence field of the synsedimentary faults of the Late Devonian Epoch in the southwest Guangxi (fF_D3), the most advantageous field strength for the formation and distribution of the manganese ore deposits is between 25 and 35 (Fig.10). In the geological significance, the intrinsic cause of this correlation may be related to the fact that the synsedimentary faults have obvious controlling effects on basins, facies and ore. Under the structural environment of rifting basin and transpressional basin in
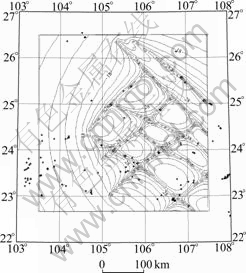
Fig.10 Isoline of metallogenic influence field fF_D3 and manganese mineral occurrences
the passive continental-margin, synsedimentary faults can undercut the mantle and the basic volcanic activity is developed relatively, so the manganese sources are abundant. At the same time, these can also lead to the formation of secondary depression trough basin that is advantageous to the manganese precipitation in the earlier stage of the basins, and the large and rich manganese ore deposits are easy to form [32]. Such controlling effects result from the combined effects of multiple faults (such as NE-strike-slip faults and NW-striking deep-seated faults in the southwest Guangxi district), and the characteristic of such controlling effects can be well expressed by the metallogenic influence field model.
As for the metallogenic distance field of the deep water basins of the Late Devonian Epoch (dPSS_D3), the advantageous field strength for the formation and distribution of manganese ore deposits is between 5 and 200, especially between 5 and 100 (Fig.11). In the geological significance, the intrinsic cause of this correlation may be related to the fact that the physical and chemical conditions are advantageous to the manganese (the manganese carbonate) precipitation when dPSS_D3=5-200 in the deep water basins of the Late Devonian Epoch (Semi-enclosed). In the striking pull-off basins of the passive continental-margin, the increasing and ejecting flows of the basic postmagmatic hydrothermal brines at seafloor (containing Mn, Fe, C and so on) and the convective circulation of the groundwater of submarine infiltration (extracting Fe, Mn and so on from the earth crust) lead to the precipitation of many manganese carbonate ores in the appropriate place in the basin under the inter mediate-alkalic and weakly reduced environment.
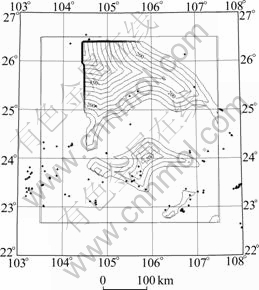
Fig.11 Isoline of metallogenic distance field dPSS_D3 and manganese mineral occurrences
4 Conclusions
1) Two types of metallogenic information can be expressed and analyzed by the metallogenic information field model. And there are two kinds of metallogenic information that can be described properly by the field model in the study area. One type has characteristics of the distance gradualness and the influence superposition on the manganese formation and distribution, such as synsedimentary faults. The other has the characteristic of the distance gradualness but not the influence superposition, such as the manganese sedimentary basins. These two types of metallogenic information can be described by the models of metallogenic influence field and metallogenic distance field, respectively.
2) According to the superposition principle in the field theory and the method of the spatial distance analysis, the mathematical models for the metallogenic influence field and the metallogenic distance field of the point, line and area geological bodies are derived out respectively by parameter equation and calculus, and the module of the field analysis of metallogenic information is implemented using VC++ based on MapGIS.
3) Taking the west Guangxi and southeast Yunnan district as an example, the metallogenic information field models of the synsedimentary faults and the manganese sedimentary basins are built through the metallogenic background analysis, and the spatial correlations between the metallogenic information fields and the manganese mineralization distribution are investigated and such correlations are described quantitatively by the nonlinear regression models. The analysis results indicate that the metallogenic information field can be used to describe and analyze the controlling effects of the synsedimentary faults and the manganese sedimentary basins on the formation and distribution of manganese quantitatively and effectively. And the descriptions and analyses not only have statistical significance, but also have accurate geological significance. Besides, the extracted metallogenic information can be used further in the quantitative prediction and assessment of manganese resources in the study area.
4) The field analysis method of metallogenic information can be used to describe, analyze and extract geological metallogenic information precisely and effectively, and it is an effective supplement to the method of extracting metallogenic information based on GIS and can help to resolve some issues of inadequately extracting metallogenic information.
References
[1] SINGER D A. Basic concepts in three-part quantitative assessments of undiscovered mineral resources [J]. Nonrenewable Resources, 1993, 2(2): 69-81.
[2] BONHAM-CARTER G F, AGTERBERG F P, WRIGHT D F. Weights of evidence modelling: A new approach to mapping mineral potential [J]. Geological Survey of Canada Paper, 1990, 89(9): 171-183.
[3] KNOX-ROBINSON C M, GARDOLL S J. GIS-stereoplot: An interactive stereonet plotting module for ArcView 3.0 geographic information system [J]. Computers & Geosciences, 1998, 24(3): 243-250.
[4] WANG Z J, CHENG Q M. GIS-based(W+-W-) weight of evidence model and its application to gold resources assessment in Abitibi, Canada [J]. Journal of China University of Geosciences, 2006, 17(1): 71-78.
[5] ZHAO P D, CHENG Q M, XIA Q L. Quantitative prediction for deep mineral exploration [J]. Journal of China University of Geosciences, 2008, 19(4): 309-318.
[6] ROY R, CASSARD D, COBBOLD P R, ROSSELLO E A, BILLA M, BAILLY L, LIPS A L W. Predictive mapping for copper-gold magmatic-hydrothermal systems in NW Argentina: Use of a regional-scale GIS, application of an expert-guided data-driven approach, and comparison with results from a continental-scale GIS [J]. Ore Geology Reviews, 2006, 29(3/4): 260-286.
[7] CASSARD D, BILLA M, LAMBERT A, PICOT J C, HUSSON Y, LASSERRE J L, DELOR C. Gold predictivity mapping in French Guiana using an expert-guided data-driven approach based on a regional-scale GIS [J]. Ore Geology Reviews, 2008, 34(3): 471-500.
[8] XIAO Ke-yan, ZHU Yu-sheng, SONG Guo-yao. Quantitative assessment of mineral resources based on GIS [J]. Geology in China, 2000, 27(7): 29-32. (in Chinese)
[9] CHEN Jian-ping, CHEN Yong, WANG Quan-ming. Study on synthetic informational mineral resource prediction Using GIS―A case study in Chifeng region, Inner Mongolia, China [J]. Earth Science Frontiers, 2008, 15(4): 18-26. (in Chinese)
[10] WANG Gong-wen, CHEN Jian-ping. Mineral resource prediction and assessment of copper multi-mineral deposit based on GIS technology in the north of Sanjiang region, China [J]. Earth Science Frontiers, 2008, 15(4): 27-32.
[11] XIAO Ke-yan, ZHANG Xiao-hua, SONG Guo-yao, CHEN Zheng-hui, LIU Dong-lin, WANG Si-long. Development of GIS-based mineral resources assessment system [J]. Earth Science (Journal of China University of Geosciences), 1999, 24(5): 525-528. (in Chinese)
[12] HU Guang-dao, CHEN Jian-guo. Design of the metallic mineral resources assessment and analysis system [J]. Geological Science and Technology Information, 1998, 17(1): 45-49. (in Chinese)
[13] YE Tian-zhu, XIAO Ke-yan, YAN Guang-sheng. Methodology of deposit modeling and mineral resource potential assessment using integrated geological information [J]. Earth Science Frontiers, 2007, 14(5): 11-19. (in Chinese)
[14] CHEN Yong-qing, WANG Xin-qing, CHEN Jian-guo, LIU Hong-guang, HUANG Jing-ling. GIS-based integrated quantitative assessments of mineral resources [J]. Geological Bulletin of China, 2007, 26(2): 141-149. (in Chinese)
[15] CHI Shun-du, ZHOU Shun-ping, WU Xin-ling. Geological anomaly and experience prognosis of metallic under GIS [J]. Earth Science (Journal of China University of Geosciences), 1997, 22(1): 99-103. (in Chinese)
[16] XIAO Long, WANG Fang-zheng, NICK H, GRAHAM B. Lineaments and their controls of gold mineralization in Tulasu area, Xinjiang, China [J]. Earth Science (Journal of China University of Geosciences), 2003, 28(2): 191-195. (in Chinese)
[17] CARRANZA E J M, RUITENBEEK F J A, HECKER C, van der MEIJDE M, VAN DER MEER F D. Knowledge-guided data-driven evidential belief modeling of mineral prospectivity in Cabo de Gata, SE Spain [J]. International Journal of Applied Earth Observation and Geoinformation, 2008, 10: 374-387.
[18] CARRANZA E J M, HALE M, FAASSEN C. Selection of coherent deposit-type locations and their application in data-driven mineral prospectivity mapping [J]. Ore Geology Reviews, 2008, 33(3/4): 536-558.
[19] YANG Yong-fa, XU Yong. Vector analysis and field theory [M]. Tianjin: Nankai University Press, 2006: 1-320. (in Chinese)
[20] SMITH M J D, GOODCHILD M F, LONGLEY P A. Geospatial analysis [M]. Leicester: Troubador Publishing Ltd, 2007: 1-516.
[21] DU Fa-yong, YANG Ze-gang. Ore forming geological condition in the Daqing manganese deposit in Yunnan [J]. Mineral Resources and Geology, 2006, 20(1): 19-22. (in Chinese)
[22] LUO Hua-bao. The direction of prospecting for high quality manganese ore resources in China [J]. Geology and Prospecting, 2002, 38(4): 8-11. (in Chinese)
[23] HOU Zong-lin, XUE You-zhi, HUANG Jin-shui, LIN You-huan, LIU Hong-jun, YAO Jing-qu, ZHU Kai-jun. Manganese ore deposits at peripheries of Yangtze platform [M]. Beijing: Metallurgy Industry Press, 1997: 1-364. (in Chinese)
[24] XUE You-zhi, HOU Zong-lin. Geology and exploration of fine quality Mn ore in China [J]. Contributions to Geology and Mineral Resources Research, 2006, 21(Supp): 1-4. (in Chinese)
Foundation item: Project(2006BAB01B07) supported by the National Science and Technology Pillar Program during the 11th Five-Year Plan Period of China
Received date: 2010-05-31; Accepted date: 2010-10-14
Corresponding author: MAO Xian-cheng, Professor, PhD; Tel: +86-731-88877571; E-mail: xcmao@126.com

