
Correlation between pre-peak in structure factor and physical properties in Al-based amorphous alloys
LI Rui, WANG Wei-min, MA Hai-jian, LI Gui-hua, QIN Jing-yu, ZHANG Zhong-hua, TANG Xing-wei
Key Laboratory for Liquid-Solid Structural Evolution and Processing of Materials of Ministry of Education,
Shandong University, Ji’nan 250061, China
Received 29 March 2010; accepted 9 July 2010
Abstract: To study the influence of Fe addition on the Al-based amorphous alloys, the structure and properties of Al84Ni10La6 and Al84Ni9Fe1La6 alloys were investigated through various techniques. The results show that 1% Fe (molar fraction) addition increases the area of the pre-peak in the structure factor and decreases the thermal expansion coefficient difference between the crystalline and amorphous states. 1% Fe addition also improves the glass forming ability (GFA), micro-hardness, fracture toughness, electric resistivity, absolute diamagnetism and corrosion resistance of Al-Ni-La alloys, which is related to the changes of medium-range order and quench-in free volume caused by 1% Fe addition.
Key words: Al-based amorphous; medium-range order; free volume; magnetism; corrosion resistance
1 Introduction
Due to the excellent mechanical properties,corrosion resistance and wear resistance, Al-based amorphous alloys were paid much attention to. A lot of work has been done on understanding the structure[1], crystallization kinetic[2-3], glass forming ability (GFA)[4-5] and other properties[6] of the Al-based amorphous alloys. Earlier studies showed that the Al-TM (transition metal)-RE (rare earth) alloy, especially the Al-Ni-La system, has an exceptionally broad glass forming composition range[7]. In recent years, many bulk metallic glasses (BMGs) with high GFA were successfully produced through similar elements substitution, such as Zr-[8], Fe-[9], Ti-[10] and Nd-[11] based BMGs. Very recently, YANG et al[12] obtained Al-rich (86% Al) bulk metallic glass (BMG) through La→Y substitution. A lot of work about substituting Ni by its similar elements of Al-Ni-La-based amorphous had been done, such as Al-Ni-La-X (X=Ag, Cu)[13] and Al-Ni-La-Co[14]. However, there is little work on the substitution of Ni by Fe in Al-Ni-La glassy system.
ELLIOTT[15] firstly divided the liquid and amorphous structures into three categories: short-range order (SRO), in the size range of 0.2-0.5 nm; medium-range order (MRO), in the size range of 0.5-2 nm; and long-range order (LRO), in the size beyond 2 nm. A pre-peak was found in the small diffraction vector part of the structure factor, which is a distinct feature for some Al-TM-based liquid and amorphous alloys[16-17]. Moreover, it was noticed that the pre-peak in XRD patterns or structure factors is the characteristic of MRO in liquid and amorphous alloys[16]. Hence, we can use the pre-peak to obtain the details of MRO atomic clusters in liquid and amorphous states. However, to our knowledge, there is little study on the correlation between the pre-peak and the physical properties of the Al-based glasses.
In general, compared with the crystalline state, the amorphous alloy contains more excess free volume. The free volume of amorphous alloys is an important factor on affecting the glass transition, structural relaxation and mechanical properties[18]. The structural relaxation and crystallization of an amorphous alloy will lead to the elimination of excess free volume[19]. It is significant to clarify the role of free volume on the physical and chemical properties of Al-based glassy alloys.
In this work, based on the structure factor and thermal expansion measurements, we analyze the effect of similar element substitution, Ni?Fe, on the GFA and various properties, such as micro-hardness and electric resistivity, of the Al-Ni-La-based amorphous alloys, and explore the relationship between the structure and properties.
2 Experimental
In this study, the ingots of Al84Ni10La6 (labeled as S1) and Al84Ni9Fe1La6 (labeled as S2) were obtained by induction melting the mixture of pure raw materials such as Al (99.9%, mass fraction), Ni (99.9%, mass fraction), La (99.5%, mass fraction) and Fe (99.7%, mass fraction). The raw materials were melted and poured into metallic mold to form the ingots. The ribbons were prepared by a single roller melt-spinning with the circumferential speed of 27.5 m/s.
The ribbons were investigated by X-ray diffractometry (XRD) on a D/Max-rB diffractometer with Cu Kα radiation, and the scanning angle (2θ) was from 10° to 110°. The XRD patterns were normalized after considering the atomic and Compton scattering factors. Consequently, the structure factor S(Q) of the amorphous alloys can be obtained through the following formula[20-21]:
 (1)
(1)
where the scattering vector Q=4πsinθ/λ, 2θ is the scattering angle; λ is the wavelength of X-ray; I is the intensity in XRD patterns; f(Q) is the atomic scattering factor; IComp is the Compton scattering factor; and α is the normalized factor. To identify the area of the pre-peak, a parabolic-like function f(x)=ax2+bx3, in which b is often much smaller than a, is used to fit the small-angle part of S(Q). Separation of the pre-peak is obtained by subtracting the parabolic-like function from S(Q)[22].
The thermal behaviors of samples were examined with the differential scanning calorimeter (DSC; Netzsch DSC404) under an argon atmosphere at a heating rate of 20 K/min, and dilatometric measurements were performed on a dilatometer (DIL Netzsch DIL402C) in an argon atmosphere at a heating rate of 10 K/min.
We measured the micro-hardness of the samples 50 times with 0.98 N load and 15 s holding time using HVS-1000 digital micro-hardness tester and considered the average value the final result. The thickness of samples was measured on the optical microscope (Nikon EPIPHOT 300). The fracture surface of the samples were obtained by loading the uniform load at both ends of the ribbons until the ribbons were pulled off, and examined by the scanning electron microscope (SEM HITACHI S-570, Japan).
The electric resistivity measurement of samples was conducted on a QJ44 DC electric bridge, using the four-point contact method. Magnetic measurements including the glass substrate were performed on an alternate gradient magnetometer (AGM-2900), under the fields up to 119.367 kA/m. A LK 2005A electrochemical workstation was used to give the polarization curves of samples at room temperature in 0.1 mol/L NaOH solution.
3 Results
The XRD patterns of Al84Ni10La6 (S1) and Al84Ni9Fe1La6 (S2) ribbons are shown in Fig.1. Obviously, there are two typical broad diffraction peaks, the pre-peak centers at 2θ=18°-20° and the main peak centers at 2θ=36°-38°. No crystalline peaks can be found, suggesting that both alloys bear a fully amorphous phase. The inset shows the structure factors S(Q) of S1 and S2.
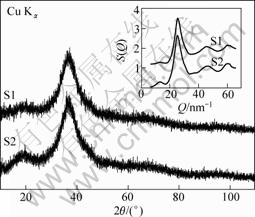
Fig.1 XRD patterns of Al84Ni10La6 (S1) and Al84Ni9Fe1La6 (S2) ribbons (The inset shows the structure factors S(Q) of S1 and S2 ribbons)
Fig.2 gives the optical micrographs of the longitudinal sections of S1 and S2. The insets show the higher magnification of the ribbons. No appreciable contrast revealing the precipitation of a crystalline phase is seen in both longitudinal sections of S1 and S2, suggesting that the ribbons consist of a glassy phase which is consistent with the results of XRD.
Parameters like the areas of main peak and pre-peak (Smp and Spp), the half height width of pre-peak (ΔQpp), the size of atomic cluster (D) and the ratio of Spp to Smp (Spp/Smp) obtained through the structure factor S(Q) are listed in Table 1. Here, Smp, Spp and ΔQpp were obtained by fitting the peaks by the Gaussian function, and D≈2π/ΔQpp[23]. Apparently, the Smp of S2 is slightly
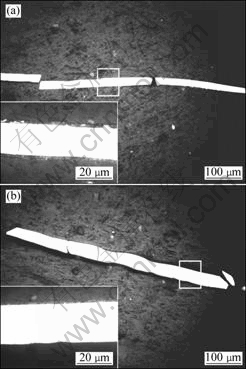
Fig.2 Optical micrographs of longitudinal sections of Al84Ni10La6 (S1) (a) and Al84Ni9Fe1La6 (S2) (b) ribbons (The insets are enlarged views of local ribbons)
Table 1 Parameters of main peak and pre-peak in structure factors S(Q) of Al84Ni10La6 (S1) and Al84Ni9Fe1La6 (S2) ribbons
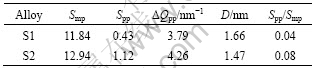
higher than that of S1, but the Spp and Spp/Smp of S2 are much higher, indicating that the amount of MRO of S2 is higher than that of S1 according to Elliot’s argument[15]. Meanwhile, the D of S2 is lower than that of S1.
Fig.3 gives the DSC curves of S1 and S2 ribbons at a heating rate of 20 K/min. The glass transition temperature (Tg), onset temperature of crystallization (Tx), end temperature of melting (Tl) and reduced glass transition temperature (Trg) are listed in Table 2. Here, Trg=Tg/Tl[24]. Generally, a larger Trg corresponds to a better GFA of one alloy. Obviously, the GFA of S2 is larger than that of S1, agreeing with the variation of
Table 2 Thermal parameters of Al84Ni10La6 (S1) and Al84Ni9Fe1La6 (S2) ribbons from DSC curves at heating rate of 20 K/min
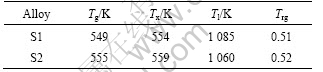
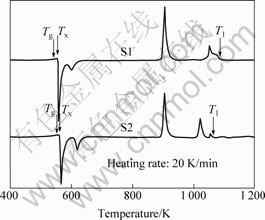
Fig.3 DSC spectra of Al84Ni10La6 (S1) and Al84Ni9Fe1La6 (S2) ribbons at heating rate of 20 K/min
Spp/Spp. SONG et al[25] found the same phenomenon in Al-Ni-Ce-based amorphous alloys.
The thermal expansion curves of the S1 and S2 amorphous ribbons in low temperature range with a heating rate of 10 K/min are shown in Fig.4, together with the curves of the S1 and S2 crystalline ingots. The solid lines in Fig.4 are the fitting lines of the raw data. The thermal expansion coefficients of the crystalline and amorphous states (αcryst and αamor) of S1 and S2 as well as the difference (Δα) between αcryst and αamor are listed in Table 3. Obviously, the Δα of S1 is larger than that of S2.
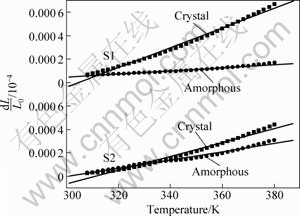
Fig.4 Thermal expansion curves of Al84Ni10La6 (S1) and Al84Ni9Fe1La6 (S2) alloys in crystalline and amorphous states with heating rate of 10 K/min
Table 3 Thermal expansion coefficients of amorphous and crystalline states (αamor and αcryst), and difference (Δα) between αcryst and αamor of Al84Ni10La6 (S1) and Al84Ni9Fe1La6 (S2) ribbons with heating rate of 10 K/min

Table 4 lists the micro-hardness (Hv) and thickness (τ) of S1 and S2 ribbons. Here, τ is obtained by averaging the thickness measured in the optical micrographs (Fig.2) 20 times per sample. It can be seen that the hardness of S2 is significantly higher than that of S1. Moreover, the S2 ribbon is thicker than the S1 ribbon, indicating a higher viscosity of the S2 melts during the melt spinning process.
Table 4 Micro-hardness (Hv) and thickness (τ) of Al84Ni10La6 (S1) and Al84Ni9Fe1La6 (S2) ribbons
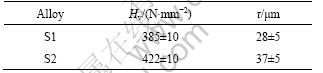
Fig.5 presents the SEM images of the fracture profiles and surfaces for S1 and S2 ribbons. The contour line of the fracture profile of S1 is tidy and smooth (Fig.5(a)), while that of S2 is relatively irregular (Fig.5(c)). The flat sections appear on the fracture surface of S1 (Fig.5(b)), but the major part of the fracture surface of S2 is rough (Fig.5(d)). Meanwhile, the average thicknesses in the local area of S1 and S2 are about 25 μm and 30 μm, respectively, which are consistent with the values measured in the optical micrographs (Fig.2 and Table 4).
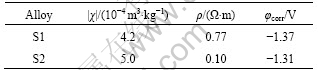
The M―H hysteresis loops of the S1 and S2 ribbons are given in Fig. 6. The curves of both samples exhibit a diamagnetic behavior, and S2 has a larger absolute value of the slope, indicating a larger absolute magnetic susceptibility (|χ|) compared with S1. Meanwhile, the measured electric resistivities (ρ) of S1 and S2 are 7.7×10⁻⁴ and 10×10-4 Ω・mm, respectively, which are consistent with the variation of |χ|.
Fig.7 shows the potentiodynamic polarization curves of the samples in 0.1 mol/L NaOH solution. It can be seen that both alloys exhibit a wide range of passivation. Moreover, the passive current density of S2 is significantly lower than that of S1, and the corrosion potential (φcorr) of S2 is higher than that of S1, indicating a better corrosion resistance of S2 than S1 in 0.1 mol/L NaOH. For the clarity, the absolute magnetic susceptibility (|χ|), the electric resistivity (ρ) and the corrosion potential (φcorr) of Al84Ni10La6 (S1) and Al84Ni9Fe1La6 (S2) ribbons are listed in Table 5.
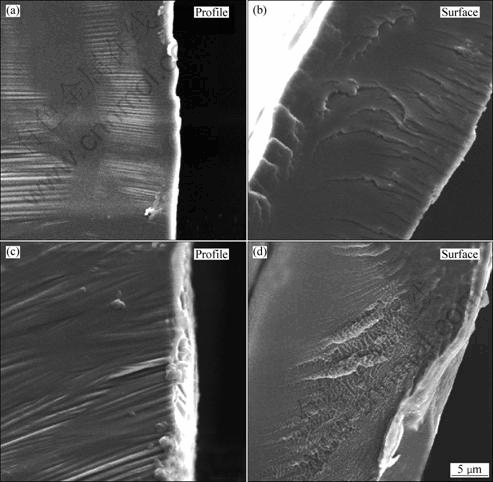
Fig.5 SEM images of fracture surface and profile of samples: (a), (b) Al84Ni10La6 (S1) alloy; (c), (d) Al84Ni9Fe1La6 (S2) alloy
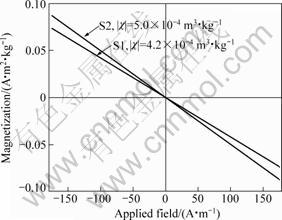
Fig.6 M―H hysteresis loops of Al84Ni10La6 (S1) and Al84Ni9Fe1La6 (S2) ribbons
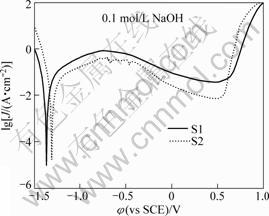
Fig.7 Potentiodynamic polarization curves of Al84Ni10La6 (S1) and Al84Ni9Fe1La6 (S2) ribbons in 0.1 mol/L NaOH solution open to air at room temperature
Table 5 Absolute magnetic susceptibility (|χ|), resistivity (ρ) and corrosion potentials (φcorr) of Al84Ni10La6 (S1) and Al84Ni9Fe1La6 (S2) ribbons
4 Discussion
4.1 Thermodynamic behaviors and mechanical properties
When the molten metals are quenched into amorphous state, some free volume is quenched in the amorphous state. The dilatometric behavior of a glass is related to the following two processes: 1) the distance between the vibrating position of atoms increases with the increase of temperature; 2) the free volume in the as-quenched glass eliminates during annealing[26]. Here, the elimination of the free volume is due to the irreversible structure relaxation, which should decrease the thermal expansion coefficient (α). We assume that the thermal expansion coefficient of the samples in the crystalline state is ascribed to the distance increment between the atomic vibration positions with increasing temperature. It can be supposed that the Δα between the crystalline and amorphous states is mainly caused by the elimination of the free volume during the annealing process. Therefore, a larger Δα of S1 corresponds to a higher value of the free volume elimination. In other words, the as-quenched S1 ribbon has a larger free volume. Obviously, the more the free volume contained in the ribbon, the smaller the activation energy for the structural transformation during the annealing process. Hence, the glass transition temperature (Tg) and onset crystallization temperature (Tx) of S1 are lower than those of S2 (Table 2). According to the similarity of the rapidly quenched ribbons and the melts[27], it can be speculated that in liquid state, S1 contains more free volume and has a lower viscosity than S2. Hence, it can be explained that the thickness of the S1 ribbon is lower than that of S2 (Table 4 and Fig. 5).
TURNBULL[24] applied the traditional nucleation theory to the metallic glass, proposed a physical mechanism of the formation of amorphous, and gave a relationship between nucleation rate I and viscosity η as follows:
 (2)
(2)
where kn is a constant; b is a constant determined by the nucleus shape; Tr=T/Tl is the reduced temperature; and α and β are the dimensionless parameters related to the melt-crystal interfacial energy and melting molecular enthalpy, respectively. According to Eq.(2), a lower viscosity indicates a higher nucleation rate I and a worse GFA. As above mentioned, the viscosity of S1 melt is lower than that of S2 melt. Consequently, it is understood that S2 has a better GFA than S1 (Table 2).
In Al-based glassy alloys, the Spp/Smp scales the number of MRO clusters contained in the glass[15]. The more the MRO clusters in the melt/glass are, the better GFA the alloy has[28]. From the S(Q) curves (Fig.1), the Fe addition increases the content of MRO clusters in the ribbon. Consequently, besides the viewpoint of the free volume, the fact that S2 has a better GFA than S1 (Table 2) can be explained.
Generally, the quench-in free volume in the samples will decrease the bonding energy among atoms and then decrease the hardness. Hence, it is expected that the Hv of S2 is higher than that of S1 (Table 4). On the other hand, it was reported that the strength of the amorphous alloys could be improved by the creation of dispersion-strengthened structures[29], and the smaller the dispersion structure unit, the higher the strength[30]. We can assume that the MRO characteristic clusters are considered the dispersed structure unit in the amorphous matrix. Because of the larger amount and smaller size of MROs which are characterized by Spp/Smp and D (Table 1), it can be speculated that the dispersion strengthening effect of MROs in S2 is stronger than that in S1. Hence, S2 exhibits a higher Hv than S1 according to the relationship between Hv and yield strength δy[31]:
 (3)
(3)
THOMPSON et al[32] found that the fracture toughness KIC is related to the increment of fractal dimension F of the fracture morphology by
 (4)
(4)
where K0 is defined as the toughness for a smooth planer fracture; ΔF is the fractal dimension increment; E is the elastic modulus; and a0 is a characteristic length involved in the fracture process. The fractal dimension F can be obtained by the fracture surface[31, 33]: the stronger the divarication degree of the fracture surface, the bigger the F. In Fig. 5, it can be found that the divarication degree of the fracture surface of S2 is stronger than that of S1, indicating a higher toughness of S2 according to Eq.(4). There is a proportional relationship between KIC and δy in stainless steel[34]:
 (5)
(5)
where M is a constant dependent on the orientation of the dispersed phase; s is a statistical parameter; and NA is the area number density of dispersed phase. According to Eq.(3) and Eq.(5), it is expected that the changing behavior of Hv of the ribbons is consistent with the fracture toughness (Fig.5 and Table 4).
4.2 Electromagnetic and electrochemical properties
It is known that the MROs in Al-based amorphous alloys are caused by the strong chemical orders which are formed by Al and other elements[1, 35]. The resistivities of pure Al, Ni, La and Fe elements are 2.7×10⁻⁵, 7.0×10⁻⁵, 79.4×10⁻⁵ and 10.1×10⁻⁵ Ω・mm, respectively[36]. More MRO clusters are contained in the S2 alloy (Fig.1 and Table 1), consuming more low-resistivity Al and leaving less Al in the matrix; thus, the electric resistivity of S2 is larger than that of S1 (Table 5). This is similar to the phenomenon that the resistivity of Mg-Zn alloys increases due to GP zone formation[37].
It was reported that the Al-Cu-Fe[38] and Al-Mn-Pd[39] alloys containing icosahedral phase exhibit a diamagnetic behavior at room temperature. The molecular dynamics simulation shows that the MROs in Al80Fe20 alloy are attributed to the icosahedral structures[28]. It is understood that S1 and S2 have a negative magnetic susceptibility. Moreover, BAHAUR[40] found the diamagnetism of Al-based amorphous alloys increases with the increase of the electric resistivity. As above mentioned, the ribbon with more MRO clusters exhibits a higher electric resistivity, it can be expected that the S2 alloy with more MRO clusters shows a stronger diamagnetism (Table 5 and Fig.6).
The more MRO clusters the amorphous ribbon contains, the larger bonding energy the atoms have, the more difficulties the atoms leaving the amorphous ribbons overcome, and the higher corrosion resistance the ribbon has. Meanwhile, a decrease in the free volume reduces the average atomic distance of the BMGs, which may improve their corrosion resistance[41]. Therefore, the S2 alloy, with more MRO clusters and less quench-in free volume, exhibits a better corrosion resistance (Fig. 7 and Table 5).
5 Conclusions
1) XRD patterns and calculated structure factors show that 1%Fe (molar fraction) addition improves the relative area of the pre-peak, suggesting that Fe addition increases the amount of medium-range order (MRO) clusters in the glassy Al-Ni-La ribbon.
2) 1% Fe addition decreases obviously the thermal expansion coefficient difference between the crystalline and amorphous states of Al-Ni-La alloys, indicating that the Fe addition decreases the quench-in free volume in the glassy Al-Ni-La ribbon.
3) 1% Fe addition improves the GFA, micro- hardness, fracture toughness, electric resistivity, absolute diamagnetism and corrosion resistance of Al-Ni-La alloy in 0.1 mol/L NaOH solution, which can be explained from the viewpoint of quench-in free volume and MRO structures in the Al-Ni-La alloys.
References
[1] ZHANG L, WU Y S, BIAN X F, LI H, WANG W M, WU S. Short-range and medium-range order in liquid and amorphous Al90Fe5Ce5 alloys [J]. J Non-cryst Solids, 2000, 262: 169-176.
[2] YE F, LU K. Crystallization kinetics of Al-La-Ni amorphous alloy [J]. J Non-cryst Solids, 2000, 262: 228-235.
[3] KELTON K F. Analysis of crystallization kinetics [J]. Mater Sci Eng A, 1997, 226-228: 142-150.
[4] LI G H, BIAN X F, SONG K K, GUO J, LI X L, WANG C D. Effect of Si addition on glass forming ability and thermal stability of Al-Fe-La alloys [J]. J Alloys Compd, 2009, 471: L47-L50.
[5] RIOS C T, SURI?ACH S, BAR? M D, BOLFARINI C, BOTTA W J, KIMINAMI C S. Glass forming ability of the Al-Ce-Ni system [J]. J Non-cryst Solids, 2008, 354: 4874-4877.
[6] ROY D, MITRA R, CHUDOBA T, WITCZAK Z, LOJKOWSKI W, FECHT H J, MANNA I. Structure and mechanical properties of Al65Cu20Ti15-based amorphous /nanocrystalline alloys prepared by high-pressure sintering [J]. Mater Sci Eng A, 2008, 497: 93-100.
[7] INOUE A, TAKEUCHI A. Recent progress in bulk glassy, nanoquasicrystalline and nanocrystalline alloys [J]. Mater Sci Eng A, 2004, 375-377: 16-30.
[8] QIAO J W, ZHANG Y, CHEN G L. Fabrication and mechanical characterization of a series of plastic Zr-based bulk metallic glass matrix composites [J]. Mater Des, 2009, 30: 3966-3971.
[9] WANG W M, GEBERT A, ROTH S, KUEHN U, SCHULTZ L. Effect of Si on the glass-forming ability, thermal stability and magnetic properties of Fe-Co-Zr-Mo-W-B alloys [J]. J Alloys Compd, 2008, 459: 203-208.
[10] GUO F Q, WANG H, POON S J, SHIFLET G J. Ductile titanium-based glassy alloy ingots [J]. Appl Phys Lett, 2005, 86: 091907.
[11] XIA M X, ZHANG S G, WANG H W, LI H G. The effect of Cu on the properties of Nd-based bulk metallic glasses [J]. Mater Des, 2009, 30: 1236-1239.
[12] YANG B J, YAO J H, ZHANG J, YANG H W, WANG J Q, MA E. Al-rich bulk metallic glasses with plasticity and ultrahigh specific strength [J]. Scripta Mater, 2009, 61: 423-426.
[13] ROY A, MANDHYAN A K, SAHOO K L, BANHART J, CHATTORAJ I. Electrochemical response of amorphous and devitrified Al-Ni-La-X (X=Ag, Cu) alloys [J]. Mater Corros, 2009, 60: 431-437.
[14] HUANG Z H, LI J F, RAO Q L, ZHOU Y H. Effects of replacing Ni by Co on the crystallization behaviors of Al-Ni-La amorphous alloys [J]. Intermetallics, 2008, 16: 727-731.
[15] ELLIOTT S R. Medium-range structural order in covalent amorphous solids [J]. Nature, 1991, 354: 445-452.
[16] HU L N, BIAN X F, WANG W M, ZHANG J Y, JIA Y B. Liquid fragility and characteristic of the structure corresponding to the prepeak of AlNiCe amorphous alloys [J]. Acta Mater, 2004, 52: 4773-4781.
[17] BRILLO J, BYTCHKOV A, EGRY I, HENNET L, MATHIAK G, POZDNYAKOVA I, PRICE D L, THIAUDIERE D, ZANGHI D. Local structure in liquid binary Al-Cu and Al-Ni alloys [J]. J Non-cryst Solids, 2006, 352: 4008-4012.
[18] TURNBULL D, COHEN M H. Free-volume model of the amorphous phase: Glass transition [J]. J Chem Phys, 1961, 34: 120-124.
[19] GREER A L. Atomic transport and structural relaxation in metallic glasses[J]. J Non-cryst Solids, 1984, 61-62: 737-748.
[20] CRICHTON W A, MEZOUAR M, GRANDE T, STELEN S, GRZECHNIK A. Breakdown of intermediate-range order in liquid GeSe2 at high pressure [J]. Nature, 2001, 414: 622-625.
[21] WANG W M, NIU Y C, WANG F, LIANG J C, JIN S F, ZHANG W G, BIAN X F. Electrical resistivity evolution in the annealed amorphous Fe78Si9B13 ribbons [J]. J Non-cryst Solids, 2008, 354: 3612-3618.
[22] SALMON P S. Real space manifestation of the first sharp diffraction peak in the structure factor of liquid and glassy materials [J]. Proc R Soc A, 1994, 445: 351-365.
[23] VATEVA E, SAVOVA E. New medium-range order features in Ge-Sb-S glasses [J]. J Non-cryst Solids, 1995, 192-193: 145-148.
[24] TURNBULL D. Under what conditions can a glass be formed? [J] Contemp Phys, 1969, 10: 473-488.
[25] SONG K K, BIAN X F, LV X Q, GUO J, LI G H, XIE M T. Compositional dependence of glass-forming ability, medium-range order, thermal stability and liquid fragility of Al-Ni-Ce-based amorphous alloys [J]. Mater Sci Eng A, 2009, 506: 87-93.
[26] WILDE G, KLOSE S G, SOELLNER W, GORLER G P, JEROPOULOS K, WILLNECKER R, FECHT H J. On the stability limits of the undercooled liquid state of Pd-Ni-P [J]. Mater Sci Eng A, 1997, 226: 434-438.
[27] SCOPIGNO T, RUOCCO G, SETTE F, MONACO G. Is the fragility of a liquid embedded in the properties of its glass? [J] Science, 2003, 302: 849-852.
[28] WANG L, CONG H R, BIAN X F. Medium-range order in liquid Al5Fe2 alloy[J]. Mater Sci Eng A, 2003, 341: 197-201.
[29] KIM J S, POVSTUGAR I V, CHOI P P, YELSUKOV E P, KWON Y S. Synthesis of Al-Y-Ni-Co composites by mechanical alloying and consecutive spark-plasma sintering [J]. J Alloys Comp, 2009, 486: 511-514.
[30] DAS J, TANG M B, KIM K B, THERSSMANN R, BAIER F, WANG W H, ECKERT J. “Work-hardenable” ductile bulk metallic glass [J]. Phy Rev Lett, 2005, 94: 205501.
[31] TABOR D. The hardness of matels [M]. Oxford: Clarendon Press, 1951.
[32] THOMPSON J Y, ANUSAVICE K J, BALASUBRAMANIAM B, MECHOLSKY J J. Effect of microcracking on the fracture toughness and fracture surface fractal dimension of Lithia-based glass-ceramics [J]. J Am Ceram Soc, 1995, 78: 3045-3049.
[33] ZHANG Ji-zhong. Fractal [M]. Beijing: Tsinghua University Press, 1995: 122. (in Chinese)
[34] GHOSH S, KAIN V, RAY A, ROY H, SIVAPRASAD S, STARAFDER S, RAY K K. Deterioration in fracture toughness of 304LN austenitic stainless steel due to sensitization [J]. Metall Mater Trans A, 2009, 40: 2938-2949.
[35] ZHOU J K, BIAN X F, WANG W M, XUE X Y, WANG S H, ZHAO Y, YIN K B. Medium-range order and crystallization in amorphous Al-Ni-Pr alloys [J]. Mater Lett, 2004, 58: 2559-2563.
[36] Webelements: the periodic table [EB/OL]. [2010-03-20]. http://www.webelements.com/.
[37] KOMATSU S, IKEDA M, MORI U, ABE M. Increase in resistivity of Mg-Zn alloys by low temperature aging [J]. J Jpn Inst Met, 2004, 54: 131-136.
[38] ZHANG L M, L?CK R. Phase diagram of the Al-Cu-Fe quasicrystal-forming alloy system-V. Solidification behaviour of Al-Cu-Fe quasicrystal forming alloys [J]. Z Metallkd, 2003, 94: 774-781.
[39] SCHEFFER M, SUCK J B. Influence of vacancies on the magnetic properties of icosahedral Al71.0Pd20.0Mn9.0 [J]. Mater Sci Eng A, 2000, 294-296: 629-632.
[40] BAHAUR D. Magnetic properties of Al-based icosahedral alloys [J]. Prog Cryst Growth Charact Mater, 1997, 34: 287-301.
[41] JIANG W H, JIANG F, GREEN B A, LIU F X, LIAW P K, CHOO H, QIU K Q. Electrochemical corrosion behavior of a Zr-based bulk-metallic glass [J]. Appl Phys Lett, 2007, 91: 041904.
铝基非晶合金中预峰与物理性能的关系
李 瑞,王伟民,马海健,李桂华,秦敬玉,张忠华,唐兴伟
山东大学 材料液固结构演变与加工教育部重点实验室,济南 250061
摘 要:为了研究Fe对Al基非晶合金的影响,通过各种技术对Al84Ni10La6和Al84Ni9Fe1La6的结构与性能进行了研究。结果表明:加入1%Fe(摩尔分数)增加了结构因子中预峰的面积并降低了晶态与非晶态热膨胀系数之间的差异;加入1%Fe提高了Al-Ni-La合金的非晶形成能力、显微硬度、断裂韧性、电阻率、抗磁性和耐腐蚀性,这是由添加1%Fe引起的中程序及自由体积的变化导致的。
关键词:铝基非晶;中程有序;自由体积;磁性;耐腐蚀
(Edited by YANG Hua)
Foundation item: Projects(50871061, 50871062, 50831003 and 50631010) supported by the National Natural Science Foundation of China; Project(2008BS04020) supported by the Excellent Youth Science and Technology Award of Shandong Province, China; Project(NCET-06-584) supported by the New Century Talents Program of the Ministry of Education, China; Project(2007CB613901) supported by the National Basic Research Program of China; Project(LZUMMM2010008) supported by Open Project of Key Laboratory for Magnetism Materials of the Ministry of Education, China
Corresponding author: WANG Wei-min; Tel: +86-531-88392749; E-mail: weiminw@sdu.edu.cn
DOI: 10.1016/S1003-6326(11)60681-X

