长沙市大气颗粒物PM10质量浓度的统计分布特性
邓启红1,黄柏良1,唐猛1, 2,周松梅1,刘蔚巍1
(1. 中南大学 能源科学与工程学院,湖南 长沙,410083;
2. 沈阳铝镁设计研究院,辽宁 沈阳,110001)
摘要:为了研究长沙市大气颗粒物的统计分布特性,选定4种理论分布函数(伽马分布、对数正态分布、韦伯分布和皮尔逊分布)拟合长沙市大气颗粒物PM10质量浓度样本,采用矩估计和极大似然估计法求解分布函数的参数;使用双参数指数分布函数描述高质量浓度PM10的尾部分布特性。研究结果表明:长沙市大气颗粒物PM10的整体分布特性为伽马分布,高质量浓度PM10的尾部分布为双参数指数分布。根据双参数指数分布PM10质量浓度超过国家空气质量日平均质量浓度标准的频率为8.5%;PM10达到国家标准所需要的污染源散发强度的降低量为35.8%。
关键词:母体分布;双参数指数分布;污染源降低量;超标频率
中图分类号:X513 文献标志码:A 文章编号:1672-7207(2012)04-1567-07
Statistical distributions of PM10 during summer in Changsha, China
DENG Qi-hong1, HUANG Bo-liang1, TANG Meng1, 2, ZHOU Song-mei1, LIU Wei-wei1
(1. School of Energy Science & Engineering, Central South University, Changsha 410083, China;
2. Shenyang Aluminum & Magnesium Engineering & Research Institute, Shenyang 110001, China)
Abstract: In order to analyze the PM10 mass concentration distribution, four theoretical parent frequency distribution functions, i.e. lognormal, Weibull, Gamma and Pearson V were used to fit the complete set of PM10 mass concentration in Changsha. The method of moment and the method of maximum likelihood were used to estimate the parameters. Two parameters exponential distribution was used to fit the high concentration of PM10. The results show that Gamma distribution is the best one to represent the performance of PM10 concentration while two parameters exponential distribution fits the high concentration of PM10 well. According to the two parameters exponential distribution the frequency of exceeding the air quality standard (AQS) is 8.5%, and the estimated emission source reduction of PM10 should be 35.8% to meet the assigned standard.
Key words: parent distribution; two-parameter exponential distribution; emission source reduction; frequency of exceeding the AQS
随着城市人口的快速增长,能源消耗速度迅速上升,污染物排放大量增加,导致大气环境遭遇前所未有的挑战,居民身体健康受到巨大的威胁。大气污染物已经成为影响环境和人类身体健康的主要危害因素之一,特别是其中的悬浮颗粒物由于能对全球气候和人体健康产生直接的负面影响,近年来引起了各国政府部门和科研机构的高度重视[1-3]。为了控制大气环境中颗粒物的质量浓度,降低颗粒物的健康风险,许多国家和地区制定了日趋严格的可吸入颗粒物PM10和细颗粒物PM2.5质量浓度排放标准。然而,Saltzman等[4]指出决定颗粒物健康风险因素不仅仅只是颗粒物的质量浓度水平,其质量浓度分布的波动范围由于增加了风险评估的不确定性也是影响颗粒物健康风险的另一重要因素。不仅如此,流行病学研究表明:颗粒物的健康效应不存在质量浓度阈值[5],低中度污染事件由于其发生频率高也具有较高的健康风险[6],这表明不同质量浓度所对应的发生频率也直接决定其健康风险的高低。因此,评估颗粒物的健康风险必先研究颗粒物的质量浓度水平、波动范围及其发生频率,即颗粒物的质量浓度分布特性[4]。研究颗粒物的质量浓度分布特性也可用于预测颗粒物质量浓度超过国家空气质量标准的发生频率,评估该地区颗粒物质量浓度达到国家标准所需要的污染源的降低量,从而为政府部门制定颗粒物的控制策略提供有效的参考,促进颗粒物尽快达标,降低其健康风险。大气颗粒物质量浓度是受污染源散发强度,气象条件和地形等诸多因素影响的随机变量[7],其质量浓度分布特性可由概率分布函数来描述。在欧美等国家,研究者对大气污染物的质量浓度分布特性进行了大量的研究工作,多种母体分布函数被用来描述污染物的分布特性,包括对数正态分布(Lognormal)[8]、韦伯分布(Weibull)[9]、皮尔逊分布(Pearson V)[10]以及伽马分布(Gamma)[11]等。与此不同,国内在颗粒物质量浓度的统计学分布特性方面的研究却较少,仅在上海地区有所开展,发现大气环境中的PM10质量浓度满足对数正态分布[12]。虽然以上母体分布通常均能较好的描述PM10质量浓度的整体分布特性,但其往往难以准确拟合高质量浓度PM10的尾部分布特性[9],这直接降低了超标频率预测的准确度。为了克服母体分布的这一缺陷,准确描述PM10的尾部分布特性,大量研究采用双参数指数分布来拟合高质量浓度PM10的尾部分布特性。研究结果表明:双参数指数分布能有效解决母体分布存在的问题,准确描述高质量浓度PM10的尾部分布特性[13]。为了研究长沙市大气颗粒物PM10的质量浓度分布特性,本文作者选取4种母体分布函数:对数正态分布,韦伯分布、皮尔逊分布以及伽马分布,拟合长沙市大气颗粒物PM10质量浓度的整体分布特性,从而确定长沙市PM10的分布类型。采用双参数指数分布描述高质量浓度PM10的尾部分布特性,进一步预测PM10超过国家空气质量日平均质量浓度标准的频率并估计颗粒物质量浓度达标所需要的污染源的降低量,以便为长沙市大气颗粒物的综合治理提供科学依据。
1 实验和方法
1.1 母体分布函数
随机变量PM10质量浓度的整体分布特性可以用母体分布的概率密度函数f(x)描述,PM10低于某质量浓度的概率可以用累积分布函数F(x)描述,二者关系如下:
 (1)
(1)
则PM10高于某质量浓度xc的高质量浓度发生频率为:
 (2)
(2)
例如PM10质量浓度超过国家标准150 μg/m3的概率为1-F(150)。
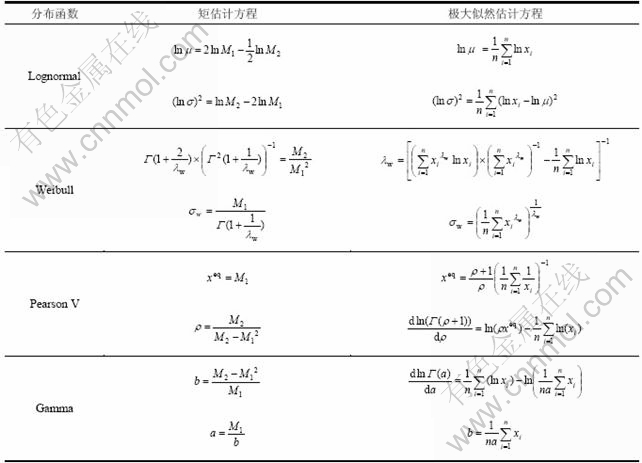
本文使用4种理论母体分布函数拟合PM10的日平均质量浓度整体分布,包括:对数正态分布,韦伯分布,皮尔逊分布和伽马分布(表达式见表1)。4种母体分布函数的表达式中均含有2个参数,参数值需根据被拟合的实际样本估计,估计方程见表2。
表1 4种理论母体分布函数的概率密度函数和累积分布函数
Table 1 Probability density function and Commulative distribution function of four theoretical parent distributions
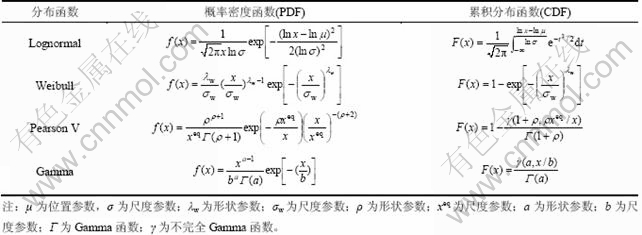
表2 4种理论分布参数的矩估计和极大似然估计方程
Table 2 Estimation equations by methods of moments and maximum likelihood for theoretical distributions
1.2 双参数指数分布
双参数指数分布FL(x)是Marani等[11]于1982年提出,它是用来描述总体分布F(x)中,高于特定分位数p的样本点的一种分布函数,二者存在如下关系:
 (3)
(3)
FL(x)的表达式如下:
 (4)
(4)
 (5)
(5)
式中:FL为累积分布函数;y为分布函数的变量;b和φ为分布函数的参数;x为高于分位数p的样本点组成的新样本X的样本值。
双参数指数分布函数中的参数,可采用经验分布函数对其进行估计。对应于新样本X中序号为任意值r(降序排列)的样本点xr,有:
 (6)
(6)
式中:N为X的容量; 为样本点xr对应的经验累积分布函数(r=1,2,…,N)。
将式(6)代入式(4)求得变量 ,再由式(5)使用最小二乘法对和xr进行线性拟合,即可求出分布函数的参数b和φ。
确定双参数指数分布的参数之后,可得PM10高于某质量浓度xc发生的频率1-F(xc)和回程周期T(xc)[14]:
 (7)
(7)
式中:p为分位数;FL(xc)为双参数指数分布在xc处的累积分布函数值。
1.3 污染源降低量评估
高质量浓度PM10回程周期的预测方法也可用于评估达标所需污染源降低量。假设Tm为允许超过标准值150 μg/m3的最小回程周期,ρ为Tm所对应的实际分布中的PM10质量浓度,则达标所需污染源降低量R为:
 (8)
(8)
1.4 实验数据与处理方法
1.4.1 实验数据
本文使用的数据由2009年6月至2009年10月间采用大气颗粒物监测仪TEOM(50 ℃)对长沙城市大气环境中的颗粒物PM10质量浓度进行的全天24 h实时连续监测得到。TEOM基于微震荡天平称质量原理,流量为16.7 L/min,测试单元加热到50 ℃,每分钟记录1次数据。本文中的PM10日平均质量浓度由每分钟质量浓度平均得到。采样点位于长沙市西南部某高校校园内,背靠岳麓山,距西二环约1 km,周边有轻度工业污染。采样期间的平均温度为28.4 ℃,相对湿度为76.6%,平均风速为1.8 m/s。
1.4.2 数据处理
本文采用矩估计和极大似然估计2种方法对母体分布函数进行参数估计。矩估计是一种最简单的参数估计方法,利用样本的各阶原点矩来估计理论分布的各阶原点矩[15],极大似然估计是基于极大似然原理的参数估计方法[16],采用最小二乘法求解参数,4种函数的矩估计方程和极大似然估计方程见表2。
确定各母体分布函数后,还需选取最能代表PM10质量浓度分布特性的分布函数。为此本文采用Chi-squares检验和K-S检验(Kolmogorov-Smirnov test)评价4种母体分布的拟合优度。Chi-squares检验值χ2反映了理论频数和实际频数的吻合程度,χ2越小,理论分布对实验值的拟合程度就越好。K-S检验值Dmax反映了理论累积分布函数和实际的累积分布函数最大差别,Dmax越小,表明拟合程度越好。
2 结果与讨论
2.1 PM10质量浓度水平
图1所示为采样期间PM10日平均质量浓度变化趋势图。在采样期间的103 d中,长沙市大气颗粒物的平均质量浓度为93.8 μg/m3,低于国家空气质量年平均质量浓度二级标准100 μg/m3,但仍有9 d的日平均质量浓度高于国家空气质量日平均质量浓度二级标准150 μg/m3,对应超标频率为8.7%。在采样期间PM10质量浓度呈现出随月份波动的特征,6~7月污染相对较轻,从9月开始污染逐步加重。长沙市大气颗粒物PM10的月变化特点主要与该地区的气象条件有关,由于6~7月份太阳辐射最强,大气层对流发展旺盛,有利于颗粒物的扩散,因此,颗粒物质量浓度较低。
2.2 PM10质量浓度整体分布特性
为了研究长沙市大气颗粒物PM10的质量浓度分布特性,首先需确定PM10最符合的理论分布函数。图2所示为矩估计和极大似然估计得出的理论函数概率密度分布和实际值概率密度分布比较图,对应的参数的估计值见表3。在确定了分布函数的参数估计值后,可通过Chi-squares检验和K-S检验比较采用2种参数估计方法所得各分布函数的拟合优度,从而选取适当的参数估计方法和最佳母体分布函数来描述PM10的质量浓度分布特性。
矩估计得到的母体分布函数Chi-squares检验值χ2分别为:对数正态分布10.98、韦伯分布4.82、皮尔逊分布37.06、伽马分布2.91。极大似然估计得到的母体分布函数Chi-squares检验值χ2如下:对数正态分布为3.45,韦伯分布为4.81,皮尔逊分布为6.91,伽马分布为2.44(如表3所示)。显然,矩估计的Chi-squares检验值χ2均高于极大似然估计的Chi-squares检验值χ2,表明矩估计的误差较极大似然估计大。尤其对于矩估计得到的皮尔逊分布有p<0.001,即理论母体分布函数的概率分布与实际质量浓度的概率分布存在显著性差异,充分说明矩估计的误差较大。因此,采用极大似然估计能够更准确的估计PM10质量浓度分布的参数值。比较K-S检验的结果也能得出极大似然估计优于矩估计的结论。这一结论与台湾地区PM10质量浓度分布的研究结果一致[7]。
在选取了极大似然法作为参数估计方法之后,比较各函数极大似然估计的χ2和Dmax可判断4种理论母体分布对PM10实际分布的拟合优劣。由表3可知:在4种理论分布中,伽马分布的检验值最小,其次为对数正态分布和韦伯分布,而皮尔逊分布的检验值最大。这说明伽马分布与实际分布的差异最小,拟合程度最高,其次为对数正态分布和韦伯分布,皮尔逊分布的拟合优度较差。根据4种极大似然估计所得母体分布函数,长沙市大气颗粒物PM10在采样期间超过国家空气质量日平均质量浓度二级标准150 μg/m3的频率和超标天数预测值如下:对数正态分布为9.8%,超标10 d;韦伯分布为7.4%,超标8 d;皮尔逊分布为11.7%,超标12 d;伽马分布为8.3%,超标9 d。由图1可知:PM10实测数据的超标天数为9 d,超标频率为8.7%。对比上述结果,同样可以发现伽马分布与PM10的实际分布情况最接近,而对数正态分布和皮尔逊分布的估计值偏高,韦伯分布的估计值偏低。因此,长沙市大气颗粒物PM10质量浓度的整体分布特性呈伽马分布,其形状参数和尺度参数分别为6.07和15.47。
2.3 高质量浓度PM10尾部分布特性
在使用分布函数预测PM10质量浓度的超标频率和回程周期时,分布函数的尾特性决定了预测结果的准确度[17]。虽然母体分布函数能有效的拟合PM10的整体分布特性,但其往往不能准确描述高质量浓度PM10的尾部分布特性。如图3所示,在中低质量浓度条件下,4种分布函数对实验值的拟合效果很好,但在高质量浓度条件下,理论值和实际值逐渐发生偏离,其中对数正态分布,皮尔逊分布和伽马分布高估了高质量浓度的发生概率。而韦伯分布低估了高质量浓度的发生概率,说明高质量浓度PM10的尾部分布特性不可用描述PM10整体分布的母体分布函数进行统一描述。为了有效描述PM10在高质量浓度条件下的分布特征,需采用双参数指数分布对PM10高质量浓度进行拟合[14]。
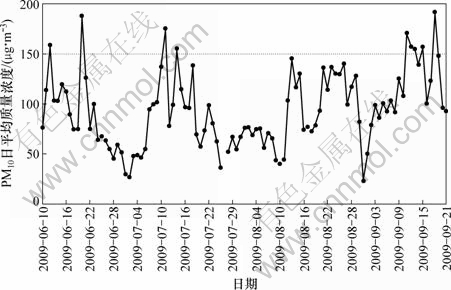
图1 采样期间PM10日平均质量浓度(2009-06~2009-09)
Fig.1 Average diurnal concentrations of PM10 from July 2009 to September 2009
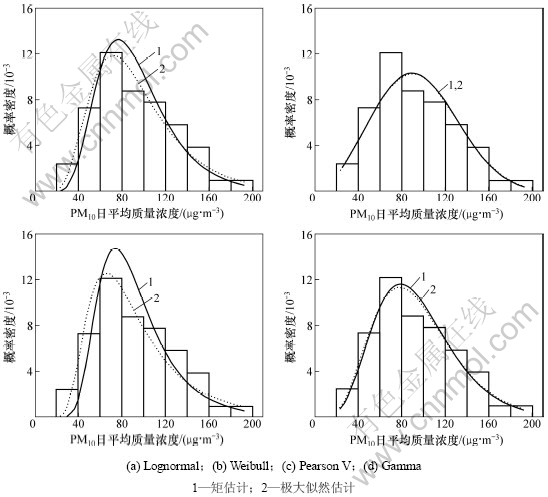
图2 参数的矩估计和极大似然估计结果
Fig.2 Parameters estimated by methods of moments and maximum likelihood
表3 矩估计和极大似然估计的参数值及拟合优度检验值
Table 3 Estimated parameters and goodness of fitting by methods of moments and maximum likelihood
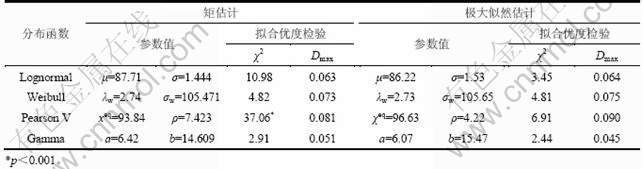
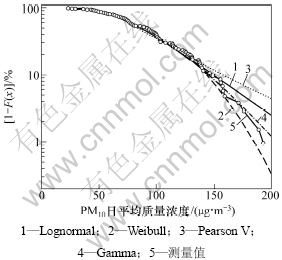
图3 理论分布与实际分布的高质量浓度PM10发生频率
Fig.3 Exceeding probability of high PM10 concentration for theoretical distributions and observed data
本文中取分位数p=0.75,即选取PM10序列中,质量浓度高于0.75分位数的数据组成新样本X,估计双参数指数分布的参数。由线性拟合得出:b=0.041,φ=123.688 (如图4所示)。则双参数指数分布的表达式为:
 (9)
(9)
方程的拟合优度为0.975,接近1,表明双参数指数分布能够很好地描述PM10的极值质量浓度分布。从图5可以看出:随着质量浓度的升高,累积分布函数和高污染事件出现的周期呈指数形式增加,这与PM10在高质量浓度处经验分布函数迅速上升的趋势保持一致,说明高质量浓度PM10的尾部分布特性符合双参数指数分布。
图5所示为母体分布函数和双参数指数分布函数对高质量浓度样本的预测值比较结果。从图5可以看
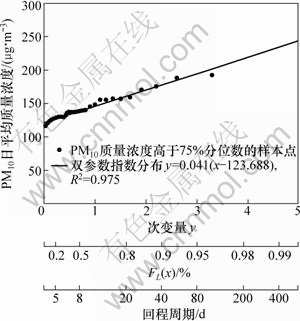
图4 双参数指数分布的理论拟合曲线、累积分布函数以及回程周期
Fig.4 Fitted theoretical line of two-parameter exponential distribution, cumulative distribution function and return period
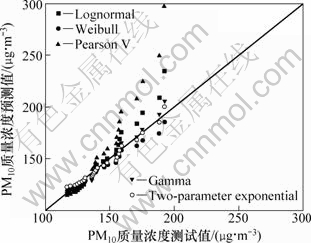
图5 母体分布函数和双参数指数分布函数对
PM10极值质量浓度的预测结果比较
Fig.5 Comparisons of parent and two-parameter exponential distribution with actual data in high concentration region
出:双参数指数分布的预测值与实际值最为接近,拟合情况最好。显然,采用双参数指数分布,能够有效地解决母体分布函数在高质量浓度条件下理论值和实际值存在偏离的问题。
根据双参数指数的分布(式9),PM10质量浓度超过国家空气质量日平均质量浓度二级标准150 μg/m3的频率为0.085,由式(7)有超标回程周期为11.7 d,超标时间约为9 d。显然,双参数指数分布的预测值与实际值相符并优于母体分布预测结果。这也表明长沙市大气颗粒物PM10质量浓度的尾部分布特性属于双参数指数分布。
2.4 污染源降低量估计
由于双参数指数分布对高质量浓度PM10的分布预测最准确,现采用该分布函数计算PM10质量浓度达标所需的污染源降低量。本文以365 d时间内PM10质量浓度都不超过150 μg/m3为标准,即允许超标的最小回程周期Tm为365 d,此时,PM10超标事件发生频率为 0.002 74。在所得双参数指数分布中,对应该超标频率的实际质量浓度为233.78 μg/m3,由式(8)得到PM10质量浓度达标所需污染源降低量为35.8%。长沙市对污染源排放的控制还需进一步加强。
3 结论
(1) 在采样期间,长沙市大气颗粒物的平均质量浓度为93.8 μg/m3,低于国家空气质量二级标准,但仍有9 d的天平均质量浓度高于150 μg/m3,实际超标频率为8.7%。
(2) 长沙市大气颗粒物PM10质量浓度的整体分布特性呈伽马分布。理论分布函数中的参数应采用极大似然法进行估计。根据伽马分布,PM10质量浓度超标的频率为8.3%。
(3) 双参数指数分布能有效解决母体分布函数在高质量浓度下与实际值发生偏离的问题。高质量浓度PM10的尾部分布符合双参数指数分布,高质量浓度出现的概率随质量浓度的增长呈指数衰减的趋势。
(4) 根据双参数指数分布,PM10超出国家空气质量日平均质量浓度二级标准的发生频率为8.5%。长沙市PM10质量浓度达标所需的污染源降低量为35.8%。
参考文献:
[1] Dockery D W, Pope C A, Xu X, et al. An association between air pollution and mortality in six U.S. cites[J]. New England Journal of Medicine, 1993, 329(24): 1753-1759.
[2] Anderson H R, Atkinson R W, Peacock J L, et al. Meta-analysis of time series studies and panel studies of particulate matter (PM) and ozone (O3)[R]. Copenhagen: WHO Regional Office for Europe, 2004: 186-213.
[3] Pope III C A, Burnett R T, Thun M J, et al. Lung cancer, cardiopulmonary mortality, and long-term exposure to fine particulate air pollution[J]. Journal of the American Medical Association, 2002, 287(9): 1132-1141.
[4] Saltzman B E. Health risk assessment of fluctuating concentrations using lognormal models[J]. Journal of the Air and Waste Management Association, 1997, 47(11): 1152-1160.
[5] Samoli E, Analitis A, Touloumi G, et al. Estimating the exposure-response relationships between particulate matter and mortality within the APHEA multicity project[J]. Environmental Health Perspectives, 2005, 113(1): 88-95.
[6] Abbey D E, Nishino N, Mcnonnell W F, et al. Long-term inhalable particles and other air pollutants related to mortality in nonsmokers[J]. American Journal of Respiratory Critical Care Medicine, 1999, 159: 373-382.
[7] Lu H C. The statistical characters of PM10 concentration in Taiwan area[J]. Atmospheric Environment, 2002, 36(3): 491-502.
[8] Kao A S, Friedlander SK. Frequency distributions of PM10 chemical components and their sources[J]. Environmental Science and Technology, 1995, 29(1): 19-28.
[9] Georgopoulos P G, Seinfeld J H. Statistical distribution of air pollutant concentration[J]. Environmental Science and Technology A, 1982, 16(7): 401-403.
[10] Morel B, Yen S, Cifuentes L. Statistical distribution for air pollutant applied to the study of the particulate problem in Santiago[J]. Atmospheric Environment, 1999, 33(16): 2575-2585.
[11] Marani A, Lavagnini I, Buttazzoni C. Statistical study of air pollutant concentrations via generalized Gamma distribution[J]. Journal of Air Pollution, 1986, 36(11): 1250-1254.
[12] Kan H D, Chen B H. Statistical distributions of ambient air pollutants in shanghai, China[J]. Biomedical and Environmental Sciences, 2007, 17(3): 366-372.
[13] Lu H C, Fang G C, Predicting the exceedances of a critical PM10 concentration-a case study in Taiwan[J]. Atmospheric Environment, 2003, 37(25): 3491-3499.
[14] Lu H C. Estimating the emission source reduction of PM10 in central Taiwan[J]. Chemosphere, 2004, 54(7): 805-814.
[15] Mage D T, Ott W R. An evaluation of the methods of fractiles, moments and maximum likelihood for estimating parameters when sampling air quality data from a stationary lognormal distribution[J]. Atmospheric Environment (1967), 1984, 18(1): 163-171.
[16] Wilks D S. Statistical methods in the atmospheric sciences[M]. 2nd ed. Burlington: Academic Press, 2006: 251-283.
[17] Mijic Z, Tasic M, Rajsic S, et al. The statistical characters of PM10 in Belgrade area[J]. Atmospheric Research, 2009, 92(4): 420-426.
(编辑 赵俊)
收稿日期:2011-06-23;修回日期:2011-09-12
基金项目:高等学校全国优秀博士学位论文作者专项资金资助项目(FANEDD200545);国家自然科学基金资助项目(NSFC51178466);国家科技支撑计划项目(2008BAJ12B03)
通信作者:邓启红(1973-),男,河南潢川人,教授,从事城市环境及健康效应研究;电话:0731-88877175;E-mail:qhdeng@csu.edu.cn

