2024-T3���Ͻ�������-����-�����е�����������ʴ��Ϊ
��Դ�ڿ����й���ɫ����ѧ��(Ӣ�İ�)2013���9��
�������ߣ�M. SAEEDIKHANI M. JAVIDI A. YAZDANI
����ҳ�룺2551 - 2559
�ؼ��ʣ�����������2024-T3���Ͻ𣻻�ϵ��Һ��EIS
Key words��anodizing; 2024-T3 aluminum alloy; mixed electrolyte; EIS
ժ Ҫ���ں���10%���ᡢ5%�����2%����Ļ�ϵ��Һ�У���2024-T3���Ͻ���������������������������ʴ���ܡ�ʹ�õ绯ѧ�迹Ƶ�����о���������������Ͻ�ĸ�ʴ��Ϊ���������ƶ�ͼ����ˮ�����������жԱȷ��֣���ֻ����������������ĵ��Һ��ȣ�ʹ�ú���10%���ᡢ5%�����2%����Ļ�ϵ��Һ���������������2024-T3���Ͻ𣬾��и��õ���ʴ�Ժͳ־��ԡ��õ��Һ��������ձ����������������Ͻ�ĸ�����ԡ��
Abstract: The corrosion resistance of 2024-T3 aluminum alloy was improved by anodizing treatment in a mixed electrolyte containing 10% sulfuric acid, 5% boric acid and 2% phosphoric acid. Electrochemical impedance spectroscopy (EIS) technique was used to study the corrosion behavior of the anodized alloy. Using Tafel plot and salt spray techniques, it is revealed that the anodizing treatment of 2024-T3 aluminum alloy in sulfuric-boric-phosphoric acids provides better corrosion resistance and durability in comparison with the anodizing treatment in phosphoric acid or sulfuric-boric acids. This electrolyte can be a suitable alternative for chromate baths which are generally used in the anodizing of aluminum alloys.
Trans. Nonferrous Met. Soc. China 23(2013) 2551-2559
M. SAEEDIKHANI, M. JAVIDI, A. YAZDANI
Department of Materials science and Engineering, School of Engineering, Shiraz University, Shiraz 7134851154, Iran
Received 28 August 2012; accepted 27 November 2012
Abstract: The corrosion resistance of 2024-T3 aluminum alloy was improved by anodizing treatment in a mixed electrolyte containing 10% sulfuric acid, 5% boric acid and 2% phosphoric acid. Electrochemical impedance spectroscopy (EIS) technique was used to study the corrosion behavior of the anodized alloy. Using Tafel plot and salt spray techniques, it is revealed that the anodizing treatment of 2024-T3 aluminum alloy in sulfuric-boric-phosphoric acids provides better corrosion resistance and durability in comparison with the anodizing treatment in phosphoric acid or sulfuric-boric acids. This electrolyte can be a suitable alternative for chromate baths which are generally used in the anodizing of aluminum alloys.
Key words: anodizing; 2024-T3 aluminum alloy; mixed electrolyte; EIS
1 Introduction
The application of an anodic polarization to an aluminum alloy sample which is immersed in an appropriate electrolyte leads to anodic oxide film growth [1]. The anodic oxide film is characterized by a duplex structure composed of inner thin barrier layer and thick outer porous layer [2-4]. Anodizing in chromic acid electrolyte is an effective way to produce oxide films with excellent corrosion resistance. However, the use of Cr(VI) is prohibited since it is toxic and carcinogenic [5]. In order to eliminate Cr(VI) from anodizing process, several studies have been realized [6,7]. There is not a singular candidate for the replacement of chromium and the aim of most researches has focused on the combination of different techniques to improve the corrosion resistance of oxide film such as using mixed-acid-electrolytes like boric-sulfuric acids and nitric-sulfuric acids [8-10]. This study proposed a mixed bath containing sulfuric-boric-phosphoric acids for the anodizing of 2024-T3 aluminum alloy. Aluminum alloys containing copper (2000 series) exhibit high strength and are widely used but generally have low corrosion resistance [11] and are susceptible to localized corrosion [5,12]. Thus, these alloys are mostly anodized to improve their corrosion resistance [13]. The anodizing process and the properties of the anodic films are obviously influenced by the alloying elements [14]. The intermetallic particles that give strength to these alloys can result in the susceptibility of the alloys to galvanic corrosion [15]. The corrosion resistance of the anodized alloy is enhanced to some extent by a hydrothermal treatment named sealing. This treatment is necessary for the porous surface layer [3]. Many authors reported different sealing methods for aluminum anodic films. The sealing of anodic films in boiling water effectively prevents the risk of pitting corrosion even in the high corrosive environments. The main role of sealing process is the blockage of pores due to the formation of hydrated alumina [6]. Electrochemical impedance spectroscopy (EIS) technique has been used to study the corrosion resistance of anodized aluminum alloys [4]. EIS technique can characterize the properties of the barrier layer and the sealed porous layer by fitting the impedance spectra to an appropriate electrical equivalent circuit. EIS technique can also measure the thickness of oxide film [4,16].
This study was conducted to improve the corrosion resistance of the 2024-T3 aluminum alloy by anodizing in sulfuric-boric-phosphoric mixed-acid-bath followed by sealing treatment carried out in boiling water. The corrosion behavior of the anodized alloy and also the degradation of oxide films were studied in an aggressive media using EIS technique. Tafel plot and salt spray techniques were used to compare the corrosion resistance and durability of the alloys anodized in phosphoric acid, sulfuric-boric acids and sulfuric-boric-phosphoric acids.
2 Experimental
2.1 Materials
The investigated material in this research was 2024-T3 aluminum alloy. The chemical composition of the bulk material was evaluated by the use of optical emission spectrometer (OES) technique. Scanning electron microscopy (SEM) and energy dispersive X-ray spectroscopy (EDS) methods (VEGA II TESCAN) were used to study the surface of the alloy before and after surface preparation both prior anodizing process.
2.2 Surface preparation
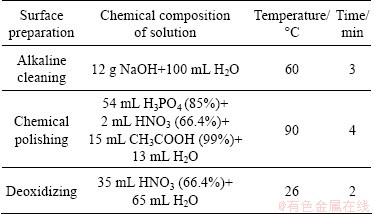
The surfaces of the samples were ground using SiC abrasive papers up to number 800, and cleaned with deionized water and acetone. The samples were alkaline cleaned, chemically polished and finally de-smuted. After each step, the samples were rinsed with deionized water and air dried. Table 1 lists the chemical composition of the solutions used for surface preparation and the holding time and temperature.
Table 1 Chemical composition of solutions used for surface preparation and holding time and temperature
2.3 Anodizing and sealing
A simple rectifier with a maximum power of 40 V and 4 A was used for applying anodic polarization. A large enough lead sheet was used as cathode. The anode electrode was 2024-T3 aluminum alloy. Anodizing was carried out at room temperature in a mixed electrolyte composed of 10% sulfuric acid, 5% boric acid and 2% phosphoric acid under current density of 1 mA/cm2 for 20 min. Also one sample was anodized in electrolyte of 10% phosphoric acid under current density of 4 mA/cm2 for 20 min. Another sample was anodized in electrolyte of 5% sulfuric acid and 0.8% boric acid under current density of 3.5 mA/cm2 for 20 min according to the work by ZHANG et al [7]. Sealed and unsealed anodized samples were compared. Sealing treatment was carried out in boiling deionized water for 30 min. Finally, the samples were rinsed and air dried.
2.4 Electrochemical tests
In order to investigate the corrosion behavior of anodized alloys in the sulfuric-boric-phosphoric acids, EIS technique was used with three-electrode configuration cell. An Ag/AgCl electrode as reference electrode, a platinum rod as auxiliary electrode and an anodized sample as working electrode were employed. The electrochemical test cell was open to air at room temperature containing aqueous electrolyte of 3.5% NaCl. The samples anodized in sulfuric-boric- phosphoric acids were dipped in aqueous media of 3.5% NaCl for 1, 2, 10, 24 and 48 h to investigate the extent of degradation of the oxide film using EIS. Impedance measurements were taken over a frequency range of 105 down to 10-2 Hz using a 10 mV single sine wave. Data were shown as Nyquist plots. In addition, Tafel plot technique was used to compare the corrosion resistance of phosphoric, sulfuric-boric and sulfuric-boric- phosphoric acids anodized alloys. The potential scanning rate for Tafel plot was 1 mV/s. The equipment for electrochemical tests was ��Autolab type III with the frequency response analyzer (FRA) and general purpose electrochemical system (GPES) softwares for analyzing the resulted EIS and Tafel plot data, respectively.
2.5 Salt spray test
Neutral salt spray test was performed according to ASTM B117 standard [17]. Anodized samples in different electrolytes of phosphoric, sulfuric-boric and sulfuric-boric-phosphoric acids were exposed to 3.5% NaCl solution at 35 ��C.
3 Results and discussion
3.1 Surface preparation
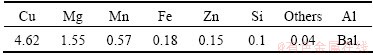
The bulk chemical composition of the investigated alloy is listed in Table 2.
Table 2 Bulk chemical composition of 2024-T3 aluminum alloy (mass fraction, %)
Copper is one of the most important alloying elements for 2024-T3 alloy due to its strengthening effect. In addition, 2024-T3 alloy contains other alloying elements which lead to the presence of several intermetallic phases [2]. The SEM micrograph of the surface of 2024-T3 alloy is shown in Fig. 1, which presents different phases.
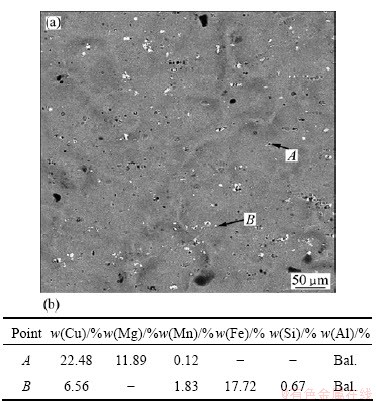
Fig. 1 SEM micrograph (a) and EDS analysis (b) of surface of 2024-T3 aluminum alloy before surface treatment
The EDS analysis of the surface of 2024-T3 alloy reveals that the dark areas are corresponding to Al-Cu-Mg phase and the white areas are corresponding to Al-Cu-Mn-Fe-Si phase. It can be seen from Fig. 1 that Al-Cu-Mg particles have relatively round shapes and Al-Cu-Mn-Fe-Si particles have irregular shapes. MOUTARLIER et al [2] reported that after treatment in sulfuric medium, Al-Cu-Mg particles are severely attacked and the matrix dissolves slightly over the whole specimen; whereas the Al-Cu-Mn-Fe-Si particles seem undamaged. Other studies [18,19] have indicated that Al-Cu-Mg phases tend to be anodic relative to the matrix; whereas Al-Cu-Mn-Fe-Si phases tend to be cathodic relative to the matrix. It is obvious from Table 2 and Fig. 1 that copper exists in the surface microstructure as well as in the bulk microstructure of the alloy. Alkaline cleaning, chemical polishing and deoxidizing solutions were employed to treat the surface of the alloy before anodizing. During alkaline cleaning, lots of gas was emitted from alloy, and the alloy surface was covered with black smuts after alkaline cleaning, which may be metal oxides or hydroxides, such as silicon dust and copper dust. The smuts were completely removed during chemical polishing. After chemical polishing, a thin layer with cuprous color formed on the alloy surface, probably due to leaching of copper from the surface of the alloy. This layer was easily removed by deionized water stream. After chemical polishing, deoxidizing process was performed. The surface treated alloy was chemically analyzed to ensure that the chemical composition of the alloy remained unchanged during chemical polishing. Table 3 lists the bulk chemical composition of the alloy after surface treatment, resulted from OES technique. It can be seen that there is no evident change in the bulk chemical composition of the alloy.
Table 3 Chemical composition of 2024-T3 aluminum alloy after surface treatment (mass fraction, %)
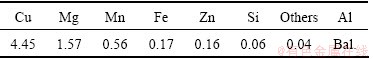
Figure 2(a) shows the SEM micrograph of the alloy after surface treatment. The EDS analysis of the surface reveals that no other element is present on the alloy surface except aluminum, as can be seen in Fig. 2(b).
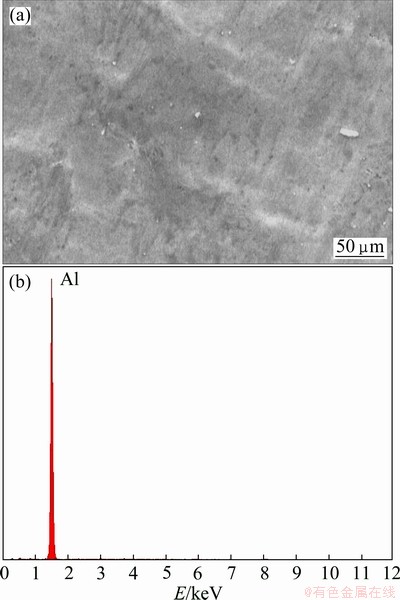
Fig. 2 SEM micrograph (a) and EDS analysis (b) of 2024-T3 aluminum alloy after surface treatment
It should be noted that copper can exist in two valence states of Cu+ and Cu2+, thus possibly permitting electron switching. Its presence in oxide film substantially increases the electronic conductivity of the oxide film [20]. Thus, eliminating copper (or intermetallic phases which contain copper) from the alloy surface before anodizing decreases the probability of the presence of copper in the oxide film.
3.2 EIS study of anodized alloys
The oxide film obtained from sulfuric-boric- phosphoric electrolyte becomes white, uniform and relatively smooth. As stated in the introduction, the anodic oxide film consists of an inner thin barrier layer and a thick outer porous layer. Also, the porous part is composed of pores and walls of hexagonal cells. In order to realize the EIS parameters of the anodic film, barrier and porous layers are separated into two oxide phases and are considered independent of each other. The electronic and dielectric properties of each oxide phase can be realized by an electrical equivalent circuit composed of parallel and series resistances and capacitances. According to the work of HITZIG et al [21], each part of the aluminum oxide film (i. e. pore, barrier layer and wall of hexagonal cells) has both capacitive and resistive behavior and the oxide film can be modeled by a circuit shown in Fig. 3. The curves schematically show the limit of each part including pore, barrier layer and wall of hexagonal cells of aluminum oxide film, which are used to describe the cross section of the aluminum oxide film.

Fig. 3 Electrical equivalent circuit for modeling impedance behavior of anodized aluminum films [21]
Several authors reported that this circuit successfully explained the properties of both oxide parts [22,23]. In this model, RS is the resistance of 3.5% NaCl aqueous solution with the approximate extent of 15 ����cm2; R3 and C3 represent the walls of hexagonal cells and they are eliminated from the circuit because they are extremely high and extremely low, respectively [6]. So the passage of electrical current is prevented through the wall of hexagonal cells and the model is reduced, as shown in Fig. 4.
Thus the EIS parameters concerning anodic oxide films are R1 as porous layer resistance, C1 as porous layer capacitance, R2 as barrier layer resistance and C2 as barrier layer capacitance. Because of the presence of inhomogeneities in barrier and porous layers, their capacitive behavior is better simulated by constant phase elements (CPE) than by a simple capacitance (C) [6]. The use of CPE usually increases the goodness of the fit [24] and in studies of corroding systems, CPE are most often used to describe the frequency dependence of non-ideal capacitive behavior [6]. The impedance of a CPE is given by Eq. (1) [6].
ZCPE =1/(C(j��)n) (1)
where w is the angular frequency, parameter n is frequency dispersion factor which depends on different factors such as surface roughness [6]. The more homogeneous the surface is, the smoother the surface is. Parameter n varies from 1 to 0. When n is equal to 1, parameters C1 and C2 can be considered ideal capacitances.
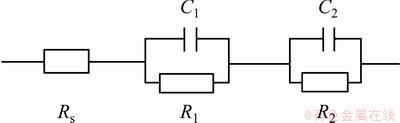
Fig. 4 Simplified model for equivalent circuit shown in Fig. 3 [21]
3.2.1 EIS study of unsealed anodized alloys
The Nyquist plot of unsealed sulfuric-boric- phosphoric acid anodized alloys is shown in Fig. 5. The samples were immersed in 3.5% NaCl aqueous solution for 1, 2, 10, 24 and 48 h.
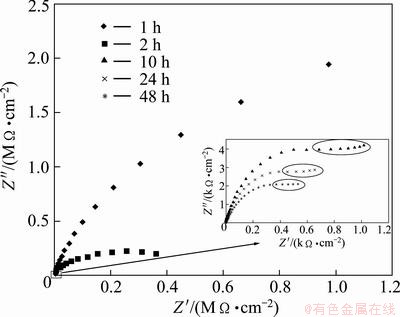
Fig. 5 Nyquist plot of unsealed sulfuric-boric-phosphoric acid anodized alloys for different immersion times
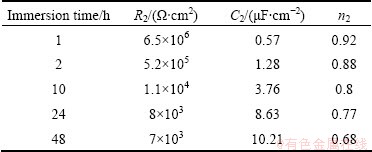
Because of the high conductivity of the electrolyte through pores of the unsealed anodic layers, the porous layer properties could not be detected and one capacitive loop is observed in the low frequency part which corresponds to the characteristics of barrier layer [6]. Therefore, the electrical equivalent circuit of Fig. 4 is reduced, as shown in Fig. 6. The parameters concerning the electrochemical behavior of the unsealed anodic films are R2, C2 and n2, as presented in Table 4.
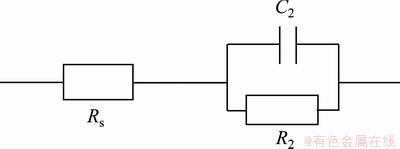
Fig. 6 Equivalent circuit for unsealed anodized films
Table 4 EIS parameters of barrier layer for unsealed anodic film for different immersion times
The capacitance C2 can be connected to the barrier layer thickness d2 by Eq. (2):
C2=��0��rA/d2 (2)
where ��0=8.85��10-14 F/cm is the dielectric constant of vacuum, ��r=10 is the relative constant for alumina [6] and A is the electrode surface area. Equation (2) is acceptable when parameter n is close to 1 [6], namely, the CPE is close to an ideal capacitance like for 1 h of immersion, when the barrier layer is relatively homogeneous. So, the value calculated from Eq. (2) is 15.53 nm for barrier layer formed in sulfuric-boric- phosphoric acids after an hour of immersion in NaCl aqueous solution. Phosphate can enhance the dissolution of the oxide film and then increase the anodizing current obviously in boric acid electrolyte, thus a thick anodic film could be formed on the surface of 2024 aluminum alloy [14]. With immersion time up to 48 h, more electrolytes penetrate through porous layer to attack barrier layer, therefore, the barrier layer will be degraded with immersion time. Indeed, C2 value increases and R2 and n2 values decrease with immersion time as it can be seen from Table 4. After 24 h immersion, C2 values are very high (8.63 and 10.21 ��F/cm2), n2 values are low (0.77 and 0.68) and R2 values are low (8 and 7 k����cm2), indicating the degradation of barrier layer. Indeed, after 24 h immersion, pitting corrosion is seen on the anodized alloy surfaces, and surrounded deformations in Nyqiust plots of Fig. 5 are due to the pit growth on the alloy surface. However, no pitting corrosion was observed on the sample immersed for 10 h, and the surrounded deformation on the related Nyquist plot indicates pit initiation.
Pit initiation and growth on the alloy surface after 10 h immersion means electrolyte penetration through barrier layer and this leads to new parameters and modification of the circuit shown in Fig. 6. In order to show electrolyte penetration through barrier layer, new parameters ��, Rcorr and Cdl are introduced. The parameter �� is the fraction of aluminum surface covered by oxide film; Rcorr is the corrosion resistance of the aluminum substrate, R2 or Rb is the barrier layer resistance and the parameter Cdl corresponds to the double layer capacitance of the substrate. The modified model with these new parameters is presented in Fig. 7.
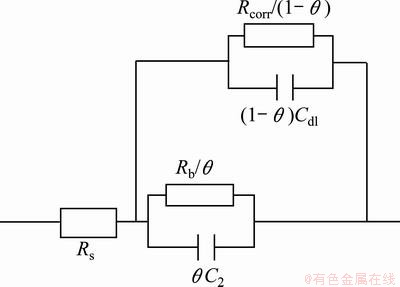
Fig. 7 Equivalent circuit to model electrolyte penetration through unsealed anodic film [6]
When ��=1, barrier layer is not damaged and parameters Rcorr and Cdl do not exist as can be seen in the case of 1 h immersion. With the immersion times up to 48 h, �� decreases, namely, the barrier layer degrades and pits appear after 24 h immersion. Thus, the two capacitive loops appear at low frequencies, part of Fig. 5 are related to R2, C2, Rcorr and Cdl parameters. However, it is difficult to distinguish R2 from Rcorr and C2 from Cdl.
3.2.2 EIS study of sealed anodized alloys
Figure 8 shows the Nyquist plots of sealed sulfuric- boric-phosphoric acids anodized alloys immersed in 3.5% NaCl aqueous solution for 1, 2, 10, 24 and 48 h. Nyquist plots of sealed anodized alloys are characterized by two capacitive loops. Several authors reported that high and medium frequency ranges corresponds to sealed porous layer properties (Fig. 8(a)) and the low frequency range corresponds to barrier layer properties (Fig. 8(b)) [21,25]. In order to visualize both barrier and porous layer spectra (to show both capacitive loops), the Nyquist plot is broken down into two parts.
3.2.2.1 EIS parameters of barrier layer of sealed anodized alloys
The electrochemical impedance spectroscopy parameters of the barrier layer for different immersion times are extracted from Fig. 8(b) and are reported in Table 5.
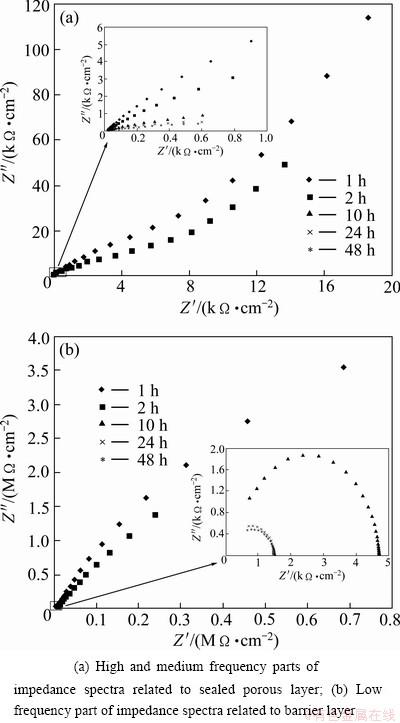
Fig. 8 Nyquist plots of sealed sulfuric-boric-phosphoric acids anodized alloys immersed in 3.5% NaCl aqueous solution for 1, 2, 10, 24 and 48 h
Table 5 EIS parameters of barrier layer for sealed anodized alloys for different immersion time
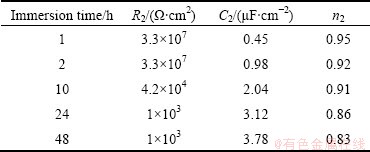
The thickness calculated from Eq. (2) is 19.67 nm for barrier layer formed in sulfuric-boric-phosphoric acids after sealing in boiling water and after 1 h immersion in NaCl aqueous solution. This thickness is higher than that of the barrier layer of the unsealed anodized alloy (15.53 nm). Also, comprising Tables 4 and 5, Figs. 5 and 8, it is revealed that sealed anodized film shows lower values for C2 and higher values for R2 than the unsealed ones. This indicates that sealing treatment has modified the barrier layer properties. Sealing consists of a general reduction of sectional area of each pore with the formation of a ����plug���� in the pore bottom [6], which improves the oxide resistance against electrolyte penetration, therefore, the R2 values are higher for sealed layers. Also sealing process increases the barrier layer thickness, and according to Eq. (2), higher thickness of the oxide layer leads to lower value of C2. The decrease in n2 values with exposure time for both sealed and unsealed layers is related to the formation of flaws by electrolyte penetration which increases the heterogeneity of the oxide film. It is obvious from Tables 5 and 6 that n2 values are higher for sealed anodic layers due to plugging the barrier layer flaws by sealing treatment, which increases the homogeneity.
Figure 9 shows the variation of R2 with immersion time for barrier layer. The parameter R2 is determined from the high and medium frequency parts of Fig .8.
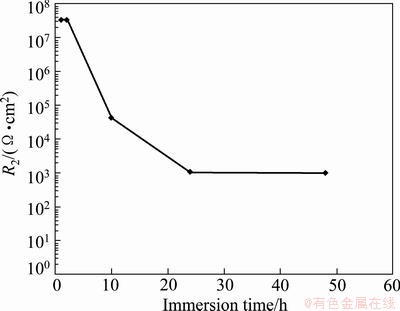
Fig. 9 Variation of R2 with immersion time for barrier layer of sealed anodized film
3.2.2.2 EIS parameters of porous layer of sealed anodized alloys
The electrochemical impedance spectroscopy parameters of the porous layer for sealed anodized films at different immersion times are extracted from Fig. 8(a) and reported in Table 6.
Table 6 EIS parameters of porous layer for sealed anodized alloy at different immersion time
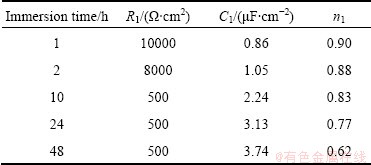
Parameter C1 in Table 6 is related to the capacitive behavior of the sealed pores. C1 depends on the oxide film roughness, but not on the oxide film thickness [6]. In this case, at 1 h immersion, the value of n2 is far from 1, which means that the heterogeneity of porous layer is important. Porous layers can be contaminated by alloying elements from substrate and from sulphate ions of sulfuric acid electrolyte [6] which affects their homogeneity. Figure 10 shows the variation of R1 with immersion time for porous layer. Parameter R1 is determined from the high frequencies part of Fig. 8.
By considering Figs. 9 and 10, it can be seen that the barrier layer resistance is higher than the associate porous layer resistance, which means that barrier layer is a much better resistor than its associate porous layer with sealed pores, which shows easier electrolyte penetration through porous layer. This can be due to the presence of the pores in the porous layer microstructure which leads to higher conductivity of this layer than barrier layer, namely, pores cause easier electrolyte penetration through porous layer and this phenomenon can increase the conductivity of the film, which results in lower values of resistance R1 than R2.
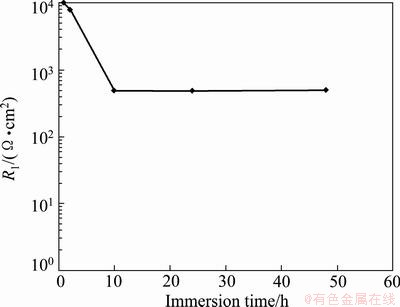
Fig. 10 Variation of R1 with immersion time for porous layer of sealed anodized film
3.2.2.3 Immersion of sealed anodized alloys in NaCl aqueous solution from 1 to 48 h
It is obvious from Table 5 that at 1 h immersion, the resistance R2 for sealed anodized film is the highest for the barrier layer with value of 3.3��107 ����cm2 and the capacity of C2 is the lowest with the value of 0.45 ��F/cm2. Also, from Table 6 it can be seen that at 1 h immersion, the resistance R1 is the highest for porous layer with the value of 104 ����cm2 and the capacity of C1 is the lowest with the value of 0.86 ��F/cm2. Anodic oxide films with relatively lower values of capacity and relatively higher values of resistance are more corrosion resistant at 1 h immersion.
With exposure time up to 48 h, the penetration of electrolyte through the oxide film results in increasing C values and decreasing R values for both barrier and porous layers, as it can be seen in Tables 5 and 6. Also, n value decreases with immersion time, which shows increasement in the heterogeneity of the oxide layer due to electrolyte penetration.
Figure 11 compares the evolution of C1 and C2 with immersion time. It is obvious that in the first 10 h, the increasing rate of C2 is slower than the increasing rate of C1 and then the increasing rates of C1 and C2 are almost the same up to 48 h immersion. Indeed, barrier layer remains a better capacitor than porous layer in the first 10 h immersion.
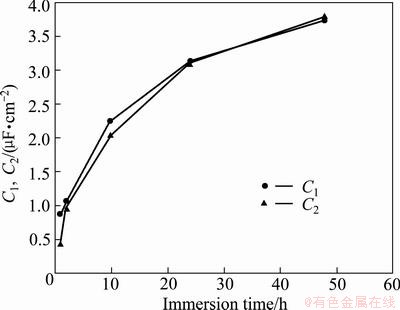
Fig. 11 Evolution of C1 and C2 with immersion time
Figure 12 compares the evolution of n1 and n2 values with time. It is obvious that decreasing rate of n2 is slower than the decreasing rate of n1, which means after 48 h immersion, the barrier layer reserves its homogeneity more than its associate porous layer with sealed pores.
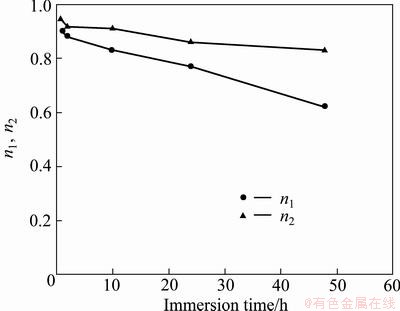
Fig. 12 Evolution of n1 and n2 with immersion time
Generally, it can be concluded that the barrier layer has more corrosion resistance than its associate sealed porous layer because the electrolyte penetration is weaker through the barrier layer. Again, in order to symbolize the electrolyte penetration through the oxide film, parameters ��, Rcorr and Cdl (Rcorr and Cdl are introduced as corrosion parameters) must be introduced for immersion time from 2 to 48 h and the model of Fig. 5 is modified as the model shown in Fig. 13 [6]. As no pits were observed on the oxide surface after 48 h immersion and the oxide surface was not damaged. It can be concluded that the anodized alloy indicates good corrosion resistance and the parameter �� is close to 1 but not close to 0. Thus, Rcorr and Cdl are undetectable.

Fig. 13 Equivalent circuit to model electrolyte penetration through sealed anodic film [6]
3.3 Tafel plot and salt spray tests
The results of Tafel plot for sulfuric-boric- phosphoric acids, sulfuric-boric acids and phosphoric acid anodic films are shown in Fig. 14.
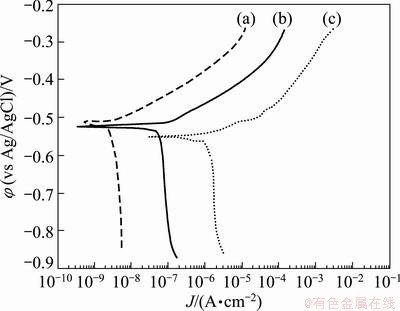
Fig. 14 Tafel plots of sulfuric-boric-phosphoric acids anodized alloy (a), sulfuric-boric acids anodized alloy (b) and phosphoric acid anodized alloy (c)
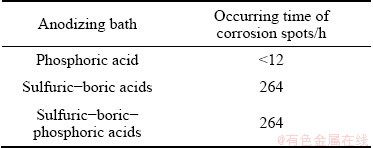
It can be seen from Fig. 14 that the current density of anodic films increases in the order as sulfuric-boric- phosphoric acids anodic film < sulfuric-boric acids anodic film < phosphoric acid anodic film. The results indicate that sulfuric-boric-phosphoric acids anodic film reveals better corrosion resistance in comparison with the anodic oxide films obtained from sulfuric-boric acids and phosphoric acid electrolytes. Furthermore, the results of the salt spray test are reported in Table 7. The corrosion resistance of the investigated materials was studied during salt spray technique by monitoring the occurring time of corroded spots on the samples. The results of salt spray test are in good agreement with the results obtained by Tafel plot. It is seen that after 264 h holding time, some small etching pits appear on the surface of the sulfuric-boric-phosphoric acids anodized alloy, indicating a good corrosion resistance due to the relatively high thickness of the oxide film (19.67 nm for barrier layer). It is obvious that the oxide layers with relatively higher thickness have relatively higher resistance against electrolyte penetration. By considering the data reported in Table 7, it can be seen that the corrosion resistance of sulfuric-boric acids anodized alloy is similar to sulfuric-boric-phosphoric acids anodized alloy but visual inspection shows that more etching pits appear on the surface of the sulfuric-boric acids oxide film after 264 h. Severe corrosion happens on the surface of phosphoric acid anodized alloy for only less than 12 h.
Table 7 Results of salt spray tests for anodized samples
4 Conclusions
1) The anodizing process of 2024-T3 aluminum alloy was performed in 10% sulfuric acid bath containing 5% boric acid and 2% phosphoric acid, as a new electrolyte, followed by sealing treatment.
2) The porous layers electrochemical parameters were detected by sealing. The corrosion performance of the anodic layer was studied by EIS technique in 3.5% NaCl solution. The EIS technique was used to study the corrosion behavior of the anodized alloy.
3) The electrolyte penetrats weaker through the barrier layer than the porous layer. Therefore, the evolution of electrochemical parameters of the barrier layer is slower than the electrochemical parameters of the porous layer with exposure time, indicating that the barrier layer has more corrosion resistance than its associate sealed porous layer.
4) The anodizing in mixed acid followed by sealing treatment improves the corrosion resistance of the 2024-T3 alloy.
5) The results of Tafel plot and salt spray tests are in good agreement, indicating that the sulfuric-boric- phosphoric acids anodized alloy has better corrosion resistance than sulfuric-boric acids and phosphoric acid anodized alloys.
References
[1] PARKHUTIK V P, SHERSHULSKY V I. Theoretical modelling of porous oxide growth on aluminium [J]. Applied Physics, 1992, 25(8): 1258-1263.
[2] MOUTARLIER V, GIGANDET M P, PAGETTI J, NORMAND B. An electrochemical approach to the anodic oxidation of Al 2024 alloy in sulfuric acid containing inhibitors [J]. Surface and Coatings Technology, 2002, 161(2-3): 267-274.
[3] ZUO Y, ZHAO P H, ZHAO J M. The influences of sealing methods on corrosion behavior of anodized aluminum alloys in NaCl solutions [J]. Surface and Coatings Technology, 2003, 166(2-3): 237�C242.
[4] HUANG Y, SHIH H, HUANG H, DAUGHERTY J, WUB S, RAMANATHAN S, CHANG C, MANSFELD F. Evaluation of the corrosion resistance of anodized aluminum 6061 using electrochemical impedance spectroscopy (EIS) [J]. Corrosion Science, 2008, 50(12): 3569�C3575.
[5] LI Song-mei, ZHANG Hong-rui, LIU Jian-hua. Corrosion behavior of aluminum alloy 2024-T3 by 8-hydroxy-quinoline and its derivative in 3.5% chloride solution [J]. Transactions of Nonferrous Metals Society of China, 2007, 17(2): 318-325.
[6] MOUTARLIER V, GIGANDET M P, NORMAND B, PAGETTI J. EIS characterisation of anodic films formed on 2024 aluminium alloy in sulphuric acid containing molybdate or permanganate species [J]. Corrosion Science, 2005, 47(4): 937-951.
[7] ZHANG J S, ZHAO X H, ZUO Y, XIONG J P. The bonding strength and corrosion resistance of aluminum alloy by anodizing treatment in a phosphoric acid modified boric acid/sulfuric acid bath [J]. Surface and Coatings Technology, 2008, 202(14): 3149-3156.
[8] THOMPSON G E, ZHANG L, SMITH C J E, SKELDON P. Boric/sulfuric acid anodizing of aluminum alloys 2024 and 7075: Film growth and corrosion resistance [J]. Corrosion Science, 1999, 55(11): 1052-1061.
[9] EICHINGER E, OSBORNE J, van CLEAVE T. Hexavalent chromium elimination: An aerospace industry progress report [J]. Metal Finishing, 1997, 95(3): 36,38,40-41.
[10] COHEN S M. Replacements for chromium pretreatments on aluminum [J]. Corrosion, 1995, 51(1): 71-78.
[11] GHALI E. Corrosion resistance of aluminum and magnesium alloys: Understanding, performance, and testing [M]. New Jersey: John Wiley & Sons, 2010: 180.
[12] VENUGOPAL A, PANDA R, MANWATKAR S, SREEKUMAR K, KRISHNA L R, SUNDARARAJAN G. Effect of micro arc oxidation treatment on localized corrosion behaviour of AA7075 aluminum alloy in 3.5% NaCl solution [J]. Transactions of Nonferrous Metals Society of China, 2012, 22(3): 700-710.
[13] SON I J, NAKANO H, OUE S, KOBAYASHI S, FUKUSHIMA H, HORITA Z. Effect of equal-channel angular pressing on pitting corrosion resistance of anodized aluminum-copper alloy [J]. Transactions of Nonferrous Metals Society of China, 2009, 19(4): 904-908.
[14] MA Song-jiang, LUO Peng, ZHOU Hai-hui, FU Chao-peng, KUANG Ya-fei. Preparation of anodic films on 2024 aluminum alloy in boric acid-containing mixed electrolyte [J]. Transactions of Nonferrous Metals Society of China, 2008, 18(4): 825-830.
[15] HELLER D K, FAHRENHOLTZ W G, O��KEEFE M J. The effect of post-treatment time and temperature on cerium-based conversion coatings on Al 2024-T3 [J]. Corrosion Science, 2010, 52(2): 360-368.
[16] ASTM B457: Standard test method for measurement of impedance of anodic coaings on aluminum [S]. USA: ASTM Standards, 2003.
[17] ASTM B117: Standard practice for operating salt spray (fog) apparatus [S]. USA: ASTM Standards, 2007.
[18] WEI R P, LIAO C M, GAO M. A transmission electron microscopy study of constituent-particle-induced corrosion in 7075-T6 and 2024-T3 aluminum alloys [J]. Metallurgical and Materials Transactions A, 1998, 29(4): 1153�C1160.
[19] CAMPESTRINI P, Van WESTING E P M, ROOIJEN H W, de WIT J H W. Relation between microstructural aspects of Al 2024 and its corrosion behaviour investigated using AFM scanning potential technique [J]. Corrosion Science, 2000, 42(11): 1853-1861.
[20] CROSSLAND A C, HABAZAKI H, SHUMIZU K, SKELDON P, THOMPSON G E, WOOD G C, ZHOU X, SMITH C J E. Residual flaws due to formation of oxygen bubbles in anodic alumina [J]. Corrosion Science, 1999, 41(10): 1945-1954.
[21] HITZIG J, JUNTTNER K, LORENTZ W J. AC-impedance measurements on corroded porous aluminum oxide films [J]. Electrochemical Society, 1986, 133(5): 887-892.
[22] DASQUET J P C, CAILLARD D, CONFORTO E, BONINO J P, BES R. Investigation of the anodic oxide layer on 1050 and 2024-T3 aluminium alloys by electron microscopy and electrochemical impedance spectroscopy [J]. Thin Solid Films, 2000, 371(1-2): 183-190.
[23] SOGNAN F, BLANC C, MANKOWSKI G, PEBERE N. Characterization of sealed anodic films on 7050 T74 and 2214 T6 aluminium alloys [J]. Surface and Coatings Technology, 2002, 154(1): 94-103.
[24] HSU C H, MANSFELD F. Technical note: Concerning the conversion of the constant phase element parameter Y0 into a capacitance [J]. Corrosion, 2001, 57(9): 747-748.
[25] SUAY J J, GIMENEZ E, RODRIGUEZ T, HABBIB K, SAURA J J. Characterization of anodized and sealed aluminum by EIS [J]. Corrosion Science, 2003, 45(3): 611-624.
M. SAEEDIKHANI, M. JAVIDI, A. YAZDANI
Department of Materials science and Engineering, School of Engineering, Shiraz University, Shiraz 7134851154, Iran
ժ Ҫ���ں���10%���ᡢ5%�����2%����Ļ�ϵ��Һ�У���2024-T3���Ͻ���������������������������ʴ���ܡ�ʹ�õ绯ѧ�迹Ƶ�����о���������������Ͻ�ĸ�ʴ��Ϊ���������ƶ�ͼ����ˮ�����������жԱȷ��֣���ֻ����������������ĵ��Һ��ȣ�ʹ�ú���10%���ᡢ5%�����2%����Ļ�ϵ��Һ���������������2024-T3���Ͻ𣬾��и��õ���ʴ�Ժͳ־��ԡ��õ��Һ��������ձ����������������Ͻ�ĸ�����ԡ��
�ؼ��ʣ�����������2024-T3���Ͻ𣻻�ϵ��Һ��EIS
(Edited by Jing-hua FANG)
Corresponding author: M. JAVIDI; Tel: +98-711-6133266; Fax: +98-711-2307293; E-mail: mjavidi@yahoo.com
DOI: 10.1016/S1003-6326(13)62767-3

