煤堆图像分割与特征提取
张泽琳,杨建国,苏晓兰
(中国矿业大学 国家煤加工与洁净化工程技术研究中心,江苏 徐州,221116)
摘要:基于煤堆图像分割存在重叠煤粒的边缘错综复杂、不易检测的问题,通过多种图像增强和边缘检测方法的效果对比,提出一种将对比度受限自适应直方图均衡法(CLAHE)和SUSAN边缘检测算法相结合的方法来检测煤堆图像中的煤粒边缘,并利用数学形态学和孔洞填充算法得到最佳种子区域,有效防止分水岭算法的过分割和欠分割现象,最后统计并分析煤粒分割区域10个特征参数的分布情况,包含了煤粒数量、大小、形状、颜色和纹理特征。研究结果表明:通过这些特征参数可以预测相关煤质信息,利于实现自动控制煤炭的分选。
关键词:图像增强;图像分割;边缘检测;特征提取
中图分类号:TD94 文献标志码:A 文章编号:1672-7207(2014)06-1900-08
Feature extraction based on image segmentation of coal pile images
ZHANG Zelin, YANG Jianguo, SU Xiaolan
(National Engineering Research Center of Coal Preparation and Purification,
China University of Mining and Technology, Xuzhou 221116, China)
Abstract: Considering the complicated edges and difficult detection of overlap coal particle in the image segmentation of coal piles, several image enhancement and edge detection methods were contrasted. An algorithm combined with contrast limited local histogram equalization (CLAHE) and SUSAN edge detection was used to detect the edges of coal particles. Mathematical morphology and filling algorithm were used to obtain the best seed regions, which was able to prevent over-segmentation and under-segmentation effectively. Finally ten features’ distribution of coal segmentation regions, including features of coal number, size, shape, color and texture, were calculated and analyzed. The results show that the related coal quality information can be predicted using these features, which will be of great importance in automatic control of coal preparation.
Key words: image enhancement; image segmentation; edge detection; feature extraction
中国是以煤炭为主要能源的国家, 在全部一次能源消费的构成中煤炭占70%。中国与煤炭有关的行业数量是世界上主要产煤国中最多、最全的,主要用于发电、冶金、建材、化工、工业炉窑、炭素、民用等很多行业。中国煤炭资源的分布遍及全国28个省区,煤种分类包括褐煤、烟煤、无烟煤等所有品种;中国煤炭洗选从极易选到极难选都有,这决定了中国煤炭洗选规模的庞大和工艺的多样化,同时也对选煤技术及工艺提出了更高要求[1]。近10年来,依靠数字图像处理进行矿业方面软测量的研究逐渐增多,主要集中在各种矿石的粒度分析、品位分析和类别分析这3个方面[2-4],而煤炭行业则主要集中在浮选泡沫图像分 析[5]。在对矿石进行图像分析的过程中,重叠矿石的边缘检测和分割是需首要解决的难题,目前国外已有一些商业图像处理系统用于矿业生产领域的粒度分布检测,SPLIT是应用较多的一款矿业领域商业图像系统,它的图像分割算法步骤大致为灰度图均衡化、Sobel边缘检测、使用阈值进行二值图像的转化、距离变换和分水岭分割,最后计算最合适椭圆长短轴来估计目标区域粒度[6]。WIPFRAG商业图像系统中的矿石分割算法步骤大致为阈值分割、梯度边缘检测、边缘重建技术,还增加了人工编辑功能,最后计算目标区域的等圆直径来估计粒度分布[7]。然而,在煤炭行业几乎都集中于浮选泡沫图像系统,其分割步骤主要为灰度图像的增强处理、阈值处理、边缘检测、种子区域确定和分水岭分割、数字形态学校正、区域合并等方法的组合[5]。目前,国外商业图像系统大部分应用于矿石的粒度分布实时估计,但应用于煤炭行业的几乎未见报道,其主要原因在于煤与其他矿石相比较,表面纹理更复杂,煤粒之间对比度不明显,不易进行边缘检测和区域分割。为了将数字图像处理技术更广泛地应用于煤炭行业,必须寻找出一种适合于煤堆图像的分割算法,有效地分割出煤粒区域才能提取特征参数,并预测相关煤质信息。为此,本文作者提出一种煤堆边缘检测算法,利用分水岭算法分割出目标区域,通过最小矩形截取算法,提取煤粒数量、大小、形状、颜色和纹理特征参数。
1 图像增强
在数字图像处理中,直方图是一种简单而且有用的工具,任何一幅图像都包含可观的信息,某些类型的图像甚至可由其直方图完全描述。直方图均衡化(HE)的基本思想是更改原始图像像素的灰度,每个灰度值代表1个灰度级,灰度图像拥有256个灰度级。对在图像中像素个数多的灰度级进行拓宽,而对像素个数少的灰度级进行缩减,使图像对应的直方图变换为均匀分布的形式,从而增强图像的整体对比度,达到使图像清晰的目的。此时,图像的熵最大,图像所包含的信息量最大[8]。
直方图均衡简单、高效,但是,图像中不同的区域的灰度分布相差甚远,对它们使用同一种变换常常产生不理想的结果。在实际应用中,常常需要增强图像的某些局部区域的细节。为了解决这类问题,Pizer等[9]提出了局部直方图均衡化的方法(LAHE)。LAHE采用一个滑动窗口,先统计该窗口的直方图,再对这个局部直方图均衡化,以增强窗口中心像素的灰度级。窗口从左到右,从上到下移动,增强整幅图像的灰度[5]。但是,在相关领域固定的情况下,在LAHE算法中,图像中的某个像素的局部直方图就是以这个像素为中心的1个矩形窗的局部直方图。它仅仅考虑了局部区域内的像素,而忽略了图像其他区域的像素,而人的视觉是随着相关区域的改变而改变的。Pizer 等[9]提出一种有约束的局部直方图构造法(CLAHE),通过限制局部直方图的高度来限制局部对比度的增强幅度,从而限制噪声的放大及局部对比度的过增强。
对比度增强的幅度可定义为灰阶映射函数的斜率。假定自适应直方图均衡方法的滑动窗口的大小为M×M,则局部映射函数为
 (1)
(1)
CDF(i)为滑动窗口局部直方图的累积分布函数。累积分布函数CDF(i)的导数为直方图Hist(i),从而局部映射函数m(i)的斜率S为
 (2)
(2)
因此,限制直方图高度就等效于限制映射函数m(i)的斜率S,进而限制对比增强度。若限定最大斜率为Smax,则允许的最大直方图高度为
 (3)
(3)
从而,对于高度大于Hmax的直方图应截去多余的那部分,如图1所示。由图1可知:实际上是从阈值T(而非Hmax)处对直方图进行截断,然后将截去的部分均匀地分布在整个灰阶范围上,以保证总的直方图面积不变,从而使整个直方图上升高度L。Hmax,T和L三者之间应满足下列关系:
 (4)
(4)
最后改进的直方图为
 (5)
(5)
通过改变最大的映射函数斜率Smax及相应的最大直方图高度Hmax,便可获得不同增强效果的图像。CLAHE通过限制局部直方图的高度来限制局部对比度的增强幅度,从而限制噪声的放大及局部对比度的过增强。
对煤堆灰度图像进行全局直方图和CLAHE仿真,结果如图2所示。通过全局直方图均衡后(图2(b)),图2(a)的中间部分明显增强,主要灰度范围从原来的70~180(图2(d))扩展到0~255(图2(e))。但是,靠近边缘的区域颗粒间的对比度都普遍降低,甚至变得模糊。图2(c)所示是采用对比度受限的局部直方图均衡法处理结果,与HE相比,整个图像的对比度明显增强,其直方图如图2(f)所示。

图1 CLAHE原理示意图
Fig. 1 Principle diagram of CLAHE

图2 煤堆灰度图像经HE和CLAHE处理后的效果对比
Fig. 2 Comparisons of gray images of coal by HE and CLAHE
2 SUSAN算子及边缘检测算法对比
SUSAN算子的模板和常规卷积算法的正方形模板不同,它使用一种近似圆形的模板。图3(a)中,a~e这5个位置分别是5个圆形的模板在图像中不同的位置,窗口的中心被称为“核”。用圆形模板在图像上移动,模板内部每个图像像素点的灰度都与模板中心像素的灰度进行比较,若模板内某个像素的灰度与模板中心像素(核)灰度的差值小于一定值,则认为该点与核具有相同(或相近)的灰度。由满足这样条件的像素组成的区域称为吸收核同值区(univalue segment assimilating nucleus, USAN)[10]。当圆形模板完全在背景中或完全在目标中时,USAN区面积最大;而当模板移向目标边缘时,其USAN区面积逐渐减小;当圆心处在目标边缘时,USAN区面积很小,当圆心在目标角点处时,USAN区面积最小。将图像每点上的USAN区面积作为该处特征的显著性度量,USAN区面积越小的点特征越显著。该方法可用于一次性快速检测出角点、交点、边缘点,而且无方向性[11]。
SUSAN算法原则上采用圆形模板,其目的是使检测达到各向同性。然而,在实际运用中,由于图像的数字化,实际上无法实现真正的圆形模板,往往采用近似圆代替。本文模板是1个圆形结构元,半径为3个像素,共由37个像素组成,如图3(b)所示。模板中心像素是标号为19的点。用这个圆形模板扫描整个图像,模板内部的每个像素的灰度与模板中心像素的灰度进行比较,并且给定阈值以确定像素是否属于USAN区域,判断方法为
 (6)
(6)
式中: 为用于判断模板中的像素是否属于USAN的判别函数;
 为模板中心点,就是图3(b)中标号为19的点;
 为模板内部用来与中心点作比较的点;
 为模板内部像素的灰度;
 为模板中心像素的灰度;t为灰度差阈值,需要根据实际情况设定,一般取25。
通过式(7)就可以判断模板内部每一个像素是否属于USAN。USAN的大小可以用下式求得:
 (7)
(7)
其中: 表示以为圆心的模板USAN的面积(就是模板内部为1的点数)。再利用式(8)产生USAN特征图像:
 (8)
(8)
其中:g为几何门限,在进行图像的边缘信息提取时,g的取值要大一些,一般设定为3nmax/4(其中,nmax为n能取得的最大值,本文中n为37,所以g设为27); 表示图像的边缘响应,USAN区域的面积越小,则边缘响应就越大。
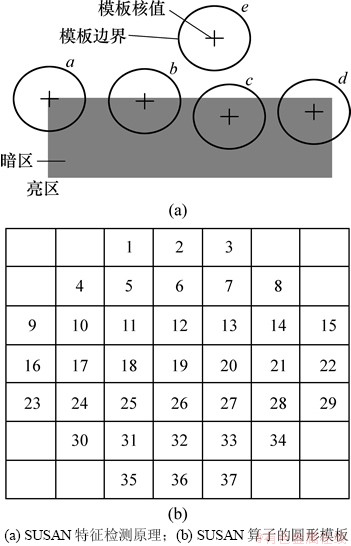
图3 SUSAN特征检测原理和SUSAN算子的圆形模板
Fig. 3 Principle diagram of SUSAN and circle pattern of SUSAN
SUSAN检测有一个突出的优点,就是对局部噪声不敏感、抗噪能力强。这是由于USAN特征检测原则不依赖于前期图像分割的结果,并避免了梯度计算。
对CLAHE处理后的煤堆图像进行边缘检测算法效果对比分析,传统边缘算法包括Roberts算子、Sobel算子、Prewitt算子和Canny算子[12]。图4所示为上述4种边缘检测算子和SUSAN算子处理后的煤堆边缘检测效果图。从图4可以看出:Roberts算子对煤粒的边缘检测效果最差(图4(a)),几乎没有封闭的区域;Sobel算子和Prewitt算子效果一般(图4(b)和4(c)),但零碎杂乱的边缘太多,后续处理十分困难;Canny算子得到的是单像素边缘检测图像(图4(d)),虽然检测效果比Roberts算子、Sobel算子和Prewitt算子的好,但很多区域边缘线仍没有封闭,导致很多区域无法分割提取;图4(e)所示为SUSAN边缘检测效果图,边缘为黑色,目标区域为白色,各煤粒区域边缘检测效果非常好,不仅可以检测不同宽度的煤粒边缘,而且还能检测出煤粒的核心区域。

图4 5种边缘检测算法效果对比
Fig. 4 Comparisons of five edge detecting algorithms
3 分水岭分割与最小矩形截取
分水岭算法是模拟自底向上逐渐淹没地形过程的形象理解。首先设想此地形中的最低区域(种子区域) 即盆地, 当水从盆地底不断地浸入其中, 则该地形由谷底向上将逐渐地被淹没;当2个集水盆地的水将要汇合时, 可在汇合处建立堤坝,直到整个地形都被淹没, 从而就得到了各个堤坝(分水岭) 和一个个被堤坝分开的盆地(目标物体)。分水岭算法的优点在于它可以得到单一像素宽度的连续的边界, 能检测出图像中粘连物体的微弱边缘。
要获得较好的分水岭分割效果,一般先获得最佳的种子区域。从图4(e)可以看出:虽然各煤粒区域已经分割较好,但部分煤粒区域仍粘连在一起,区域内部也存在许多空洞,区域外部还有很多像素杂点。为了获得较好的煤粒种子区域,可以结合数学形态学算法和孔洞填充算法去除像素杂点、平滑目标区域边缘和填充目标区域内部空洞。首先采用圆盘结构对图4(e)进行数学形态学开运算[12],去除杂点像素并平滑目标区域边缘,圆盘结构可由杂点去除效果来确定,然后对各煤粒区域进行孔洞填充操作,得到较好的煤堆种子区域,可最大限度地降低分水岭算法的过分割和欠分割现象[5]。图5(a)所示为煤堆图像分水岭过分割效果图,主要原因在于SUSAN边缘检测后煤堆图像中种子区域有孔洞,还有种子区域之间有杂点像素。图5(b)所示为煤堆图像分水岭欠分割效果图,主要原因在于使用不当的数学形态学操作后,导致2个或2个以上的种子区域粘连到一起,使得分水岭分割后2个或2个以上煤粒区域分割为1个煤粒区域。图5(c)所示为分水岭算法结合较好种子区域所得的分割结果。
通过分水岭分割结果即可计算各分割区域的面积、形状和颜色特征,但是,为了实现后续的煤粒表面纹理特征提取,必须实现单个煤粒区域的提取。图形的存储和计算是以矩阵的形式进行的,所以,各煤粒RGB彩色区域的提取必须以矩形的方式进行截取。垂直方向外接矩形截取是最常用的一种目标区域截取方法,如图6(a)所示。其存在2个缺点:一是对于不同方向的同一目标区域,其外接矩形是不同的;二是截取后的外接矩形区域中背景区域所占比例较大。这2个缺点对于目标区域的纹理特征提取会产生一定的影响。而最小外接矩形(MER)是一种具有旋转不变性的目标区域截取方法,将图像在90°之内等角度间隔地旋转,每次记录其坐标系方向上的外接矩形顶点坐标,取其面积为最小的矩形,记录其坐标并截取,最小外接矩形不会随目标区域的方向不同而改变,并且其截取后的外接矩形区域中背景区域所占比例是最小的[13],其截取步骤为:

图5 分水岭欠分割、过分割、最佳分割和部分分割区域最小矩形截取
Fig. 5 Under-segmentation, over-segmentation and best-segmentation of watershed, and smallest rectangle interception of several segmented regions

图6 分割区域垂直外接矩形截取和最小矩形截取
Fig. 6 Vertical bounding rectangle and smallest rectangle interception of segmented regions
(1) 将图像边缘点绕该目标区域形心点旋转,每次逆时针旋转3°。
(2) 计算每旋转3°后的最大横坐标Xmax、最小横坐标Xmin和最大纵坐标Ymax、最小纵坐标Ymin,则可求出图像的外接矩形的面积为:S=|Xmax-Xmin|×|Ymax-Ymin|。
(3) 再旋转3°,重复执行步骤(1)和(2),直到旋转角度达到90°时停止。
(4) 在所有的图像边缘外接矩形面积中,计算面积S最小时对应的逆时针旋转角度θ,如图6(b)所示,其中煤粒区域外接矩形即为最小外接矩形。
(5) 煤粒区域在逆时针旋转角度θ后,在水平垂直方向上截取其外接矩形即为最小外接矩形截取区域,如图6(c)所示,此时其黑色背景区域面积是最小的。
4 煤堆分割图像特征提取
煤堆分割图像特征包括煤粒区域的数量、大小、形状、颜色和纹理特征。大小特征包括煤粒区域的面积、周长、等圆直径、最小矩形长和宽等等,通过比例换算后即可计算出煤粒实际大小特征[14];形状特征包括煤粒区域的圆形度[5];颜色特征包括煤粒区域红、绿、蓝分量和色度、饱和度、亮度分量,另外还有灰度分布等[15];纹理特征包括灰度共生矩阵纹理特征和Tamura纹理特征等[15]。煤堆分割区域的数量、大小和形状的变化可以反映煤堆的粒度组成,而颜色和纹理特征可以反映煤堆的密度组成和灰分变化等等煤质信息。通过对它们进行监测,可以测量、控制和优化煤炭分选过程,从而降低煤炭分选成本和提高煤炭分选效率。
通过分水岭分割后的煤粒区域都经过了标记,同一分割区域的像素点都赋予同一标记号,为目标区域的后续处理提供了方便。本文针对图5(c)所示的煤堆图像分割结果,对各分割区域的数量、大小、形状、颜色和纹理特征进行部分统计分析,包括数量、面积、周长、最小矩形长和宽、圆形度、R分量分布、灰度分布、灰度共生矩阵纹理特征中的能量分布和对比度分布。根据各分割区域的标记,可统计出图5(c)中煤粒区域总个数为414;分割区域的面积即为分割区域内的像素数目;分割区域的周长即为分割区域周边的像素数目;最小矩形长和宽可根据4个顶点坐标计算得出;圆形度表示目标物体接近圆形的程度,R=4πS/L2(其中,S为面积,L为周长;R分量分布即为各RGB彩色分割区域中R分量的均值分布);灰度分布即为各分割区域灰度均值分布;能量为灰度共生矩阵元素值的平方和,反映了图像灰度分布均匀程度和纹理粗细度;对比度反映了图像的清晰度和纹理沟纹深浅的程度;能量和对比度的详细计算见文献[16]。图7所示为分割区域各表面特征的分布图,X轴为各特征参数,Y轴为频率(分割区域在对应横截面积内出现的次数)。从图7可以分析出煤堆图像中各特征的分布趋势,面积分布图表明煤粒面积主要集中于300~500像素,2 000像素以上煤粒几乎没有;周长分布与面积分布规律相似,主要集中于30~100像素;最小矩形宽分布和长分布可以从侧面反映煤粒粒度分布;圆形度分布表明煤粒接近圆形的程度较高;煤粒表面R分量分布和灰度分布主要集中于70~100;能量分布主要集中于0.15~0.30;对比度分布主要集中于1~2。

图7 分割区域各表面特征参数分布图
Fig. 7 Each feature distribution of segmented regions
5 结论
(1) 使用全局直方图均衡法(HE)和对比度受限自适应直方图均衡法(CLAHE)对煤堆灰度图进行图像增强,发现HE均衡法对图像中间部分有明显增强,但是靠近图像边缘的区域对比度都普遍降低,甚至变得模糊,反而CLAHE均衡法使得整个煤堆灰度图的对比度明显增强,有利于对后续煤堆图像的边缘检测。
(2) 通过对比SUSAN算子与4种经典边缘检测算子(Roberts算子、Sobel算子、Prewitt算子、Canny算子)的边缘检测效果,发现Roberts算子边缘检测效果最差;Sobel算子和Prewitt算子效果一般;Canny算子边界错综复杂,无用边缘太多;SUSAN边缘检测算子效果最好,可以明显地识别出各煤粒区域。
(3) 利用数学形态学和孔洞填充算法得到最佳的种子区域,并进行分水岭分割,可有效解决分割过程中的过分割和欠分割问题。
(4) 对分水岭分割后的煤粒区域可计算其数量、大小、形状和颜色特征参数,对各煤粒区域进行最小矩形截取后,即可计算其表面纹理特征参数;本文统计了煤粒区域10个特征参数的分布图,并进行了相关分析。
(5) 下一步工作是结合煤堆图像分割算法和特征参数的提取,对煤堆的煤质信息进行实时预测。
参考文献:
[1] 杨林青, 胡方坤. 我国选煤技术的现状及发展[J]. 煤炭技术, 2010, 29(5): 109-111.
YANG Linqing, HU Fangkun. Current situation and development of China coal preparation technology[J]. Coal Technology, 2010, 29(5): 109-111.
[2] Ko Y D, Shang H. Time delay neural network modeling for particle size in SAG mills[J]. Powder Technology, 2011, 205(3): 250-262.
[3] Claudio A, Pablo A, Estévez A. Ore grade estimation by feature selection and voting using boundary detection in digital image analysis[J]. International Journal of Mineral Processing, 2011, 101(4): 28-36.
[4] Singh V, Rao S. Application of image processing in mineral industry: A case study of ferruginous manganese ores[J]. Mineral Processing and Extractive Metallurgy, 2006, 115(3): 155-160.
[5] 林小竹, 谷莹莹, 赵国庆. 煤泥浮选泡沫图像分割与特征提取[J]. 煤炭学报, 2007, 32(3): 304-308.
LIN Xiaozhu, GU Yingying, ZHAO Guoqing. Feature extraction based on image segmentation of coal flotation froth[J]. Journal of China Coal Society, 2007, 32(3): 304-308.
[6] Kemeny J, Devgan A, Hagaman R, et al. Analysis of rock fragmentation using digital image processing[J]. Journal of Geotechnical Engineering, 1993, 119(7): 1144-1160.
[7] Maerz N H, Palangio T C, Franklin J A. WipFrag image based granulometry system[C]//Proceedings of the FRAGB LAST 5 Workshop on Measurement of Blast Fragmentation. Montreal, Quebec, Canada, 1996: 91-99.
[8] 王龙, 汪天富, 郑昌琼, 等. 基于灰度直方图均衡的超声医学图像增强方法[J]. 四川大学学报, 2002, 34(1): 105-108.
WANG Long, WANG Tianfu, ZHENG Changqiong, et al. Enhancement of medical ultrasonic image based on gray-level histogram equalization[J]. Journal of Sichuan University (Engineering Science Edition), 2002, 34(1): 105-108.
[9] Pizer S M, PAmburn E, Austin J D, et al. Adaptive histogram equalization and its variations[J]. Computer, Vision, Graphics and Image Process, 1987, 39(3): 355-368.
[10] Smith S M, Brady J M. SUSAN: A new approach to low level image processing[J]. Journal of Computer Vision, 1997, 23(1): 45-78.
[11] 马桂珍, 房宗良, 姚宗中. SUSAN边缘检测算法性能分析与比较[J]. 现代电子技术, 2007, 247(8): 189-191.
MA Guizhen, FANG Zongliang, YAO Zongzhong. Performance analysis and comparison of susan edge detector[J]. Modern Electronics Technique, 2007, 247(8): 189-191.
[12] 张德丰. MATLAB数字图像处理[M]. 北京: 机械工业出版社, 2008: 216-223.
ZHANG Defeng. Digital images processing of MATLAB[M]. Beijing: Machine Industry Press, 2008: 216-223.
[13] Wang W X. Image analysis of particles by modified Ferret method:Best-fit rectangle[J]. Powder Technology, 2006, 165: 1-10.
[14] Zhang Z L, Yang J G, Ding L H, et al. An improved estimation of coal particle mass using image analysis[J]. Powder Technology, 2012, 229: 178-184.
[15] 张泽琳, 杨建国, 王羽玲. 基于MATLAB的煤粒图像识别系统及其密度和产率的预测[J]. 选煤技术, 2011(1): 53-56.
ZHANG Zelin, YANG Jianguo, WANG Yulin. Coal particle image recognition system based on matlab and prediction of density and yield[J]. Coal Preparation Technology, 2011(1): 53-56.
(编辑 陈灿华)
收稿日期:2013-04-20;修回日期:2013-06-25
基金项目:江苏省普通高校研究生科研创新计划项目(CXZZ13_0951);教育部高等学校博士学科点专项科研基金项目(20130095110005);国家自然科学基金青年基金资助项目(51304192)
通信作者:张泽琳(1988-),男,湖北武汉人,博士,从事矿物加工工艺与设备相关研究;电话:13685104601;E-mail:zhangzelin3180@163.com

