PVD硬质合金刀具加工Nimonic C-263合金表面粗糙度的建模和分析
来源期刊:中国有色金属学报(英文版)2011年第9期
论文作者:C. EZILARASAN V. S. SENTHIL KUMAR A.VELAYUDHAM K. PALANIKUMAR
文章页码:1986 - 1994
关键词:Nimonic C-263合金;表面粗糙度;响应面方法
Key words:Nimonic C-263 alloy; surface roughness; response surface method
摘 要:研究了加工Nimonic C-263合金时,切削参数(切削速度、给进速度、切削深度等)对表面粗糙度的影响。采用正交方法设计实验。评估了切削参数对表面粗糙度的影响,获得最小粗糙度的最优切削条件。采用响应面方法建立了切削参数和表面粗糙度的二次多项式模型。实验结果表明:在所考察的切削参数中,给进速度对表面粗糙度的影响最为显著,其次是切削速度。模型预测结果与实际结果吻合较好,表明所建立的模型能够用来有效地预测加工Nimonic C-263合金时的表面粗糙度。最后,对预测结果用加成定律进行了验证。
Abstract:
The effects of the cutting parameters (cutting speed, feed rate and depth of cut) on the surface roughness in machining the Nimonic C-263 alloy were investigated. The experiments were conducted using Taguchi’s experimental design. The effect of cutting parameters on surface roughness was evaluated and the optimum cutting conditions for minimizing the surface roughness were determined. A second order model was established between the cutting parameters and surface roughness, using the response surface methodology. The experimental results revealed that among the parameters considered, the feed rate is the most significant which influences the surface roughness, followed by the cutting speed. The predicted values and measured values are fairly close, which indicates that the developed model can be effectively used to predict the surface roughness in machining the Nimonic C-263 alloy. The predicted values are validated using the additive law.

C. EZILARASAN1, V. S. SENTHIL KUMAR2, A. VELAYUDHAM3, K. PALANIKUMAR4
1. Department of Mechanical Engineering, Anna University Chennai, Chennai-25, India;
2. Department of Mechanical Engineering, Anna University Chennai, Chennai-25, India;
3. Combat Vehicles Research and Development Establishment, Chennai-54, Avadi, India;
4. Sri Sairam Institute of Technology, Chennai-119, India
Received 22 July 2010; accepted 25 May 2011
Abstract: The effects of the cutting parameters (cutting speed, feed rate and depth of cut) on the surface roughness in machining the Nimonic C-263 alloy were investigated. The experiments were conducted using Taguchi’s experimental design. The effect of cutting parameters on surface roughness was evaluated and the optimum cutting conditions for minimizing the surface roughness were determined. A second order model was established between the cutting parameters and surface roughness, using the response surface methodology. The experimental results revealed that among the parameters considered, the feed rate is the most significant which influences the surface roughness, followed by the cutting speed. The predicted values and measured values are fairly close, which indicates that the developed model can be effectively used to predict the surface roughness in machining the Nimonic C-263 alloy. The predicted values are validated using the additive law.
Key words: Nimonic C-263 alloy; surface roughness; response surface method
1 Introduction
Nickel based super alloys are finding wide applications in the hot portions of jet turbines such as blades, vanes, and combustion chamber, due to their ability to operate at high temperatures for extended periods of time. The machining of these materials is needed to achieve a near-net shape. As these materials possess high temperature characteristics, they place the cutting tools under tremendous heat, pressure and abrasion, leading to rapid flank wear, crater wear and tool notching at the tool nose etc and make them highly difficult to machine, which in turn, affects the dimensional accuracy and surface integrity during machining [1-2]. To resolve the machining difficulty and to ensure the functional characteristics with the desired quality, suitable machining conditions and cutting tools are to be established [3]. Apart from the above, it is also necessary to model the process parameters in terms of the functional performance characteristics. Of the functional characteristics, machining induced surface topography is an important one.
Among the many parameters that characterize surface topography, surface roughness is still one of the most important. It is used to evaluate the surface integrity of the machined components, because it directly controls the surface functions such as friction, wear, lubricant retention and load carrying capacity. It also significantly improves fatigue strength, corrosion resistance, and creep life, which are prerequisites in the case of aerospace components [4]. Though studies have been carried out on the selection of the cutting conditions and cutting tools with respect to the machining of Inconel material, very few studies have been reported on the machining of the Nimonic C-263 alloy. Thus, a detailed machining was contemplated. Researchers in this area attempted to develop models which can predict the surface finish of a material for a variety of machining conditions, such as speed, feed rate, and depth of cut. Reliable models would not only simplify the manufacturing process planning and control, but also assist in optimizing the machinability factors of the materials. Therefore, the purpose of this study is (i) to study the effect of the machining parameters on the quality of the machined surface, (ii) to develop a suitable surface prediction technique and (iii) to evaluate the rediction ability of the model.
Previous studies on the effect of machining parameters on the Nimonic C-263 alloy indicated that lower cutting speed and higher feed rate were found to cause lower surface finish. It was also reported that the feed rate and depth of cut had a dominant influence on the surface finish and surface damage [5]. The choice of the cutting speed, feed rate, depth of cut and tool materials was observed to produce good surface finish and avoid catastrophic tool failure. It was observed that an increase in the cutting speed, feed rate and depth of cut affects the tool life and reduces the surface finish during machining, and the increase in the rake angle and change in approach angles increase the mean shear strength in the shear zone, and also encourage work hardening when machining nickel based alloys [2, 5]. In order to obtain good surface quality and dimensional properties, optimized cutting conditions have to be employed, which also needs a suitable modeling technique for better prediction [5-7]. Work hardening and low thermal conductivity causes heat concentration at the cutting tool chip interface, which causes thermo mechanical stress. This in turn affects tool life, and causes considerable surface damage. Hence, the right choice of cutting condition and tool is very important to increase the surface finish, and tool life, and to reduce the cutting force [8]. Surface roughness plays an important role in many areas and is a factor of great concern in the evaluation of machining accuracy [9].
Several researchers have used Taguchi’s method for the design of experiment. Taguchi’s method is a statistical tool, adopted experimentally to investigate the influence on surface roughness of the cutting parameters such as cutting speed, feed and depth of cut [10]. It has gained wide popularity in the engineering and scientific communities [9, 11]. Taguchi’s method is a powerful tool for the design of high quality systems. It provides a simple, efficient and systematic approach to optimize designs for performance, quality and cost [12].
In the present study, the effect of the cutting parameters on surface roughness during machining of the Nimonic C-263 alloy was studied by utilizing a PVD coated cemented carbide insert. Taguchi’s L27 array was used for conducting the experiments, and to optimize the surface finish and cutting conditions. To predict the surface finish the response surface method was adopted.
2 Experimental
2.1 Work material and cutting tool
Nimonic C-263 alloy material of 80 mm diameter and 300 mm length was used for all the experiments. The chemical analysis was studied using the spark emission spectrometer. The chemical composition of the work piece material is as follows (mass fraction, %): 52.49 Ni, 0.19 Si, 0.46 Mn, 20 Cr, 6.29 Mo, 0.07 Cu, 1.0 Fe, 16.7 Co, 1.94 Ti, 0.48 Al, 0.04 Nb, 0.15 W, 0.02 V, 0.02 C, 0.001 S, 0.007 Ta. The work material was solution treated to a hardness of HRC 32. The work piece was thoroughly cleaned, and the surface was skim-turned to remove the heat treatment related surface defects, and ensure the uniformity of the shape to eliminate errors in the experimental results. The surface conditions of the machined work piece and tool wear were studied, using the JEOL JSM-6380LA analytical scanning electron microscope (SEM). The typical SEM image of the work material before experiments is shown in Fig. 1. The turning method was selected to carry out the machining trials.

Fig. 1 Typical SEM image of heat treated surface of Nimonic C-263 alloy
The experimental study was carried out on a NAGMATI175 lathe with the following specifications: center height of 165 mm, swing over bed of 305 mm, spindle speed range of 54-1 200 r/min, feed range of 0.048-0.716 mm/r and main motor of 735 W. The machining tests were carried out under a dry cutting environment. The selected cutting tool for machining Nimonic alloy was of Sandvik make, with PVD coated cemented carbide inserts CNMX 1204 A1-SM, 1105 Grade. The tool holder used for the turning operation was a Sandvik PCLNR 2020 K12. The experiment setup is shown in Fig. 2.
Each turning trial was carried out using a fresh cutting edge so that the tool wear effect on the surface topography and roughness could be the same, and the variation due to the wear could be minimized. No observable tool wear was found under the microscope, since each cutting edge was used only once and the turning time was very short. The typical SEM images of the tool after a turning trial are shown in Fig. 3. The evolution of tool wear and cutting force will be studied in the future. The surface roughness was measured using the surcoder with the following specification standards: JIS94; cut off, 0.8 mm; filter, Gauss; sampling length, 0.8 mm; evaluation length, 4.00 mm; leveling, all; and measuring speed, 0.5 mm/s. An average of three measurements was used to characterize the surface roughness at each cutting condition.

Fig. 2 Experiment setup
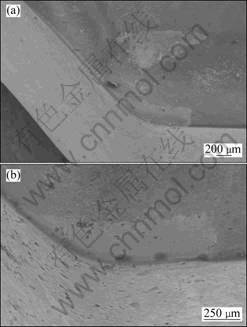
Fig. 3 Typical SEM images of tool after each turning trial: (a) v=22 m/min, f=0.051 mm/r, d=0.5 mm; (b) v=54 m/min, f=0.143 mm/r; d=1.00 mm
2.2 Experimental design
In this study, the experimental design was planned as per Taguchi’s method for optimization of cutting parameters in the machining of Nimonic C-263 alloy. This method is very attractive and effective to deal with the responses influenced by a number of variables and useful for studying the interactions between the parameters. The objective of Taguchi’s quality loss function is the quantitative evaluation of quality loss due to functional variations. A quality characteristic is the object of interest of a product or process. It is called as a fundamental characteristic. The difference between the functional value and objective value is emphasized and identified as the loss function, which is given in equation (1) [9-11].
![]() (1)
(1)
where L(y) is the loss function, y is the value of the quality characteristic, m is the target value of y, k is the proportionality constant and σ is the mean square deviation.
Equation (1) can be expressed by signal to noise (S/N) ratio (η) and can be rewritten as:
![]() (2)
(2)
where η in the decibel (dB) scale measures the effect of noise.
There are three categories of quality characteristics in the analysis of the S/N ratio, (i) the-lower-the-better, (ii) the-higher-the-better and (iii) the-nominal-the-better. Regardless of the category of the quality characteristic, the process parameter settings with the highest S/N ratio always yield the optimum quality with a minimum variance. The-lower-the-better category is always preferred to calculate the S/N ratio for both the quality characteristics of surface roughness and tool wear. The equation for the calculation of the S/N ratio for the-lower-the-better characteristic is given in Eq. (3) (in decibels) [13].
![]() (3)
(3)
where Ri is the value of the surface roughness for the ith trial in r number of tests.
Experiments were performed to investigate the effects of one or more factors of the process parameters (cutting speed, feed rate and depth of cut) on the surface finish of the machined surface. When an experiment involves two or more factors, the factors can affect the response individually as well as interactively. The level of variables used in the experiment is given in Table 1.
Table 1 Machining parameters and their levels

Taguchi’s design of experiment with a standard L27 orthogonal array was selected to conduct the turning experiments [12, 14]. It requires 27 runs and has 26 degrees of freedom. The coded values of the machining parameters and the actual setting values are given in Table 2. The analysis was made using Minitab15 software. The level of each design parameter was identified, and the analysis of the influence of the machining parameters on surface roughness was performed, using the response table for S/N ratios, which indicates the response at each level of the control factors. In addition, a statistical analysis of variance (ANOVA) was performed to find which process parameter significantly affects the response (surface roughness). The typical profilography of the roughness listed in Table 2 is shown in Fig. 4.
2.3 Response surface methodology
Apart from Taguchi’s design of experiment, response surface methodology was adopted to determine the relationship between the various process parameters and the response. Response surface methodology (RSM) is a collection of mathematical and statistical techniques that is useful for the modeling and analysis of problems, in which a response of interest is influenced by several variables and the objective is to optimize the response [15-16]. In order to study the effect of the process parameters on the surface roughness, a second order polynomial response surface can be fitted into following equation.
![]() (4)
(4)
where Y is the corresponding response, and xi are the values of the ith machining process parameter. The terms β are the regression co-efficients, and ε is the residual measure, resulting from an experimental error in the observations. This quadratic model works quite well over the entire factor space. The second order response surface representing the surface roughness (Ra) can be expressed as a function of cutting parameters, such as the cutting speed (v), feed rate (f) and depth of cut (d). The relationship between the response (surface roughness) and the machining parameters can be expressed as [17]:
![]()
![]() (5)
(5)
Table 2 Experimental conditions and results


Fig. 4 Profilography of surface roughness under different cutting conditions: (a) v=22 m/min, f=0.051 mm/r, d=0.75 mm, Ra=1.651 ?m; (b) v=22 m/min, f=0.143 mm/r, d=0.75 mm, Ra=2.935 ?m
3 Results and discussion
3.1 Effect of control parameters on surface roughness
In Taguchi’s method, the terms of signal and noise represent the desirable and undesirable values. The objective of using the S/N ratio is a measure of performance to develop products and processes insensitive to noise factors [14]. The S/N ratio indicates the degree of the predictable performance of a product or process in the presence of noise factors. Process parameter settings with the highest S/N ratio always yield the optimum quality with a minimum variance. The S/N ratio for each parameter level is calculated by averaging the S/N ratios obtained when the parameter is maintained at that level. The calculated S/N ratio for three factors on the surface roughness in machining the Nimonic C-263 alloy for each level is shown in Table 3. From Table 3, it can be seen that among the process parameters, the feed rate has the highest S/N ratio, indicating its dominant influence on the surface roughness, compared with the cutting speed and depth of cut.
The quality characteristic considered in the present study is the-lower-the-better characteristic. The surface roughness observed at low cutting speed is more than that observed at higher cutting speed. From Fig. 5, it is observed that at a higher cutting speed of 54 m/min, the surface roughness is minimized. Contrary to the cutting speed and depth of cut, the minimum surface roughness is seen at the lowest level of feed rate. At higher feed rate the scallop height is higher, thus contributing to a higher roughness value. The results clearly show that the roughness of the machined surface is predominantly influenced by the feed rate. It is evident that optimum cutting results with respect to surface roughness are obtained at a cutting speed of 54 m/min, feed rate of 0.051 mm/r and depth of cut of 1 mm.
Table 3 Response for surface roughness
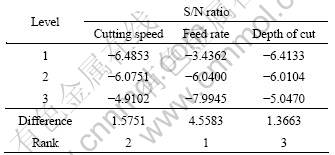
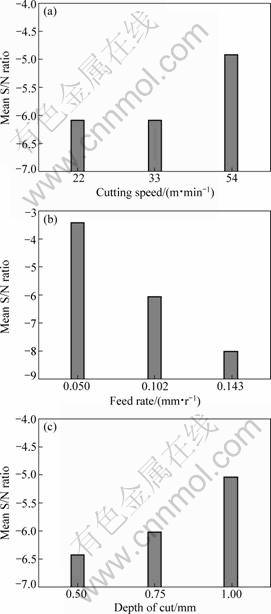
Fig. 5 Mean S/N graph for surface roughness: (a) Effect of cutting speed on mean S/N ratio; (b) Effect of feed rate on mean S/N ratio; (c) Effect of depth of cut on mean S/N ratio
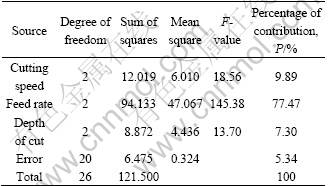
Table 4 shows the results of the analysis of variance (ANOVA) for the S/N ratio of the surface roughness. The ANOVA table shows that all the cutting parameters are significant. The calculated F value is more than the table value: F (0.05, 2, 20)=3.49 at 95% confidence level. From Table 4, it is seen that the feed rate has the highest F value calculated, indicating its higher significance compared with the cutting speed and the depth of cut.
Table 4 Results of ANOVA for S/N ratio of surface roughness
3.2 Response surface analysis
From the observed data for surface roughness, the response function was determined in uncoded units with the help of Minitab 15 software. The mathematical relationship established for correlating the surface roughness and the machining parameters in the machining of the Nimonic C-263 alloy is given by
Ra=0.9310+0.0042v+10.8365f+1.0414d-
0.0001v2+18.1737f 2-1.01236d2-
0.0733vf+0.0024vd-0.6508fd (6)
The adequacy of the developed model was evaluated by using the analysis of variance. It essentially consists of partitioning the total variation in an experiment into components ascribable to the controlled factors and error. Table 5 shows the results of ANOVA. In the ANOVA table, the sum of the squares is used to estimate the square of deviation from the grand mean. F-value is an index used to check the adequacy of the model, in which the calculated value of F should be greater than the F-table value. The model is adequate at 95% confidence level. From the analysis of Table 5, it is apparent that, the F calculated value is greater than the F-table value (F(0.05, 9, 17)=2.49) and hence the second order response function developed is quite adequate.
The adequacy of the model is further analyzed by using R-Sq values. R-Sq is defined as the ratio of variability explained by the model to the total variability in the actual data and is used to measure the goodness of the fit. The more the R-Sq approaches unity, the better the model fits the experimental data. In this study, the R-Sq value is 92.4% which shows the higher correlation that exists between the experimental and the predicted values.
Table 5 ANOVA table for response function of surface roughness

Figure 6 illustrates the contour maps in the feature plane based on Eq. (6), for each of the response surfaces at different depths of cut. These response contours can help in the prediction of the surface roughness at any zone of the experimental domain [15, 18]. It is clear from these figures that the best surface finish occurs at a higher cutting speed and depth of cut; however, it increases with an increase in the feed rate.
Surface roughness is actually the trace left by the geometry of the tool wedge on the machined surface. The surface roughness is mainly controlled by the feed rate, plan approach angle, cutting edge angle and nose radius. From Fig. 7, it is seen that with an increase in the feed rate, the surface roughness increases for all the cutting speeds. At a cutting speed of 22 m/min, around 1.1 ?m increase of surface roughness is observed, but at a higher cutting speed, there is a reduction in the level of surface roughness. At a higher feed rate the height of the ridges (roughness) is increased, thus contributing to a higher surface roughness. Along with the effect of the feed rate and geometry of the cutting wedge, the roughness of the machined surface is affected by the chip formation process, which includes cutting speed, properties of the metal being machined, elastic and plastic deformation of the surface layers, roughness of the cutting wedge and tool wear. As the cutting speed is increased, the condition for built up edge formation deteriorates due to a rise in temperature, which leads to a corresponding reduction in the height of the micro irregularities (roughness) which can be seen distinctly from Fig. 8. Along with the rise in temperature, reduced friction and plastic deformation could also influence the reduction in the surface roughness when the cutting speed is increased.

Fig. 6 Surface roughness contours in velocity-feed planes at different depths of cut: (a) At depth of cut of 0.5 mm; (b) At depth of cut of 0.75 mm; (c) At depth of cut of 1 mm
From Fig. 9, it is seen that at a higher depth of cut, a reduction in the surface roughness is observed. At a higher depth of cut, the surface layer may get work hardened, leading to a reduction in surface roughness. The level of variation in the value of surface roughness in different combinations of cutting parameters is observed to be less when turning the Nimonic-C 263 alloy, which corresponds to the results reported by EZUGWU and OKEKE [2]. The SEM micrographs of the machined surface generated at high level of cutting speed and low level of feed rate is shown in Fig. 10, in which a smooth surface is observed. However, the surface generated at low level of cutting speed and high level of feed rate shows damages such as mechanical surface damage and feed marks which are shown in Fig. 11. It is due to the fact that, at high level of feed rate and low level of cutting speed, the rubbing action takes place between the work piece and the insert due to friction.

Fig. 7 Effect of feed rate at different cutting speeds on surface roughness

Fig. 8 Effect of cutting speed at different depths of cut on surface roughness

Fig. 9 Effect of depth of cut at different feed rates on surface roughness
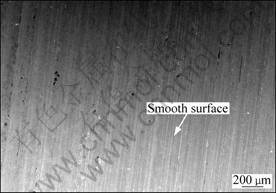
Fig. 10 SEM micrograph of machined surface with carbide insert at v=54 m/min, f=0.05 mm/r, and d=1.00 mm

Fig. 11 SEM micrograph of machined surface with carbide insert at v=22 m/min, f=0.143 mm/r, and d=1.00 mm
4 Validation of experimental results
The predicted results need to be validated to study the effectiveness of the model. Different techniques are followed for validation. In this study, a simple additive law technique is adopted. Based on the optimal condition given in section 3.1, the minimum possible surface roughness was calculated from the following equation [11]:
![]() (7)
(7)
where ηm is the grand mean of S/N ratio; ηj is the mean S/N ratio at optimum level; k is the number of main design parameters that affect quality characteristics. ηpredicted=-1.746 3; Ra=1.102 9 μm.
Figure 12 shows the validation of the experimental results for the surface roughness. The test numbers 1 and 2 show the comparison of the experimental results with the additive model equation. The result shows that there is a small variation in the predicted value for both tests. The validity of the response surface model was checked by using test numbers 3, 4 and 5, shown in Fig. 12. The figure shows the experimental values and their corresponding predicted values through Eq. (6). The verification tests were conducted randomly for the three selected test conditions. It is observed that the predicted values are very close to the experimental results. Also when comparing the additive model and the response surface model, the obtained error is always smaller when the response surface model is used. It is realized from the verification test results that the surface roughness of the machining process is greatly improved by an optimal setting of machining parameters.
The comparison of the test results between the experimental and predicted values through Eq. (6) is shown in Fig. 13. From this figure, it can be seen that the predicted values are close to the experimental values, indicting the effectiveness of the mathematical relationship established in Eq. (6) for surface roughness while turning the Nimonic C-263 alloy.
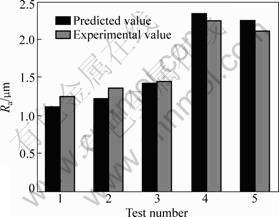
Fig. 12 Verification of test results for surface roughness

Fig. 13 Comparison of test results between experimental and predicted values through Eq. (6)
5 Conclusions
1) The effect of machining parameters on the surface roughness was evaluated with the help of Taguchi method, and the optimal machining conditions to minimize the surface roughness were determined.
2) The feed rate was observed to be the dominant parameter for achieving less surface roughness, followed by the cutting speed and depth of cut.
3) The best possible machining condition for obtaining better surface roughness was cutting speed of 54 m/min, feed rate of 0.051 mm/r and depth of cut of 1.00 mm for turning the Nimonic C-263 alloy with PVD coated carbide tool.
4) The results indicated that the increase of feed rate increases the surface roughness, whereas the increase of cutting speed and depth of cut decreases the surface roughness under all cutting conditions. The surface generated in high level of feed rate shows damages such as mechanical surface damage and feed marks.
5) The adequacy of the developed model was evaluated by using the analysis of variance. Based on the F-test, the model is adequate at 95% confidence level, and hence, the second order response function developed is quite adequate. From the R-Sq values of 92.4% a higher correlation was observed between the experimental and predicted values.
6) The verification test results revealed that the determined optimal combination of the machining parameters satisfies the real requirements of the turning operation in machining the Nimonic C-263 alloy.
References
[1] CHOUDHURY I A, EL-BARADIE M A. Machinability of nickel-based super alloys: A general review [J]. International Journal of Materials Processing, 1998, 77: 278-284.
[2] EZUGWU E O, OKEKE C I. Behavior of coated carbide tools in high speed machining of a nickel base alloy [J]. Tribology Transactions, 2002, 45: 122-126.
[3] EZUGWU E O. Key improvements in the machining of difficult-to-cut aerospace super alloys [J]. International Journal of Machine Tools and Manufacture, 2005, 45: 1353-1367.
[4] EZUGWU E O, BONNEY J, YAMANE Y. An overview of the machinability of aero engine alloys [J]. International Journals of Materials Processing Technology, 2003, 134: 233-253.
[5] EZUGWU E O, OKEKE C I. Performance of PVD coated carbide inserts when machining a Nimonic C-263 alloy at high speed conditions [J]. Tribology Transactions, 2000, 43: 332-336.
[6] SAHIN Y, MOTORCU A R. Surface roughness model for machining mild steel [J]. Materials Design Article, 2004, 26: 84-90.
[7] ROSS T J. Taguchi techniques for quality engineering [M]. New York: Mc Graw-Hill, 1996.
[8] PAWADE R S, JOSHI S S, BRAHMANKAR P K, RAHMAN M. An investigation of cutting forces and surface damage in high-speed turning of Inconel 718 [J]. Journal of Materials Processing Technology, 2007, 192-193: 139-146.
[9] KARUNAMOORTHY P L, KRATHIKEYAN R. Assessment of factors influencing surface roughness on the machining of glass reinforced polymer composites [J]. Journal of Materials and Design, 2006, 27: 862-871.
[10] ZHANG X P, LIU C R, YAO Z Q. Experimental study and evaluation methodology on hard surface integrity [J]. International Journal of Advanced Manufacturing Technology, 2007, 34(1-2): 141-148.
[11] NALBANT N, GOKKAYA H, SUR G. Application of Taguchi method in the optimization of cutting parameters for surface roughness in turning [J]. Journal of Materials and Design, 2007, 28(4): 1379-1385.
[12] MONTGOMERY D C. Design and analysis of experiments [M]. New York: John Wiley and Sons, 1991.
[13] YANG W H, TANG Y S. Design optimization of cutting parameters for turning operations based on Taguchi method [J]. Journal of Materials Processing Technology, 1998, 84: 122-129.
[14] SURESH P V S, VENKATESHWARA RAO K, DESHMUKH S G. A genetic algorithmic approach for optimization of the surface roughness prediction model [J]. International Journal of Machine Tools and Manufacture, 2002, 42: 675-680.
[15] LALWANI D I, MEHTA N K, JAIN P K. Experimental investigation of cutting parameters influence on cutting forces and surface roughness in finish hard turning of MDN250 steel [J]. Journal of Materials Processing and Technology, 2008, 206: 167-179.
[16] SINGH D, VENKATESWARA RAO P. A surface roughness prediction model for hard turning process [J]. International Journal of Advanced Manufacturing Technology, 2007, 32: 1115-1124.
[17] PARK S H. Robust design and analysis for quality engineering [M]. London, UK: Chapman & Hall, 1996.
[18] PALANIKUMAR K, SHANMUGAM K, PAULO DAVIM J. Analysis and optimization of cutting parameters for surface roughness in machining Al/SiC particulate composites by PCD tool [J]. International Journal of Materials and Product Technology, 2010, 37: 117-128.
C. EZILARASAN1, V. S. SENTHIL KUMAR2, A.VELAYUDHAM3, K. PALANIKUMAR4
1. Department of Mechanical Engineering, Anna University Chennai, Chennai-25, India;
2. Department of Mechanical Engineering, Anna University Chennai, Chennai-25, India;
3. Combat Vehicles Research and Development Establishment, Chennai-54, Avadi, India;
4. Sri Sairam Institute of Technology, Chennai-119, India
摘 要:研究了加工Nimonic C-263合金时,切削参数(切削速度、给进速度、切削深度等)对表面粗糙度的影响。采用正交方法设计实验。评估了切削参数对表面粗糙度的影响,获得最小粗糙度的最优切削条件。采用响应面方法建立了切削参数和表面粗糙度的二次多项式模型。实验结果表明:在所考察的切削参数中,给进速度对表面粗糙度的影响最为显著,其次是切削速度。模型预测结果与实际结果吻合较好,表明所建立的模型能够用来有效地预测加工Nimonic C-263合金时的表面粗糙度。最后,对预测结果用加成定律进行了验证。
关键词:Nimonic C-263合金;表面粗糙度;响应面方法
(Edited by YUAN Sai-qian)
Corresponding author: V. S. SENTHIL KUMAR; E-mail: vssk70@gmail.com; vsskumar@annauniv.edu
DOI: 10.1016/S1003-6326(11)60961-8

