
J. Cent. South Univ. (2018) 25: 151-158
DOI: https://doi.org/10.1007/s11771-018-3725-8

Semi-autogenous mill power prediction by a hybrid neural genetic algorithm
Hoseinian Fatemeh Sadat1, Abdollahzadeh Aliakbar1, 2, Rezai Bahram1
1. Department of Mining and Metallurgical Engineering, Amirkabir University of Technology,Tehran 1591634311, Iran;
2. Department of Mining Engineering, University of Kashan, Isfahan 8731753153, Iran
 Central South University Press and Springer-Verlag GmbH Germany, part of Springer Nature 2018
Abstract: There are few methods of semi-autogenous (SAG) mill power prediction in the full-scale without using long experiments. In this work, the effects of different operating parameters such as feed moisture, mass flowrate, mill load cell mass, SAG mill solid percentage, inlet and outlet water to the SAG mill and work index are studied. A total number of 185 full-scale SAG mill works are utilized to develop the artificial neural network (ANN) and the hybrid of ANN and genetic algorithm (GANN) models with relations of input and output data in the full-scale. The results show that the GANN model is more efficient than the ANN model in predicting SAG mill power. The sensitivity analysis was also performed to determine the most effective input parameters on SAG mill power. The sensitivity analysis of the GANN model shows that the work index, inlet water to the SAG mill, mill load cell weight, SAG mill solid percentage, mass flowrate and feed moisture have a direct relationship with mill power, while outlet water to the SAG mill has an inverse relationship with mill power. The results show that the GANN model could be useful to evaluate a good output to changes in input operation parameters.
Key words: semi-autogenous mill; mill power; prediction; sensitivity analysis; artificial neural network; genetic algorithm
Cite this article as: Hoseinian Fatemeh Sadat, Abdollahzadeh Aliakbar, Rezai Bahram. Semi-autogenous mill power prediction by a hybrid neural genetic algorithm [J]. Journal of Central South University, 2018, 25(1): 151�C158. DOI: https://doi.org/10.1007/s11771-018-3725-8.
1 Introduction
Semi-autogenous grinding (SAG) has the same economic advantages (higher processing capacity, lower physical space requirements, lower investment and maintenance costs) that are recently used as the primary grinding stage [1, 2]. Optimization, control and analysis of the SAG mill process requires accurate and comprehensive modeling. Identification of all the effective parameters on the process efficiency and their simultaneous impact on the process output is needed to provide such models. Modeling and simulation of a process are helpful tools for the design and optimization of its circuit. There are numerous SAG mill models evaluated in the literature; however, the majority of SAG mill prediction models has not evaluated its performance for the full-scale mill. The models, which are based on wide data of full-scale circuits, have significantly low risk. The feed characteristics and mill performance have some interactions that affect the AG and SAG mills efficiency. These interactions in the process and difficulty in gathering good relevant data make modeling and simulation of AG and SAG mills in full-scale circuits difficult [2�C6].
Valery et al [7] presented a conceptual dynamic model of the SG/SAG mill in order to predict the power draw, distribution of product size and load level. Their model could be useful to provide a good response to changes in operation parameters such as the rate, ore hardness and size distribution of feed, recycle load and water addition. Salazar et al [1] also presented a dynamic modelling and simulation of SAG mills that can be used for designing the milling operations. Morell [2] predicted mill models for the AG and SAG mill and tumbling mill. He used small diameter drill core samples to generate a strength index that was useful to the AG and SAG mills specific energy. Morell [3] predicted the tumbling mill circuit specific energy using a new method. He showed that the energy utilization efficiency had no significant difference in all studied plants grinding circuits [2, 3]. Two mill powerdraw models are developed by the Julius Kruttschnitt Mineral Research Centre and the JA Herbst and Associates presented in Eqs. (1) and (2), respectively.
 (1)
(1)

 (2)
(2)
where PGross, JK, PNo Load, PCharge and k are the mill powerdraw (kW), the empty mill powerdraw (kW), the powerdraw of the entire contents of the mill (kW) and a lumped mill powerdraw parameter, PGross,JAHis the mill powerdraw (kW), N*is the fractional critical speed, Wcis the charge mass (t), V*is the mill fraction occupied by the charge, �� is the charge angle of repose (��),Dm is mill diameter (m), and C3is a constant [6, 8].
Mill power is computed from the effective parameters in the process. Measurement of all parameters is sometimes impossible and often inaccurate. The on-line measurement of all parameters needs high cost of investment and maintenance. Thus, a new model based on a suitable dataset can be useful in order to solve these problems.
The objective of this work is to predict semi- autogenous mill power by testing the main parameters involved in the SAG mill process. The hybrid of the artificial neural network and genetic algorithm model is developed to predict the semi-autogenous mill power, taking into account effective parameters as inputs to the model, such as feed moisture, mass flowrate, mill load cell mass, SAG mill solid percentage, inlet and outlet water to the SAG mill and work index.
2 Case study and data analysis
The SAG mill operation dataset of the Aq Darreh gold processing plant is collected for modeling SAG mill power. The processing plane is located 32 km north of Takab city in West Azarbaijan province, Iran. The ore is supplied from the Aq Darreh mine 12 km from the plant. In the grinding of Aq Darreh gold processing, the ore is fed to the SAG mill for grinding after crushing using the jaw crusher. The discharge of the SAG mill is classified by hydrocyclones and then the over flow of hydrocyclons is used for leaching for the recovery of gold and silver from the ore.
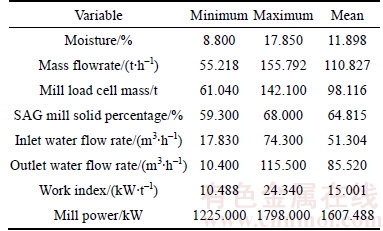
The dataset statistical analysis is performed based on the 185 SAG mill operations. The outlying data points in the data sets can have an adverse influence on the understanding of parameter relationships. The multivariate statistical tools of the principal components are used for the identification and elimination of the outlying and natural groups of data in order to make a more homogeneous dataset for modeling. In order to determine whether the data are log-normally distributed, each parameter was logarithmically transformed. The quantile-quantile (Q-Q) plots of parameters are shown in Figure 1. The results show that there are some outliers in the log-transformed parameters. Thus, they are not log-normally distributed. In order to build a more homogeneous dataset for modeling, the outlier data (43 data) are removed from the original data. The input and output variables ranges of semi-autogenous mill power prediction for the 142 measurements are shown in Table 1.
3 GANN model
Recently, artificial neural networks (ANN) have been successfully used in mineral processing. They are used for modeling and controlling the complicated systems and identifying very difficult relations between input and output data [9]. ANN acts as a black box that utilizes the nonlinear basis function set between input and output data to be communicated. A neural network generally has one input and output layer and one or more hidden layers, each having one or more neurons for inter-relating using the weight parameter [10]. The amounts of bias and its inner connections are added with other neurons and transferred to the next layer based on the data input/output characteristics [11, 12]. The back-propagation (BP) algorithm is a useful type of neural network. In this algorithm, the weights communication and bias are updated according to the calculated error rate [13]. The connections of the hidden and output layers are done with a similar logic [10]. The genetic algorithm (GA) can be used for the BP neural network weights optimization, learning parameters and finding the ANN network structure.
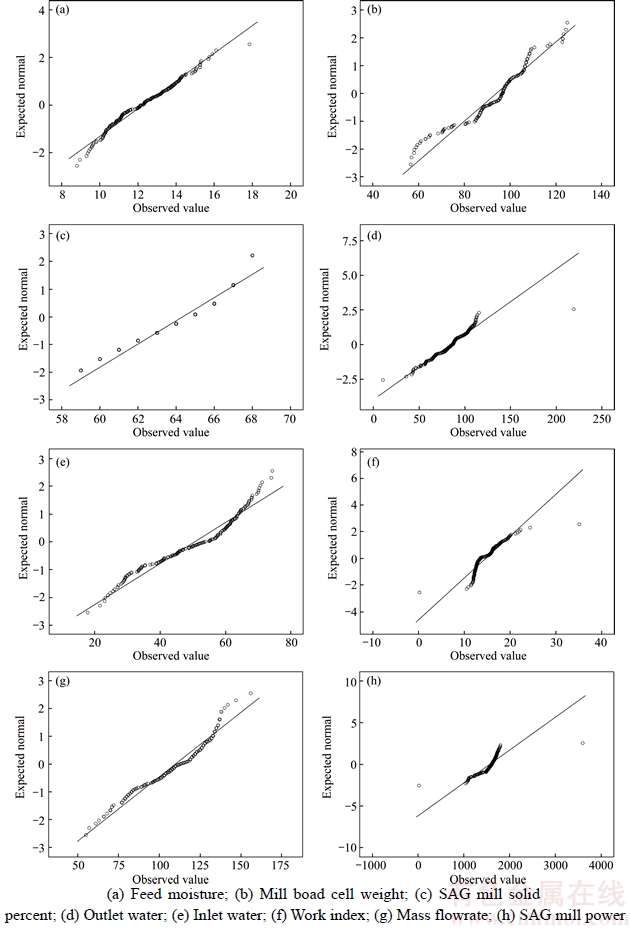
Figure 1 Q-Q plots of in-transformed parameters:
Table 1 Pre-processing parameters for GANN
The GA is a useful method for optimization problems using the principles of Darwinian natural selection [14]. For process control, parameter optimization and circuit design in mineral processing, GA has been successfully used [12�C15]. In this work, GA is used for the weights and threshold optimization of the BP neural network. In this regard, the length of the chromosome is the total number of connection of the ANN [16�C18].
Figure 2 shows the flow chart of the algorithm. The collection of chromosomes is a population [15]. For evaluating all the chromosomes fitness values, an objective function is determined based on the main aim. The generated random population is evaluated with a given fitness function. At each iteration, the generation of offsprings (using mutation and crossover from the previous ones) and evaluating their fitness are repeated. The GA algorithm process is continued to reach the specified conditions [15]. The response of the best process simulated evolution can become a good solution to the problem.
The arithmetic crossover is used to produce two new offsprings by a linear combination of two
parents. Two parents XAiand XBi are selected that cross each other. Then, the new offsprings (XAi+1 and XBi+1) are produced:
 (3)
(3)
 (4)
(4)
where ��1 and ��2 are the random numbers in the range of 1 and the number of elements in array of XAi.
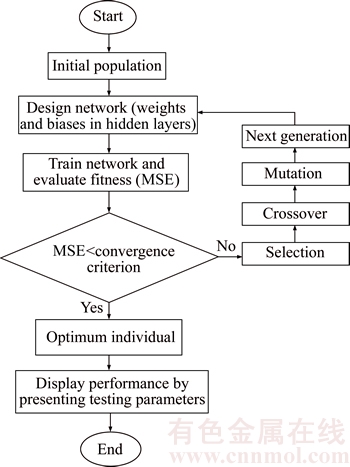
Figure 2 Flow chart of using GA to optimize BP algorithm
The mutation point (xk) is in the range of [Ukmin, Ukmax]. The genetic value of the mutation point is:
 (5)
(5)
where r is a random number in the range of the number of selected parents for mutation and the number of total parents [18].
The connection weights of the new population offspring given to the neural network and the fitness function of the new offspring are calculated. The process of genetic operations has been continued until it reaches the predetermined value [19].
4 Parameter selection and modeling using GANN
In this work, ANN and GANN are used. To train the networks, 142 sets of data recorded in SAG mill power are used in which 114 sets are used to train the network and 28 sets to test its correctness. All input and output data (before feeding to the networks) were normalized in the range from �C1 to 1. Feed moisture, mass flowrate, mill load cell mass, SAG mill solid percentage, inlet and outlet water to the SAG mill and work index are input parameters of the network. The designed network output is SAG mill power. The GA is used for the optimization of weights and threshold of the GANN network. We select the GA population size equal to 100 and the maximum generation equal to 450. The top scoring 15% of the population is selected as fit to survive in the next generation of solutions and 50% and 35% of the population for the crossover and mutation, respectively.
5 Results and discussion
In the GANN model, the algorithm of back propagation is used for the network training. The algorithm of back propagation has a weak convergence rate and does not always converge to the absolute minimum. The connection weights of ANN by the BP algorithm are only adjusted from the local angle and the entire learning process from the global perspective is not examined. Therefore, it may be stopped in a local minimum [19]. For better training of the neural network, the combined BP and GA can be used. In order to overcome this disadvantage of BP, GA is used to optimize the BP algorithm. It applies for learning the connection weights and bias of ANN. There are some limited elements such as the number of layer and neuron in each layer in the training process so that their large number increases the training time. The GANN network optimal topology is designed for SAG mill power with 3 hidden layers and one output layer in the form {7 _ 18 _ 13 _ 1} as shown in Figure 3.
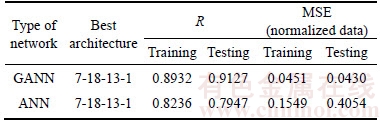
The sum square error during generation of GANN and comparison of measured SAG mill power and its estimated by GANN in the training process are shown in Figure 4. The sum square error is reduced with increasing generation and the measured SAG mill powers and estimated SAG mill powers using GANN are close to each other in the training process. The test data are evaluated in the trained model for the GANN model validation. Figure 5 shows the SAG mill power measured values in comparison with the GANN predictions for each sample. Figures 6�C9 show the correlation coefficient assessment (R) of training and testing phases using the GANN and ANN algorithm in the form {7 _ 18_ 13 _ 1}, respectively (In these figures, ��Best linear fit�� is the best linear fit on the data in order to evaluate the correlation coefficients assessment and ��Y=T�� is the ideal condition that measured SAG mill power equal to predicted SAG mill power by the model). As shown in Figures 6 and 7, the SAG mill power values measured in the Aq Darreh gold processing plant and predicted using the GANN are close to each other in the training and testing of networks. The gradients of the regression line between measured SAG mill powers estimated using GANN in training and testing are equal to 0.8932 and 0.9127, respectively. As shown in Figures 8 and 9, the gradients of the regression line between measured SAG mill powers predicted using the ANN are 0.8236 and 0.7947 in the training and testing of networks, respectively that are less than those for the GANN model. The determination coefficient (R) and the mean squared error (MSE) of the GANN and ANN networks are presented in Table 2. The R and MSE of training and testing for the GANN model are better than those of the ANN ones. Therefore, the GANN efficiency is more than ANN for the SAG mill power prediction.
6 Sensitivity analysis
The sensitivity analysis can be used to determine the most effective input parameters on the output. The mill power GANN model sensitivity is evaluated. In this regard, each input parameter is variable in the range of the minimum and maximum of its value while the other parameters remain at their average value. Therefore, the change effect of each input parameter on the mill power can be evaluated. The unit and value of the input parameters are different. In order to get simultaneous display of all input parameters changes on mill power, the standardized parameters should be used. The z-score formula (Eq. (6)) is used for the parameters standardization.
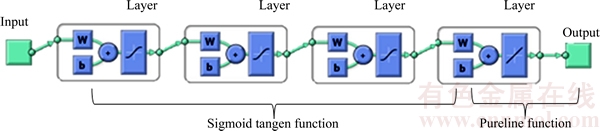
Figure 3 GANN structure for design of SAG mill power in form {7 _ 18_13 _ 1}
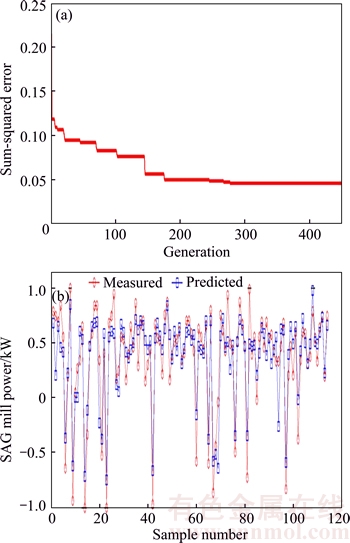
Figure 4 Sum-squared error during generation of GANN (a) and comparison of measured SAG mill power with those estimated by GANN in training process (b)
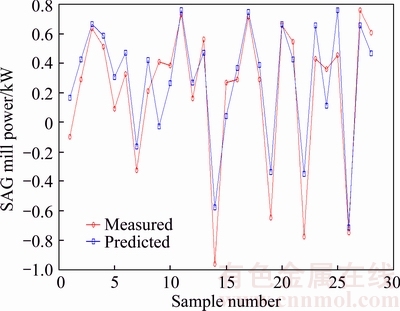
Figure 5 Comparison of measured SAG mill power with those estimated by GANN in testing process
 (6)
(6)
where Xi,  �� and Z are the ith variable, the average and standard deviation of input parameters and the parameter standardized value, respectively.
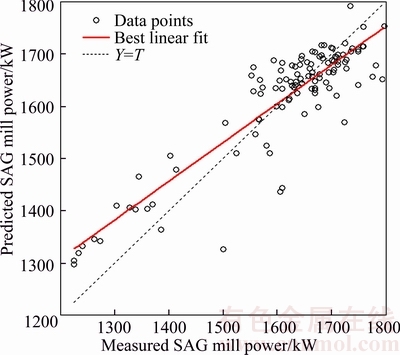
Figure 6 Predicted SAG mill power by GANN in training process vs actual measurement
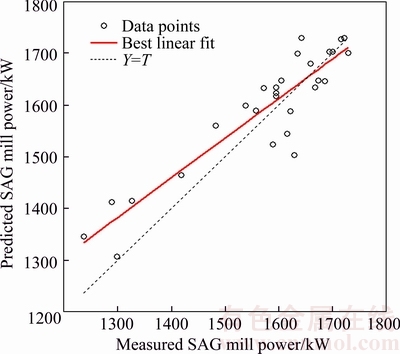
Figure 7 Predicted SAG mill power by GANN in testing process vs actual measurement (R=0.91272)
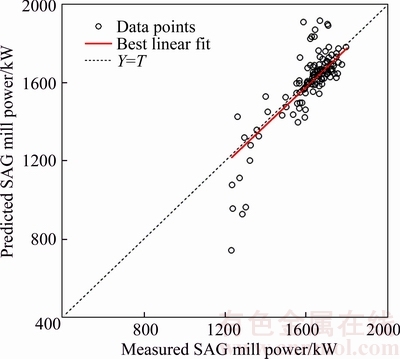
Figure 8 Predicted SAG mill power by ANN in training process vs actual measurement (R=0.8236)
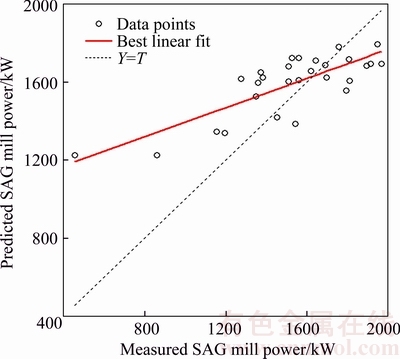
Figure 9 Predicted SAG mill power by ANN in testing process vs actual measurement (R=0.79475)
Table 2 Statistical measures and performance of GANN models for training and testing
The simultaneous displays of mill power changes against changing any input parameters are shown in Figure 10, which shows that the mill power is more sensitive to the work index, inlet water to the SAG mill, mill load cell mass, SAG mill solid percentage, mass flowrate, outlet water to the SAG mill and feed moisture, respectively. The input parameters of the work index, inlet water to the SAG mill, mill load cell weight, SAG mill solid percentage, mass flowrate and feed moisture have a direct relationship with mill power. The mill power increases with increasing these parameters. The feed moisture has lower impact on mill power than other input parameters. The mill power has an inverse relationship with outlet water to the SAG mill and decreases with increasing outlet water to the SAG mill.
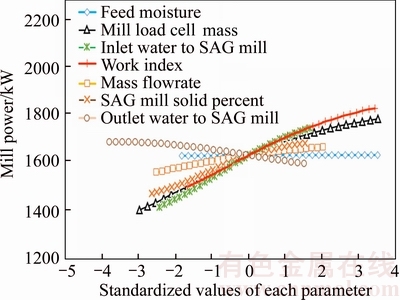
Figure 10 Input parameters sensitivity analysis on mill power model
7 Conclusions
In this work, parameters such as feed moisture, mass flowrate, mill load cell mass, SAG mill solid percentage, inlet and outlet water to the SAG mill and work index in full-scale for GANN modeling are evaluated. GANN, as a new procedure, has been used for SAG mill power prediction. In the GANN network, the GANN algorithm with {7-18-13-1} arrangement has been used to predict SAG mill power. The correlation coefficient and mean square error of the testing sets for prediction of the SAG mill power using GANN are 0.9127 and 0.0430, respectively. The sensitivity analysis of the GANN model shows that the SAG mill power increases with increasing the work index, inlet water to the SAG mill, mill load cell mass, SAG mill solid percentage, mass flowrate and feed moisture and decreases with increasing outlet water to the SAG mill. The results show that according to parameters affecting the SAG mill power, the proposed GANN model can be used to predict the SAG mill power with reasonable error.
References
[1] Salazar J, Magne L, Acuna G, Cubillos F. Dynamic modelling and simulation of semi-autogenous mills [J]. Minerals Engineering, 2009, 22(1): 70�C77.
[2] Morrell S. A method for predicting the specific energy requirement of comminution circuits and assessing their energy utilisation efficiency [J]. Minerals Engineering, 2008, 21(3): 224�C233.
[3] Morrell S. A new autogenous and semi-autogenous mill model for scale-up, design and optimisation [J]. Minerals Engineering, 2004, 17(3): 437�C345.
[4] VAN Nierop M, Moys M. The effect of overloading and premature centrifuging on the power of an autogenous mill [J]. Journal of the South African Institute of Mining and Metallurgy, 1997, 97(7): 313�C317.
[5] Herbst J, Pate W. Object components for comminution system softsensor design [J]. Powder Technology, 1999, 105(1): 424�C429.
[6] Napier-Munn T J, Morrell S, Morrison R D, Kojovic T. Mineral comminution circuits: Their operation and optimisation [M]. Brisbare: Julius Kruttschnitt Mineral Research Centre, University of Queensland, 1996: 413.
[7] Valery W, Morrell S. The development of a dynamic model for autogenous and semi-autogenous grinding [J]. Minerals Engineering, 1995, 8(11): 1285�C1297.
[8] Apelt T, Asprey S, Thornhill N. Inferential measurement of SAG mill parameters [J]. Minerals Engineering, 2001, 14(6): 575�C591.
[9] Chelgani S C, Shahbazi B, Rezai B. Estimation of froth flotation recovery and collision probability based on operational parameters using an artificial neural network [J]. International Journal of Minerals, Metallurgy, and Materials, 2010, 17(5): 526�C534.
[10] Amnieh H B, Siamaki A, Soltani S. Design of blasting pattern in proportion to the peak particle velocity (PPV): Artificial neural networks approach [J]. Safety Science, 2012, 50(9): 1913�C1916.
[11] Khandelwal M, Singh T. Prediction of blast-induced ground vibration using artificial neural network [J]. International Journal of Rock Mechanics and Mining Sciences, 2009, 46(7): 1214�C1222.
[12] Patterson D W. Artificial neural networks: Theory and applications [M]. Prentice Hall PTR, 1998: 477.
[13] EBERHART R C. Neural network PC tools: A practical guide [M]. Academic Press, 2014: 440.
[14] VOSE M D. The simple genetic algorithm: Foundations and theory [M]. MIT press, 1999: 251.
[15] Shopova E G, Vaklieva-Bancheva N G. BASIC��A genetic algorithm for engineering problems solution [J]. Computers & Chemical Engineering, 2006, 30(8): 1293�C 1309.
[16] Yasin Y, Ahmad F B H, Ghaffari-Moghaddam M, Khajeh M. Application of a hybrid artificial neural network�Cgenetic algorithm approach to optimize the lead ions removal from aqueous solutions using intercalated tartrate-Mg�CAl layered double hydroxides [J]. Environmental Nanotechnology, Monitoring & Management, 2014, 1: 2�C7.
[17] Gupta J N, Sexton R S. Comparing backpropagation with a genetic algorithm for neural network training [J]. Omega, 1999, 27(6): 679�C684.
[18] LI C Q, Yang Z X, YAN H Y, WANG T. The application and research of the ga-bp neural network algorithm in the mbr membrane fouling [J]. Abstract and Applied Analysis: Hindawi Publishing Corporation, 2014, Article ID: 673156.
[19] Mart��nez-Morales J D, Palacios-Hern��ndez E R, Vel��zquez-Carrillo G A. Artificial neural network based on genetic algorithm for emissions prediction of a SI gasoline engine [J]. Journal of Mechanical Science and Technology, 2014, 28(6): 2417�C2427.
(Edited by FANG Jing-hua)
���ĵ���
���ڻ�����Ŵ��㷨�İ���ĥ������Ԥ��
ժҪ��һ��ȫ��Ԥ�����ĥ�����ʵķ�������Ҫ��������ʵ�顣�����о���ͬ�IJ���������ĥ������ָ����Ӱ�죬�繩��ˮ�֡��������١�ĥ�����ؼ����ء��̺��ʡ����ںͳ���ˮ����������185��ȫ��İ���ĥ�����ʣ����ڿ������������������йص��˹�������͵Ļ���Ŵ��㷨ģ�͡���Ԥ�����ĥ�������ϣ�����Ŵ��㷨ģ�ͱ��˹����������Ч�������Է���ȷ���˰���ĥ������Ԥ�����Ч�����������ͨ������Ŵ��㷨ģ�͵������Է������֣�����ָ����ĥ�����ˮ��ĥ�����ؼ����ء��̺��ʡ��������ٺ���ˮ����ĥ��������ֱ�ӹ�ϵ��������ˮ��ĥ�����ʸ���ء��������������Ŵ��㷨ģ������������������������仯���µ������
�ؼ��ʣ�����ĥ����ĥ�����ʣ�Ԥ�⣻�����Է������˹������磻�Ŵ��㷨
Received date: 2016-11-04; Accepted date: 2017-03-23
Corresponding author: Hoseinian Fatemeh Sadat, PhD student; Tel: +98�C21�C64542940; E-mail: f_hoseinian@aut.ac.ir

