
Enhanced Cu(Ⅱ) adsorption by orange peel modified with sodium hydroxide
FENG Ning-chuan(冯宁川)1, 2, GUO Xue-yi(郭学益)1, LIANG Sha(梁 莎)1
1. School of Metallurgical Science and Engineering, Central South University, Changsha 410083, China;
2. School of Basic Medical Science, Ningxia Medical College, Yinchuan 750004, China
Received 6 July 2009; accepted 30 December 2009
____________________________________________________________________________________________
Abstract: Copper adsorption by orange peel, which was chemically modified with sodium hydroxide, was investigated. The adsorbent was characterized using surface area analyzer, infrared spectroscopy and scanning electron microscopy. Total negative charge and zeta potentials on the adsorbent surface were determined. Equilibrium isotherms and kinetics were obtained and the effects of solution pH value, adsorbent concentration and temperature were studied in batch experiments. Column experiments were performed to study practical applicability, and breakthrough curves were obtained. Equilibrium is well described by Langmuir and Freundlich isotherms, and kinetics is found to fit pseudo-second order type adsorption kinetics. According to Langmuir equation, the maximum adsorption capacity for Cu(Ⅱ) is 50.25 mg/g at pH value of 5.3. The results show additional chemical modification of the adsorbent by NaOH and the increased adsorption capacity.
Key words: copper; orange peel; adsorption; kinetic; isotherms
____________________________________________________________________________________________
1 Introduction
Increasing use of metals and chemicals in processing industries has resulted in generation of large quantities of effluent that contains high level of toxic heavy metals, which poses environmental-disposal problems due to its non-degradable, persistence nature and accumulation throughout the food chain[1-2]. Copper is known to be a commonly used heavy metal. This metal, which has many useful applications in our life, is very harmful if it is discharged into natural water resources and may finally pose a serious health hazard.
Many methods, such as chemical precipitation, ion exchange, reverse osmosis and adsorption, have been used for heavy metal ions removal from various aqueous solutions. In recent years, there has been considerable interest in the use of biological materials including algae, bacteria, fungi, agricultural by-products and residues as adsorbents to remove toxic metals from aqueous solutions by adsorption[3-5]. Adsorption process was extensively used to remove copper from aquatic medium using low cost adsorbents such as plant materials[6] and cellulose materials[7]. Among them, agricultural by-products and biomass are relatively cheap and show very high adsorption capacities. However, using untreated agricultural by-products as adsorbents can also bring severe problems, such as low adsorption capacity, high chemical oxygen demand (COD) and biological chemical demand (BOD) as well as total organic carbon (TOC), due to the release of soluble organic compounds contained in the plant materials, such as lignin, tannin, pectin and cellulose, into the solutions[8-9]. The increase of the COD, BOD and TOC can cause depletion of oxygen content in water and then threaten the aquatic life. To release such problems, chemical treatment on solid adsorbents was used as a technique for improving their physical and chemical properties and increasing their adsorption capacity[10-14].
Orange peel (OP) is a material composed of several constituents. Among them pectin (galacturonic acid), hemicellulose, cellulose and lignin acid bear various polar functional groups, including carboxylic and phenolic acid groups that can be involved in metal ions complexion[15-16]. As the low cost, OP is an attractive and inexpensive alternative for the adsorption removal of dissolved metals. The aim of this work was to study the adsorption capacity of OP that was chemically modified with sodium hydroxide for removing Cu(Ⅱ) ions from solutions, and investigate various parameters including contact time, pH and concentration of Cu(Ⅱ) ions on the adsorption efficiency.
2 Experimental
2.1 Chemicals
All chemicals used in the present work were of analytical purity. The stock solution of Cu(Ⅱ) with concentration of 1.0 g/L was prepared using CuSO4?5H2O and then diluted to appropriate concentrations. 0.1 mol/L HCl and 0.1 mol/L NaOH were used for pH value adjustment.
2.2 Chemical modification of OP
OP was used as the raw material for the preparation of the chemically modified adsorbent. OP, which was collected from a local plantation, was cut into small pieces, washed several times with distilled water and dried at 80 ℃. The product was then crushed and sieved to obtain an average particle size lower than 0.45 mm. Adsorbent was modified with NaOH solution to improve the capacity of metal uptake. For this purpose, 100 g of dried OP was treated in 1 L NaOH (0.1 mol/L) solution for 24 h. After repeated decantation and filtration, modified biomass (SOP) was washed with distilled water until the pH value of solutions reached 7.0.
2.3 Instruments used for adsorbent characterization
The specific surface area of OP and SOP was measured by BET N2 adsorption using Quantasorb surface area analyzer (QS/7). Surface morphologies of the adsorbents were identified by a JSM-5600LV scanning electron microscope (SEM). FTIR spectroscopy was used to identify the chemical groups present in the adsorbents. Spectra of the adsorbent before and after Cu(Ⅱ) binding were recorded in the wavenumber range of 400-4 000 cm-1 using a JASCO-410 model FTIR spectrometer with the samples prepared as KBr discs. Zeta potentials of OP and SOP were measured in the pH range of 2.0-7.0 on a Malvern Zetasizer (Model ZEN 2010, Malvern Instrument Co UK). A modification of the method and the potassium dichromate method were used to determine total negative charge[17] and the chemical oxygen demand (COD). A pH meter (PHS-3C, made in China) was used to measure pH value of the suspension.
2.4 Batch adsorption experiments
Batch adsorption experiments were conducted by mixing adsorbent with 25 mL of Cu(Ⅱ) ions solutions of desired concentrations in 100 mL sealed conical flask using a shaking thermostat machine at a speed of 120 r/min. The effect of solution pH value on the equilibrium adsorption of Cu(Ⅱ) was investigated by mixing 100 mg of SOP with 25 mL of Cu(Ⅱ) ions solutions of 50 mg/L between pH value of 2.0 and 6.5. In the kinetic experiments, 50 mg/L Cu(Ⅱ) ions solutions were used. The adsorption time varied between 0 and 120 min. In the isotherm experiments, 0.100 g of adsorbent was added in 25 mL of Cu(Ⅱ) ions solutions at various concentrations (25-400 mg/L). After the established contact time (1 h) reached, the samples were withdrawn and centrifuged at 4 000 r/min for 5 min and the supernatant fluid was analyzed for the residual Cu(Ⅱ) ions concentration by using Rayleigh WFX-130B atomic absorption spectrophotometer. The amount of adsorption (q) was calculated by the following equation:
 (1)
(1)
where ρ0 and ρe are the initial and equilibrium Cu(Ⅱ) ions concentrations, respectively; V is the volume of the solutions; and m is the amount of adsorbent used. All the adsorption experiments were conducted in duplicate, and the mean values were calculated.
2.5 Column adsorption experiments
The column adsorption tests for Cu(Ⅱ) ions removal were carried out using a transparent glass column of 0.95 cm in inner diameter and 20 cm in height fitted with a glass filter at the bottom. SOP (100 mg) was packed into the column. The test solution, containing 50 mg/L Cu(Ⅱ) ions at pH value of 5.3, was passed through the column at a flow rate of 6.0 mL/h by using a peristaltic pump (made in China). The column was conditioned by passing water at the same pH value. A fraction collector (BIORAD model 2110 fraction collector) was used to collect the fraction of effluent at definite intervals of time for the measurement of Cu(Ⅱ) ions concentration. After the complete adsorption, an elution test was carried out using 0.1 mol/L HCl solution at a flow rate of 6.0 mL/h. Here, prior to the elution test, the column was washed with distilled water to expel any unbound Cu(Ⅱ) ions. The eluted Cu(Ⅱ) ions concentration was analyzed as before.
3 Results and discussion
3.1 Effect of biomass modification on Cu(Ⅱ) adsorption
The work done by BAIG et al[18] on the binding of Pb(Ⅱ), Cu(Ⅱ), Ni(Ⅱ), Cd(Ⅱ), Zn(Ⅱ), Cr(Ⅲ) and Cr(Ⅵ) ions to the inactivated biomass of Solanum elaeagnifolium suggested that carboxyl groups(―COOH) are responsible to some extent for the binding of metal ions. This means that increasing the number of carboxylate ligands in the biomass can enhance the metal binding capacity. Cellulose, pectin, hemicellulose, and lignin, which are major constituents of OP, contain methyl esters that do not bind metal ions significantly. However, these methyl esters can be modified to carboxylate ligands by treating the biomass with a base such as sodium hydroxide, thereby increasing the metal-binding ability of the biomass. The hydrolysis reaction of the methyl esters is as follows:
R―COOCH3+NaOH=R―COO-+CH3OH+Na+ (2)
Therefore, chemically modifying the biomass increases the number of carboxylate ligands, which can enhance the binding ability of the biomass. The metal-binding capacities of the raw and NaOH treated biomass are compared in Table 1. The results clearly show that SOP is 1.3 times more effective than OP for the adsorption of Cu(Ⅱ) ions.
Table 1 Effect of biomass modification on Cu (Ⅱ) adsorption at pH value of 5.3, contact time of 1 h, ρ0 of 50 mg/L, adsorbent dosage of 4 g/L, and temperature of 25 ℃
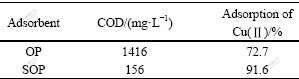
In addition, after adsorption by SOP, the solution of Cu(Ⅱ) ions is colorless, but after adsorption by OP, it is yellow. The fact may be due to the outflow of pigment in OP when agitated with Cu(Ⅱ) ions solution, which leads to very high COD of solution. However, most pigment and other soluble organic compounds contained in the OP could be removed by modification process[19], so SOP is more stable and makes the solution have a low COD.
3.2 Adsorbent characterization
The scanning electron micrographs clearly reveal the surface texture and morphology of the adsorbent (Fig.1). The surface morphology of OP is different from that of SOP. After being treated with sodium hydroxide, SOP has more irregular and porous structure than OP, and therefore more specific surface area. This surface characteristic will substantiate the higher adsorption capacity. The surface areas of OP and SOP are observed to be 0.83 and 1.17 m2/g by BET method, respectively.
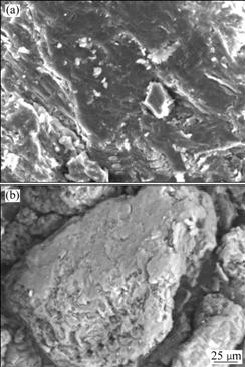
Fig.1 SEM images of OP (a) and SOP (b)
The zeta potentials of OP and SOP in the pH range of 2.0-7.0 were measured. The results are shown in Fig.2. Total negative charge is found to be 0.58 mmol/g for OP and 1.10 mmol/g for SOP. The zeta potential and total negative charge of adsorbent are mainly dependent on the amount of ―COOH and ―OH attached onto the surface of the adsorbent[20]. The zeta potentials of OP and SOP increase (become more negative) directly with the increase of the solution pH value, indicating that the negative charge on the surface of OP and SOP augments with increasing alkalinity of the solutions. This effect is certainly caused by the ionisation of the ―COOH and ―OH groups. At the same pH value, the zeta potentials of SOP are more negative than those of OP and total negative charge of SOP is more than that of OP, which indicate that the amount of ―COOH in SOP is more than that in OP because the methyl ester groups were converted to carboxylate ions by modifying OP with sodium hydroxide, which facilitated the electrostatic interaction with cations[21].
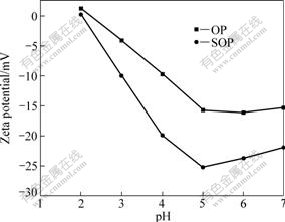
Fig.2 Zeta potentials of OP and SOP
The FTIR spectra of OP and SOP are shown in Fig.3. The broad and intense absorption peaks at 3 410 cm-1 correspond to the O―H stretching vibrations of cellulose, pectin, absorbed water, hemicellulose, and lignin. The peaks at 2 924 cm-1 can be attributed to the C―H stretching vibrations of methyl, methylene and methoxy groups. The peaks at 1 744 cm-1 and 1 638 cm-1 in the OP spectrum indicate the ester carbonyl (C=O) groups and carboxylate ion stretching band (COO-), respectively[22]. The vibrations at 1 430-1 455 cm-1 can be due to aliphatic and aromatic (C―H) groups in the plane deformation vibrations of methyl, methylene and methoxy groups. The peak at 1 057 cm-1 can be assigned to the C―O stretching vibration of carboxylic acids and alcohols. For FTIR spectrum of the SOP, weakening intensity of the peak at 1 744 cm-1 indicates that the methyl esters are hydrolyzed with NaOH and ester group is converted to carboxylate ions.
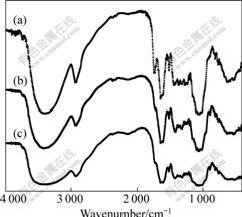
Fig.3 FTIR spectra of OP (a) and SOP before Cu binding (b) and after Cu binding (c)
Different adsorption mechanisms including complexation, ion exchange, and electrostatic attraction may be involved in the adsorption process. Fig.3 also shows FTIR spectra of the SOP before and after metal ions adsorption. After Cu(Ⅱ) adsorption, ―OH stretching vibration is shifted to 3 436 cm-1. The significant shift of this specific peak to the lower wavenumber after the metal ions adsorption suggests that chemical interactions between the metal ions and the hydroxyl groups (OH―) occur on the biomass surface. The carboxyl (C=O) peak is observed at 1 622 cm-1 for Cu(Ⅱ)-loaded biomass. In addition, after loading metal ion, the peak of C―O groups shifts to 1 085 cm-1. These results indicate that the functional groups mentioned above are mainly involved in the adsorption of Cu(Ⅱ) onto the biomass [23].
3.3 Effect of pH value on Cu(Ⅱ) ions adsorption
It is well known that pH value affects the protonation of the functional groups on the biomass as well as the metal chemistry[24]. The effect of pH value on Cu(Ⅱ) ions adsorption capacity on SOP is shown in Fig.4. At low pH value, the amount of Cu(Ⅱ) adsorption is small. There is an increase in copper adsorption with pH value increasing from 2.5 to 4.5. The highest adsorption efficiency is observed between pH 4.5 and 6.0. These observations can be explained by the fact that at lower pH values, the surface charge of the biomass is positive and cations adsorption is not favorable. Meanwhile, hydrogen ions compete strongly with metal ions for the active sites, which results in less adsorption. When the pH value is increased, electrostatic repulsion between cations and surface sites and the competing effect of hydrogen ions decrease, and consequently the metal adsorption increases[25].
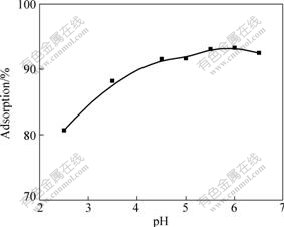
Fig.4 Effect of pH value on Cu(Ⅱ) absorption on SOP at ρ0 of 50 mg/L, adsorbent dosage of 4 g/L, contact time of 1 h and temperature of 25 ℃
3.4 Effect of contact time and adsorption kinetics
Cu(Ⅱ) adsorption capacity was determined as a function of time to determine an optimum contact time for the adsorption of Cu(Ⅱ) ions on SOP. Fig.5 shows the results of the adsorption equilibrium of Cu(Ⅱ) ions on SOP against time. From Fig.5, there is rapid adsorption kinetics within 10 min and adsorption equilibrium can be attained within 1 h. Therefore, 1 h of contact time was chosen as the optimum adsorption time for the experimental studies to ensure that equilibrium conditions can be achieved.
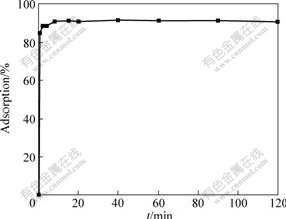
Fig.5 Adsorption kinetics of Cu(Ⅱ) ions at pH value of 5.3, ρ0 of 50 mg/L, adsorbent dosage of 4 g/L and temperature of 25 ℃
analyzed using pseudo-second order[26]:
 (3)
(3)
The kinetics of Cu(Ⅱ) ions adsorption on SOP was where k2 (g/(mg・min)) is the constant of pseudo-second- order rate; qe (mg/g) is the adsorption capacity at equilibrium; and qt (mg/g) is the adsorptions capacity at time t (min). The equilibrium adsorption capacity qe and the pseudo-second-order rate constant k2 can be experimentally determined from the slope and the intercept of the plot t/qt against t. The graphical interpretation of the data for the second-order-kinetic model is given in Fig. 6. As shown in Fig.6, the good fit (R2=1) is obtained and the theoretical values of qe also agree very well with the experimental values, which indicates that the adsorption conforms to the pseudo-second-order mechanism and the adsorptions rate is controlled by chemical adsorption. The value of k2 obtained from the plot is 1.739 g/(mg・min) and the value of qe is calculated as 11.46 mg/g.
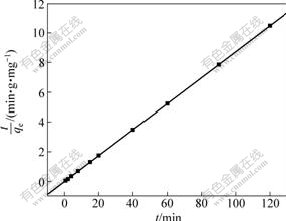
Fig.6 Pseudo-second-order plot
3.5 Effect of initial concentrations and adsorption isotherms
Fig.7 shows the experimental adsorption isotherm for Cu(Ⅱ) adsorption onto SOP when the initial concentration of Cu(Ⅱ) varies between 25 and 400 mg/L at 25 ℃. Two isotherm models, Langmuir and Freundlich, were used to describe the equilibrium data. The amount of Cu(Ⅱ) adsorbed qe (mg/g) at equilibrium metal concentrations of ρe (mg/L) can be defined by the Langmuir equation as
 (4)
(4)
where qm is monolayer capacity of the adsorbent (mg/g); and b is the adsorption constant (L/mg). The plot of ρe/qe vs ρe should be a straight line with a slope of 1/qm and an intercept of 1/(qmb) when the adsorption follows the Langmuir equation.
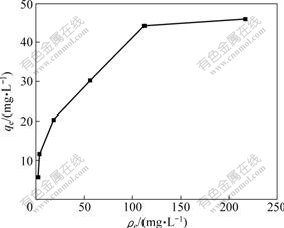
Fig.7 Adsorption isotherm of Cu(Ⅱ) ions at pH value of 5.3, contact time of 1 h, adsorbent dosage of 4 g/L and temperature of 25 ℃
The Freundlich equation can be expressed as
 (5)
(5)
where KF and 1/n are Freundlich isotherm constants related to adsorption capacity and intensity of adsorptions, respectively. If Eq.(5) is applied, a plot of lg qe vs lg ρe will give a straight line of slope 1/n and intercept lg KF. The estimated parameters of the two models were evaluated by regression analysis. The correlation coefficients obtained from the Langmuir equations and Freundlich equations are 0.991 2 and 0.974 9, respectively. Equilibrium data agree well with the Langmuir model. The values of qm and b are found to be 50.25 mg/g and 0.045 L/mg, respectively. The values of KF and 1/n are found to be 5.42 and 0.422, respectively. According to the Langmuir equation, the maximum adsorption capacity (qm) of Cu(Ⅱ) ions on SOP is 50.25 mg/g, which is higher than that on OP (qm=35.56 mg/g).
3.6 Column adsorption and elution experiments
The performance of SOP in continuous operation was studied via column runs by percolating Cu(Ⅱ) ions solution at pH value of 5.3. Fig.8 shows a typical breakthrough curve for Cu(Ⅱ) ions, using a column packed with 0.10 g of SOP at a feed concentration of 50 mg/L of Cu(Ⅱ) ions. The breakthrough occurs at 58 bed volumes (BV) while complete saturation is achieved at 350 BV. The effective adsorption capacity calculated from Fig. 8 is 33.50 mg/g, which is lower compared with adsorption capacity (50.25 mg/g) of batch experiments. In batch experiments the mixture is shaken continuously and good interaction between the solid and solute is achieved. In the fixed bed, adsorbent is packed in the column and the surfaces of the solid particles are in contact with each other and therefore result in less solid-solute interaction. Further, liquid channeling that results in poor solid-metal ion contact and less residence time may occur in the column[27]. Therefore, column adsorption capacities are lower compared with those of batch operation.
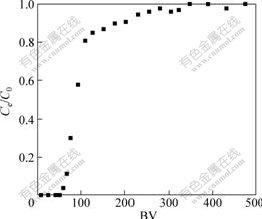
Fig.8 Column adsorption test results for Cu(Ⅱ) ions on SOP
After complete saturation of the column, an elution test was carried out. The results are shown in Fig.9. The desorption/elution of Cu(Ⅱ) ions is found to be very efficient because the eluted amount of Cu(Ⅱ) ions calculated from Fig.9 is 33.23 mg/g, which is 99.2% of the adsorbed Cu(Ⅱ) ions. This amount is eluted by the use of a small amount of eluant (0.1 mol/L HCl) in a short time.
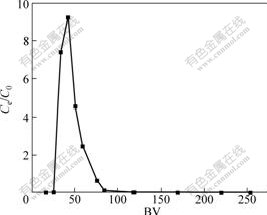
Fig.9 Elution test results of adsorbed Cu (Ⅱ) ions from SOP by using 0.1 mol/L HCl
4 Conclusions
1) Sodium hydroxide is used for modifying OP and therefore enhances its removal efficiency for Cu(Ⅱ) ions in comparison with OP.
2) The adsorption performance of SOP on Cu(Ⅱ) ions is significantly affected by initial pH value and metal concentration. The maximum adsorption efficiency is 91.6% at 25 ℃, ρ0=50 mg/L, pH 5.3 and 4 g/L adsorbent dosage. Adsorption kinetic is found to be best-fit pseudo-second order equation. The adsorption equilibrium data fit well to the Langmuir isotherm. The maximum adsorption capacity is found to be 50.25 mg/g.
3) FTIR results verify the changes of the surface properties of adsorbent materials after the modification of OP and reveal that the carboxyl and hydroxyl groups are involved in Cu(Ⅱ) ions adsorption.
References
[1] DEMIRBAS A. Adsorptions of lead and cadmium ions in aqueous solutions onto modified lignin from alkali glycerol delignications [J]. J Hazard Mater, 2004, 109: 221-226.
[2] NAMASIVAYAM C, RANGANATHAN K. Removal of Cd(Ⅱ) from wastewater by adsorptions on “waste” Fe(Ⅲ)/Cr(Ⅲ) hydroxide [J]. Water Res, 1995, 29: 1737-1744.
[3] OZSOY H D, KUMBUR H. Adsorptions of Cu(Ⅱ) ions on cotton boll [J]. J Hazard Mater, 2006, B136: 911-916.
[4] LIANG S, GUO X, FENG N, TIAN Q. Adsorption of Cu2+ and Cd2+ from aqueous solution by mercapto-acetic acid modified orange peel [J]. Colloids Surf B: Biointerfaces, 2009, 73: 10-14.
[5] JEON C, NAH I W, HWANG K. Adsorptions of heavy metals using magnetically modified alginic acid [J]. Hydrometallurgy, 2007, 86: 140-146.
[6] SULOCHANA N, INBARAJ B S, SELVARANI K. Removal efficiency of copper and nickel by plant materials [J]. Ind J Environ Prot, 1998, 18: 185-188.
[7] OMAR S B, MARLINE S B, EGILA J N. A note on the binding of nickel and copper ions by cellulosic materials [J]. Bioresou Technol, 1993, 43: 63-65.
[8] GABALLAH I, GEY D, ALLAIN E, KILBERTUS G, THAURONT J. Recovery of copper through decontamination of synthetic solutions using modified barks [J]. Metall Mater Trans, 1997, B28: 13-23.
[9] NAKAJIMA A, SAKAGUCHI T. Recovery and removal of uranium by using plant wastes [J]. Biomass, 1990, 21: 55-63.
[10] FENG N, GUO X, LIANG S. Kinetic and thermodynamic studies of the biosorption of Cu(Ⅱ) by chemically modified orange peel [J]. Trans Nonferrous Met Soc China, 2009, 19: 1365-1370.
[11] LIANG S, GUO X, FENG N, TIAN Q. Application of orange peel xanthate for the adsorption of Pb2+ from aqueous solutions [J]. J Hazard Mater, 2009, 170: 425-429.
[12] SREEDHAR M K, ANIRUDHAN T S. Preparation of an adsorbent by graft polymerization of acrylamide onto coconut husk for mercury (Ⅱ) removal from aqueous solution and chloralkaliindustry wastewater [J]. J Appl Polym Sci, 2000, 75: 1261-1269.
[13] ANIRUDHAN T S, NOELINE B F, MANOHAR D M. Phosphate removal from wastewaters using a weak anion exchanger prepared from a lignocellulosic residue [J]. Environ Sci Technol, 2006, 40: 2740-2745.
[14] UNNITHAN M R, VINOD V P, ANIRUDHAN T S. Synthesis, characterizations and applications as a chromium(Ⅵ) adsorbent of amine-modified polyacrylamide-grafted coconut coir pith [J]. Ind Eng Chem Res, 2004, 43: 2247-2255.
[15] MATHEICKAL J T, YU Q, WOODBURN G M. Biosorption of cadmium(Ⅱ) from aqueous solutions by pre-treated biomass of marine alga Durvillaea potatorum [J]. Water Res, 1999, 33: 335-342.
[16] TING Y P, PRINCE I G, LAWSON F. Uptake of cadmium and zinc by the alga Chlorella vulgaris: Ⅱ. Multi-ion situation [J]. Biotechnol Bioeng, 1991, 37: 445-455.
[17] MARSHALL W E, WARTELLE L H, BOLER D E, JOHNS M M, TOLES C A. Enhanced metal adsorption by soybean hulls modified with citric acid [J]. Bioresour Technol, 1999, 69: 263-268.
[18] BAIG T H, GARCIA A E, TIEMANN K J, GARDEA- TORRESDEY J L. Adsorption of heavy metal ions by the biomass of Solanum elaeagnifolium (Silverleaf night-shade) [C]//ERICKSON L E. Proceedings of the 10th Annual EPA Conference on Hazardous Waste Research. Washington DC: USA Environmental Protection Agency, 1999: 131-139.
[19] NOELINE B F, MANOHAR D M, ANIRUDHAN T S. Kinetic and equilibrium modelling of lead(Ⅱ) sorption from water and wastewater by polymerized banana stem in a batch reactor [J]. Sep Purif Technol, 2005, 45: 131-140.
[20] FENG N, GUO X, LIANG S. Adsorption study of copper (Ⅱ) by chemically modified orange peel [J]. J Hazard Mater, 2009, 164: 1286-1292.
[21] WANG H, ZHOU A, PENG F, YU H, YANG J. Mechanism study on adsorption of acidified multiwalled carbon nanotubes to Pb(Ⅱ) [J]. J Colloid Inter Sci, 2007, 316: 277-283.
[22] GNANASAMBANDAM R, PROTOR A. Determination of pectin degree of esterification by diffuse reflectance Fourier transform infrared spectroscopy [J]. Food Chem, 2008, 68: 327-332.
[23] SAR A, TUZEN M, UIU?ZL? ? D, SOYLAK M. Biosorption of Pb(Ⅱ) and Ni(Ⅱ) from aqueous solution by lichen (Cladonia furcata) biomass [J]. Biochem Eng J, 2007, 37: 151-158.
[24] YANG J, VOLESKY B. Biosorptions of uranium on Sargassum biomass [J]. Water Res, 1999, 33: 3357-3363.
[25] AKSU Z. Equilibrium and kinetic modelling of cadmium(Ⅱ) biosorptions by C. vulgaris in a batch system: Effect of temperature [J]. Sep Purif Technol, 2001, 21: 285-294.
[26] HO Y S, MCKAY G. The kinetics of sorptions of basic dyes from aqueous solutions by sphagnum moss peat [J]. Can J Chem Eng, 1998, 76: 822-827.
[27] AMARASINGHE B M W P K, WILLIAMS R A. Tea waste as a low cost adsorbent for the removal of Cu and Pb from wastewater [J]. Chem Eng J, 2007, 132: 299-309.
______________________
Foundation item: Project(50774100) supported by the National Natural Science Foundation of China
Corresponding author: GUO Xue-yi; Tel/Fax: +86-731-88836207; E-mail: xyguo@mail.csu.edu.cn
(Edited by CHEN Wei-ping)

