
J. Cent. South Univ. (2021) 28: 1786-1796
DOI: https://doi.org/10.1007/s11771-021-4629-6

A prediction method of operation trend for large axial-flow fan based on vibration-electric information fusion
GU Zhen-yu(������), ZHU Yao-yao(�숐��), XIANG Ji-lei(�����), ZENG Yuan(��Բ)
College of Automation, Chongqing University, Chongqing 400044, China
 Central South University Press and Springer-Verlag GmbH Germany, part of Springer Nature 2021
Abstract: As the critical equipment, large axial-flow fan (LAF) is used widely in highway tunnels for ventilating. Note that any malfunction of LAF can cause severe consequences for traffic. Specifically, fault deterioration is suppressed tremendously when an abnormal state is detected in the stage of early fault. Thus, the monitoring of the early fault characteristics is very difficult because of the low signal amplitude and system disturbance (or noise). In order to overcome this problem, a novel early fault judgment method to predict the operation trend is proposed in this paper. The vibration-electric information fusion, the support vector machine (SVM) with particle swarm optimization (PSO), and the cross-validation (CV) for predicting LAF operation states are proposed and discussed. Finally, the results of the experimental study verify that the performance of the proposed method is superior to that of the contrast models.
Key words: large axial-flow fan; early fault; state prediction; particle swarm optimization
Cite this article as: GU Zhen-yu, ZHU Yao-yao, XIANG Ji-lei, ZENG Yuan. A prediction method of operation trend for large axial-flow fan based on vibration-electric information fusion [J]. Journal of Central South University, 2021, 28(6): 1786-1796. DOI: https://doi.org/10.1007/s11771-021-4629-6.
1 Introduction
Large axial-flow fan (LAF) is one of the critical equipments for ventilating in highway tunnels. Due to the poor natural ventilation capacity, especially for the extra-long tunnels with 10 km or even longer, the malfunction of LAF often causes serious consequences. Furthermore, one more intractable problem is that the installation positions of the LAF in the highway tunnel are far from the downtown, which takes too much time to fix the machine for the repairman. Obviously, it makes the consequences worse. The paper comes from a highway company in Chongqing, China. The company is responsible for the operation of the expressway in Chongqing. Chongqing is a mountainous city, and the number of tunnels is very large. To ensure traffic safety, the company has to keep the high frequencies of on-site inspection. Thus, the inspection and maintenance costs are very high.
Early fault detection is an effective tactics to solve the above problems. It helps to reduce the unscheduled shutdown and is often applied to support predictive maintenance [1]. In this tactics, the running state of the LAF is monitored in real-time. When an abnormal state is detected or predicted, a warning signal is produced. Then the machine is inspected and maintained before the abnormalities develop into significant faults. As a result, the fault deterioration is suppressed tremendously. Thus, it is of great significance to carry out fault prediction research of LAFs and strengthen the capability of running state diagnosis during the operation of LAF.
The prediction and diagnosis of the operation trend of LAF are categorized into two main approaches: prediction technology based on analytical models and data-driven prediction technology [2]. The diagnostic accuracy of the model-based approaches is usually directly related to the mathematical model. It is a challenging task to build an enough accurate mathematical model. Thus, the model-based approaches have unavoidable limits in practical applications. Compared with the model-based approaches, data-driven approaches do not need much understanding of the deterioration mechanism of LAF, and are just constructed by using historical data. With the development of machine learning technology, the data-driven approaches have been widely applied for fault detection. For instance, XU et al [3] achieved operation state detection of fans based on the symmetrized dot pattern analysis. SONG et al [4] presented an index for the fault state measurement based on the vibration signal and verified the significance by field experiments with axial fans. ZHANG et al [5] used raw vibration signals as input and constructed the deep learning model to achieve fault diagnosis. ZHANG et al [6] considered the vibration signal as the state character for fault diagnosis, and presented the chaos and fractal theory to predict the fault state. These methods mainly analyzed the vibrations in the time domain or frequency domain with signal processing techniques. However, due to the unstable and nonlinear characteristics of early fault vibration signals, the extracted information often has various uncertainties. It is easy to ignore or misjudge the early fault [7].
Another data-driven approach called intelligence diagnosis is based on multi-source information fusion [8-11], achieves condition monitoring, and fault detection, which analyzes the relationship among the operating parameters from historical data. The relationship models can be developed by using techniques including k-nearest neighbors (KNN) [12,13]. Compared with other intelligent diagnostic technologies, SVM has better performance for solving small samples, nonlinear and high-dimensional classification problems [14-16]. It has been widely used in the LAF fault state prediction [17]. In this paper, the running state of the LAF is divided into the normal state and the abnormal state, which belongs to a two-category problem. Due to the small number of abnormal state samples, this paper takes the SVM model as a classifier to predict the running state of LAF. In general, vibration signal analysis is one of the most common and effective ways of fault feature extraction. However, for LAFs, the filtering effect of the fan housing on the vibration signal results in the poor measured signal (insensitive to internal faults, and the timeliness of fault diagnosis) [18, 19]. Therefore, a new parameter, electric parameter information, with the vibration signal is integrated in this paper. The electric parameter has the advantages of convenient acquisition, high precision, strong anti-interference ability, as well as a large amount of information about the operation state of LAF. Finally, an experiment is conducted to verify the feasibility and effectiveness of the proposed method. The main contributions of this paper include: 1) an operation state model of LAF is established based on vibration-electric information fusion, and 2) a machine learning classification method based on PSO-CV-SVM is designed to predict the operation trend.
2 Operation state model of LAF based on vibration-electrical information fusion
2.1 Characteristic parameters
How to select the appropriate parameters to characterize the operation state is the key problem of operation trend prediction. In general, the parameters include vibration, electric, the volume of flow and atmospheric pressure [20, 21]. The volume of flow refers to the gas quantity, which passes through the outlet section of the fan per unit time. There is always a gap between the parts, so that the gas leakage is inevitable. Therefore, the volume of flow can be expressed as:
 (1)
(1)
where Qth is the theoretical volume of flow; Q is the volume of flow; q is the volume of gas leakage. The volume efficiency ��q can be described as follows:
 (2)
(2)
Atmospheric pressure refers to the energy difference of the gas between the inlet and outlet section per unit area, which is expressed by ��p. Gases from import to export need to overcome resistance. Thus, the atmospheric pressure can be expressed as:
 (3)
(3)
where ��pth is the theoretical pressure; ��ph is the flow loss. The flow efficiency ��p can be described as follows:
 (4)
(4)
Electric parameters include motor speed, voltage, current, power, etc. One of the most critical parameters is power, which can be divided into shaft power, internal power, and effective power. Shaft power is the power needed to drive the fan, which is expressed by Ps. Internal power is the energy per unit time of the obtained gas, which is expressed by Pi. Effective power is the energy obtained by the gas that passing through the impeller, which is expressed by Pe. From the definition of pressure, the energy per unit volume of gas passing through the fan is ��Pth, and if the volume flow is Qth, the internal power can be expressed as follows:
 (5)
(5)
After considering flow loss ��ph and leakage loss q, the effective power is as follows:
 (6)
(6)
Generally, we take the shaft power as the output power of the motor. If set ��e as the efficiency of LAF, shaft power can be described as:
 (7)
(7)
According to the above equations, we may find that the parameters of flow volume and atmospheric pressure are related to power. Therefore, it can be said that when the running states changes, the power will also change accordingly [22]. By comparison, it is easier to get the power information and the gained data are more reliable. Furthermore, the vibration signal analysis is still one of the most widespread and effective method among the existing methods of early fault diagnosis. Therefore, the vibration signal and power information are selected as characteristic parameters in this paper.
2.2 Operation state model
Based on the selected characteristic parameters, the operation state feature vector Fea can be constructed as:
 (8)
(8)
where Vib is the feature vector of vibration and Pow is the feature vector of power.
In the actual sampling processes, the sampling frequency is high and the correlation among instantaneous sampling values within a certain range is strong, which has great influence on the accuracy of the prediction. To better reflect state changes, we take N sampling points as a data segment. Then the corresponding time series data segment at the moment ti can be expressed as:
 (9)
(9)
It follows from the principle of sensitivity and stability that the feature vector (FeaX) of this data segment can be constructed as:
 (10)
(10)
where Xran, Xrms, Xstd and Xkur denote the range, root means square, standard deviation, and kurtosis of the data segment respectively. The kurtosis denotes the deviation from the normal state, which is particularly sensitive to the early fault diagnosis. The calculation formulas are given as follows:
 (11)
(11)
 (12)
(12)
 , where
  (13)
(13)
 , where
  (14)
(14)
Then Vib and Pow can be expressed as:
 (15)
(15)
 (16)
(16)
Substitute Eqs. (15) and (16) into Eq. (8), then Fea can be expressed as:

 (17)
(17)
After the normalization, the feature vector of the sampling data segment ti can be described as:
 (18)
(18)
Take m sampling cycles as a group, then the operation state model is established as follows:
 (19)
(19)
3 Prediction method of operation trend for LAF based on PSO-CV-SVM
3.1 Prediction process
Due to the unstable and nonlinear characteristics of early slight faults, especially those early slight faults, the extracted information often has various uncertainties. It is easy to ignore or misjudge the early slight faults. The principle of the method is to train the SVM model by the labeled data with normal state and abnormal state, and classify the operation state of LAF by the operation state model by the trained SVM model. The appearance of abnormal state is caused by the deterioration of early slight faults. The prediction process mainly consists of three steps, i.e., data collection, constructing eigenvectors and prediction (see Figure 1). The first two steps have been discussed in Section 2, and the SVM algorithm is discussed in the following section.

Figure 1 Flow chart of prediction process
3.2 SVM model
As a generalized classifier, SVM can provide a more compact solution to complex nonlinear problems than neural networks sometimes. In the actual situation, it is difficult to obtain enough samples to guarantee the accuracy of the prediction. Thus, the key problem lies in solving the multi-dimensional nonlinear small samples. Most of the models established by the traditional prediction methods based on SVM cannot accurately reflect the complex internal structure, which results in loss of information and distortion of results [23]. Therefore, an SVM model based on PSO-CV is designed, and the training of the SVM model is mainly comprised of the following five steps.
Step 1: The extracted vibration signal and electric parameter values are regarded as the input of the model.
Step 2: About 70% of the samples are used as the training set of the model and the rest is used for testing.
Step 3: Training samples are used in training the SVM with the initialized kernel function and its parameters.
Step 4: The PSO-CV algorithm is used to obtain optimal parameters.
Step 5: The performance of the built PSO-CV-SVM model is verified by testing samples.
3.2.1 Principle of SVM algorithm
For a linear separable sample set (xi, yi), where xi is a sample point in N-dimensional space;  where yi is the corresponding labels of xi. ��1�� and ��-1�� indicate the normal and abnormal operation trend states of LAF, respectively. Thus, it is a two-category problem that a decision function is constructed by the given sample points. We aim to classify the samples as accurately as possible and maximize the margin. The maximum margin is the optimal hyperplane, and the equation is given as follows:
 (20)
(20)
where ��T is the transpose of the weight vector ��, and b is the distance from the origin to the plane. The above equation must satisfy the following constraints:
 (21)
(21)
The distance of hyperplane is  The maximum
  is necessary to find maximum classification margin, which is equivalently transformed to a quadratic programming problem.

 (22)
(22)
According to the Lagrange function, the above problem can be represented as a maximum problem of the following function Q(x).
 (23)
(23)
where ��i and ��j are the Lagrange multipliers corresponding with xi, xj. The decision function f(x) is obtained by solving the maximum of Q(x) as follows.
 (24)
(24)
where  is the optimal value of ��i; b* is the classification threshold value.
For those linear inseparable problems, the sample point is mapped to a high dimensional space, which is converted into a linear problem by introducing kernel function K(xi, xj).
 (25)
(25)
The slack variable �� is used to prevent the occurrence of interference to a few error sample points.  is multiplied by penalty coefficient C and added to the objective function to measure the loss. The optimization problem is converted as follows:

 (26)
(26)
3.2.2 Parameter optimization of kernel function based on PSO-CV algorithm
A radial basis function (RBF) is a type of kernel function of supervised artificial neural network, which uses supervised machine learning to function as a nonlinear classifier. RBF uses more sophisticated functions than simple linear classifiers with lower-dimensional vectors [14]. Therefore, RBF is usually chosen as the kernel function, and it is expressed as:
 (27)
(27)
where parameter gamma is used to control the radial range of function whose default value is 1/k (k is the number of categories) [24]. The selection of appropriate parameter values is of vital importance to the SVM model and affects the final classification accuracy in SVM. In this paper, the combination of PSO and CV is utilized for parameter optimization. The PSO-CV-SVM classification method is proposed for the LAF fault state prediction.
Firstly, the cross-validation (CV) is to inspect the property of the model. The main idea of CV is that the training sample set is divided into k subsets on average. A subset is selected as the validation set, and the other subsets are used as the training set [25]. In this way, a total of k models can be obtained, and the average of the classification accuracy of the final validation set is used as the index to evaluate the characteristic parameters C and gamma. Secondly, the PSO algorithm is used to search the optimal parameters. Particle swarm optimization (PSO) has the advantages of fast convergence speed, fewer adjustment parameters, and better optimization effects as a global optimization technique [26]. The PSO algorithm searches the optimal solution through iteration after initializing a group of random particles. Suppose the swarm has m particles in N-dimensional search space. The position and velocity of the i-th particle are expressed in xi=(xi1, xi2, ��, xiN), vi=(vi1, vi2, ��, viN) with i=1, 2, ��, m. The velocity and position of each particle are generated and updated as follows.
 (28)
(28)
where i=1, 2, ��, m and n=1, 2, ��, N; k denotes the number of iterations; c1 and c2 denote constant values; r1 and r2 are ranged in [0, 1] randomly; w denotes inertia weight; vin is restricted to the [-vmax, vmax], where vmax is a constant value; pin and pgn denote the optimal position searched by the i-th particle and the whole particle swarm, respectively. The iteration would be stopped while the optimal position searched by particle swarm met the fitness threshold or reached the maximum iteration.
PSO-CV algorithm aims at finding the parameters C and gamma by PSO iteration. In each iteration, the CV method is used to train the constructed model via the value of parameters C and gamma found by each particle. Then the training model is used to predict the rest of the data set to achieve the prediction precision. The flow chart of the PSO-CV algorithm is given as follows.
4 Experimental
4.1 Introduction of experimental platform
The experimental platform mainly includes a large axial-flow fan (SDF-4), NI data acquisition device, LEM current and voltage acquisition sensor, the related three-phase power distribution equipment, and some auxiliary exhaust devices and fixed devices.
The large axial-flow is SDF-4 series of Zi Blower Company Ltd. in Zibo, Shandong Province, China.The rated voltage is 380 V. The blast capacity is 136-172 m3/min. The wind pressure is 251-2156 Pa and the rotational speed is 2900 r/min. Its power is 2.2��2 kW due to a counter-rotating fan.

Figure 2 Flow chart of PSO-CV algorithm
The NIcDAQ-9174 is a signal acquisition card slot that can simultaneously run seven hardware timing operations from analog, digital and counter channels. NI234 is an acceleration sensor with a sampling rate of 51.2 kS/s and NIcDAQ-9923 is a data acquisition card. The acquisition frequency of LEM (LTS6-NP/LV25-P) is up to 1000 Hz.
4.2 Data collection
The steps of the data collection are given as follows:
Step 1: Starting the LAF and waiting until the fan is running stable. Keeping the speed at 2900 r/min. The sampling frequency is 1 kHz, which is a continuous sampling. The current, voltage, and vibration acceleration values of the LAF are respectively collected by sensors. From the beginning of the experiment to the end of the recording, at least 500 sets of samples need to be collected continuously, and at least three consecutive times.
Step 2: In addition to the normal operation data, it is also necessary to simulate fault to collect the continuous abnormal operation data. Considering that the abnormal operation data of LAF are hard to be obtained, it is necessary to simulate the abnormal operation of LAF artificially to collect data. The simulated fault experiment is mainly based on the principle of the common fault.
4.3 Test performance and evaluation indicators
A three-step approach is used to estimate and evaluate the performance of the proposed model. In the first step, the eigenvectors of a single parameter and multi-parameter are respectively considered as input of the SVM model. The combination of parameters is used to measure the property of the model by comparative experiment in the second step. In the last step, the experimental results with the highest accuracy are obtained by the parameter optimization, which is integrated into an experiment to conclude. The performance of models is evaluated based on the following metrics: accuracy (ACC), F1-socre, precision (PRE), and Matthews correlation coefficient (MCC).
 (29)
(29)
 (30)
(30)
 (31)
(31)
 (32)
(32)
where TP denotes the predictive value and actual value are true; FP denotes the predictive value and actual value are true and false, respectively; FN denotes the predictive value and actual value are false and true, respectively; TN denotes the predictive value and actual value are false; ACC characterizes the proportion of correctly classified observations; PRE reflects the ability of the model to distinguish negative samples; F1-score is the harmonic mean of precision and sensitivity; MCC is a correlation coefficient between actual classification and forecast classification.
4.4 Experimental verification
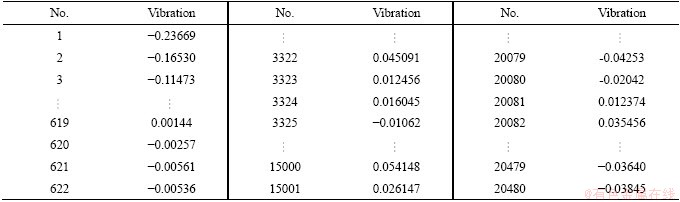
According to the steps of Section 4.2, data are collected. After data processing, the normalized data are shown in Tables 1 and 2.
In Table 1, the data of No. 619-629 indicate the power value obtained from the abnormal operation trend, which is caused by the way of manually hanging heavy objects on the fan blades. The data of No. 3322-3329 indicate the power value of the abnormal operation trend of friction, which is caused by setting obstacles to interfere with the rotation of blades.
Table 1 Normalized data of power

Table 2 Normalized data of vibration
According to Section 2.2, the range, root mean square, standard deviation, kurtosis of power value, and the mean, peak, kurtosis, and root mean square of vibration signal are calculated, respectively. The characteristic data of LAF is shown in Table 3, which is filtered out exception values by setting the upper and lower percentiles.
Figure 3 shows the data distribution of the sample data set and calculates the eigenvector waveform of the power and vibration according to the above steps. The training set of SVM model is established by the actual normal trend sample and abnormal trend sample. Considering the difficulty in obtaining abnormal trend samples in actual production, four-fault types (imbalance, misalignment, loosening of bearing base, and rubbing fault) are tested, and five groups of each abnormal trend samples are selected as training samples to verify the reliability of the proposed method. The rest is the normal trend data samples. The number of training and testing samples selected is 350 and 144, respectively. The features before and after parameter fusion are used as the input of the SVM model, which is shown in Figures 4-6.
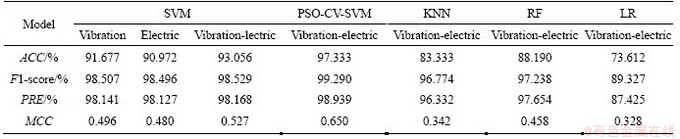
As shown in the above figures, the SVM exhibits better performance of operation state prediction for LAF based information fusion than those achieved by a single parameter. Because the performance of RBF-SVM is influenced greatly by the scale parameter, we design the PSO-CV algorithm to obtain the optimal SVM classifier parameters based on the multi-parameters fusion, which is shown in Figure 7. To evaluate the performance of the proposed PSO-CV-SVM algorithm, the contrast experiment with different models is conducted in Table 4.
In each different run of the program, PSO first generates random values for parameters, and then it searches for better values of them that produce better fitness. After several iterations, the algorithm converges to the best values of the C and gamma of the model. As is seen in Figure 7, the proposed algorithm successfully finds the global optimum just with about 20 iterations during training. As reported in Table 4, the accuracy of the PSO-CV-SVM classifier with information fusion is 97.333%, and C and gamma are equal to 13.515 and 13.6811, respectively. Indeed, the classification accuracy of vibration-electric information fusion is equal to 93.056% for the SVM model which is better than other models except the PSO-CV-SVM model. Each evaluation index shows that PSO-CV-SVM has the highest precision among all the models.
Table 3 Characteristic data of power and vibration
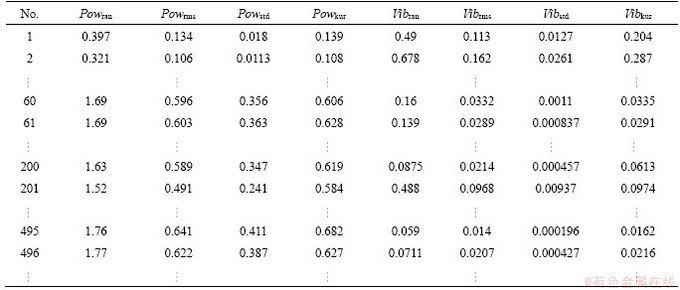
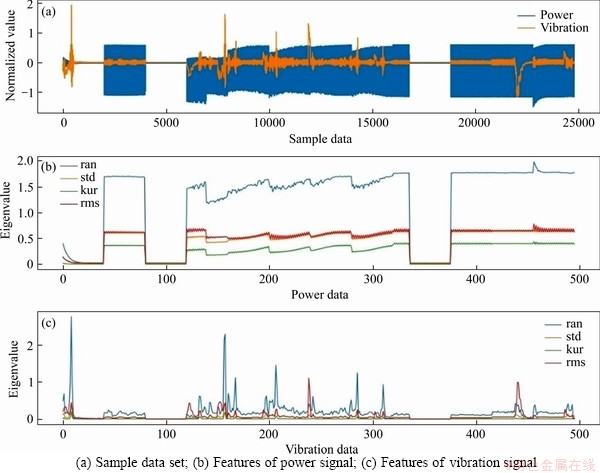
Figure 3 Sample data set and eigenvector waveform:
5 Conclusions
A method for judging early fault of LAFs by predicting operation trends is proposed. Note that the single parameter is unstable and difficult to characterize the operation state of LAF from multi-views, the vibration and power are selected as the characteristic parameters, and the operation state model of LAF based on vibration-electrical information fusion is constructed, which can well describe the running state of LAF. Then, a PSO-CV-SVM model is designed to predict the operation trend of LAF combined with the PSO-CV parameter optimization algorithm.
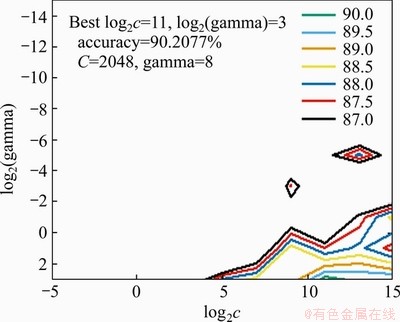
Figure 4 Parameters optimization diagram of SVM based on vibration signal

Figure 5 Parameters optimization diagram of SVM based on electric parameter
The paper gives the following two insights:
1) In comparison with a single vibration signal, multi-parameters fusion as the input of the model obtain better performance.
2) PSO-CV-SVM classifier with information fusion has higher prediction accuracy in running trend prediction.
The limitations of this paper: 1) The method validation is carried out in a specific experimental environment, and 2) due to the influence of random interference, the prediction accuracy of PSO-CV-SVM model may decrease under the on-site working environment, which finally influences the fault warning performance. Therefore, the future works include: 1) collecting more data from the worksite to verify and analyze the method, and integrating more parameters to improve the applicability of the method; 2) applying the prediction model for industrial application better and improving the universality in practical applications.
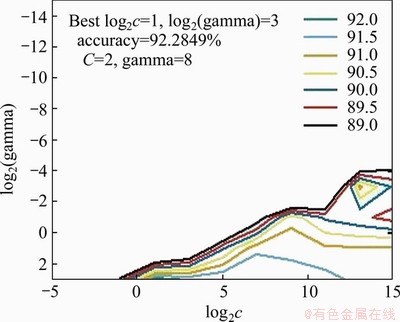
Figure 6 Parameters optimization diagram of SVM based on vibration-electric fusion

Figure 7 Parameters optimization diagram of PSO-CV-SVM model
Table 4 Accuracies of classification
Contributors
GU Zhen-yu provided the concept and edited the draft of manuscript. ZHU Yao-yao conducted the literature review and wrote the first draft of the manuscript. XIANG Ji-lei edited the draft of manuscript. And ZENG Yuan analyzed the calculated results.
Conflict of interest
GU Zhen-yu, ZHU Yao-yao, XIANG Ji-lei and ZENG Yuan declare that they have no conflict of interest.
References
[1] REN L, XU Z Y, YAN X Q. Single-sensor incipient fault detection [J]. IEEE Sensors Journal, 2011, 11(9): 2102-2107. DOI: 10.1109/JSEN.2010.2093879.
[2] LV Y, FANG Fang, YANG Ting-ting, ROMERO C E. An early fault detection method for induced draft fans based on MSET with informative memory matrix selection [J]. ISA Transactions, 2020, 102: 325-334. DOI: 10.1016/j.isatra. 2020.02.018.
[3] XU Xiao-gang, LIU Hai-xiao, ZHU Hao, WANG Song-ling. Fan fault diagnosis based on symmetrized dot pattern analysis and image matching [J]. Journal of Sound and Vibration, 2016, 374: 297-311. DOI: 10.1016/j.jsv.2016.03.030.
[4] SONG Yong-xing, WU Ke-lin, CHU Ning, WU Zhuan-wu. Research on fault diagnosis method of metro fan based on modulation intensity [J]. Chinese Journal of Turbomachinery, 2019, 61(1): 77-81. DOI: 10.16492/j.fjjs.2019.01.0011.(in Chinese)
[5] ZHANG Wei, PENG Gao-liang, LI Chuan-hao, CHEN Yuan-hang, ZHANG Zhu-jun. A new deep learning model for fault diagnosis with good anti-noise and domain adaptation ability on raw vibration signals [J]. Sensors (Basel, Switzerland), 2017, 17(2): E425. DOI: 10.3390/s17020425.
[6] ZHANG Zhong-yun, WU Jian-de, MA Jun, WANG Xiao-dong. Slight fault diagnosis for rolling bearing based on chaos and fractal theory [J]. Journal of Central South University (Science and Technology), 2016, 47(2): 640-646. (in Chinese)
[7] WEN Cheng-lin, LV Fei-ya, BAO Zhe-jing, LIU Mei-qin. A review of data driven-based incipient fault diagnosis [J]. Acta Automatica Sinica, 2016, 42(9): 1285-1299. DOI: 10.16383/ j.aas.2016.c160105. (in Chinese)
[8] TANG Jian, QIAO Jun-fei, WU Zhi-wei, CHAI Tian-you, ZHANG Jian, YU Wen. Vibration and acoustic frequency spectra for industrial process modeling using selective fusion multi-condition samples and multi-source features [J]. Mechanical Systems and Signal Processing, 2018, 99: 142-168. DOI: 10.1016/j.ymssp.2017.06.008.
[9] DURO J A, PADGET J A, BOWEN C R, KIM H A, NASSEHI A. Multi-sensor data fusion framework for CNC machining monitoring [J]. Mechanical Systems and Signal Processing, 2016, 66-67: 505-520. DOI: 10.1016/j.ymssp. 2015.04.019.
[10] LU Chuan-qi, WANG Shao-ping, WANG Xing-jian. A multi-source information fusion fault diagnosis for aviation hydraulic pump based on the new evidence similarity distance [J]. Aerospace Science and Technology, 2017, 71: 392-401. DOI: 10.1016/j.ast.2017.09.040.
[11] WAN S T, PENG B. Early fault diagnosis method of rolling bearing based on nonlocal mean denoising and fast spectral correlation [J]. Journal of Central South University (Science and Technology), 2020, 51(1): 76-85. DOI: 10.11817/ J.ISSN.1672-7207.2020.01.010. (in Chinese)
[12] SONG Bing, TAN Shuai, SHI Hong-bo, ZHAO Bo. Fault detection and diagnosis via standardized k nearest neighbor for multimode process [J]. Journal of the Taiwan Institute of Chemical Engineers, 2020, 106: 1-8. DOI: 10.1016/ j.jtice.2019.09.017.
[13] HU Juan, PENG Hong, WANG Jun, YU Wen-ping. kNN-P: A kNN classifier optimized by P systems [J]. Theoretical Computer Science, 2020, 817: 55-65. DOI: 10.1016/j.tcs. 2020.01.001.
[14] XU Fan, TSE P W. A method combining refined composite multiscale fuzzy entropy with PSO-SVM for roller bearing fault diagnosis [J]. Journal of Central South University, 2019, 26(9): 2404-2417. DOI: 10.1007/s11771-019-4183-7.
[15] DENG Wu, YAO Rui, ZHAO Hui-min, YANG Xin-hua, LI Guang-yu. A novel intelligent diagnosis method using optimal LS-SVM with improved PSO algorithm [J]. Soft Computing, 2019, 23(7): 2445-2462. DOI: 10.1007/s00500-017-2940-9.
[16] LI Zhong-mei, GUI Wei-hua, ZHU Jian-yong. Fault detection in flotation processes based on deep learning and support vector machine [J]. Journal of Central South University, 2019, 26(9): 2504-2515. DOI: 10.1007/s11771-019-4190-8.
[17] LIU B, NING Q, LIU C X, AI Q, HE P. Residual life prediction of rolling bearings based on continuous hidden Markov model and PSO-SVM [J]. Journal of Computer Applications, 2019, 39(S1): 31-35. (in Chinese)
[18] HUANG Hong-zhong, HUANG Cheng-geng, PENG Zhao-chun, LI Yan-feng, YIN Heng-su. Fatigue life prediction of fan blade using nominal stress method and cumulative fatigue damage theory [J]. International Journal of Turbo & Jet-Engines, 2020, 37(2): 135-139. DOI: 10.1515/tjj-2017-0015.
[19] FOUCHE L B, UREN K R, SCHOOR G V. Energy-based visualisation of an axial-flow compressor system for the purposes of fault detection and diagnosis [J]. IFAC-PapersOnLine, 2016, 49(7): 314-319. DOI: 10.1016/ j.ifacol.2016.07.311.
[20] DURO J A, PADGET J A, BOWEN C R, KIM H A, NASSEHI A. Multi-sensor data fusion framework for CNC machining monitoring [J]. Mechanical Systems and Signal Processing, 2016, 66-67: 505-520. DOI: 10.1016/j.ymssp. 2015.04.019.
[21] LU Chuan-qi, WANG Shao-ping, WANG Xing-jian. A multi-source information fusion fault diagnosis for aviation hydraulic pump based on the new evidence similarity distance [J]. Aerospace Science and Technology, 2017, 71: 392-401. DOI: 10.1016/j.ast.2017.09.040.
[22] PEETERS C, GUILLAUME P, HELSEN J. Vibration-based bearing fault detection for operations and maintenance cost reduction in wind energy [J]. Renewable Energy, 2018, 116: 74-87. DOI: 10.1016/j.renene.2017.01.056.
[23] LONG X F, YANG P, GUO H X, WU X W. Review of Fault diagnosis methods for large wind turbines [J]. Power System Technology, 2017, 41(11): 3480-3490. (in Chinese)
[24] KUO B C, HO H H, LI C H, HUNG C C, TAUR J S. A kernel-based feature selection method for SVM with RBF kernel for hyperspectral image classification [J]. IEEE Journal of Selected Topics in Applied Earth Observations and Remote Sensing, 2014, 7(1): 317-326. DOI: 10.1109/JSTARS. 2013.2262926.
[25] JIANG Gao-xia, WANG Wen-jian. Error estimation based on variance analysis of k-fold cross-validation [J]. Pattern Recognition, 2017, 69: 94-106. DOI: 10.1016/j.patcog. 2017.03.025.
[26] TAO Peng, LIU Jian, LIANG Tian-xi. Research on fault diagnosis method of axial flow induced draft fan of power plant based on machine learning [C]// 2019 4th International Conference on System Reliability and Safety (ICSRS). Rome, Italy: IEEE, 2019: 325-330. DOI: 10.1109/ICSRS48664. 2019.8987662.
(Edited by HE Yun-bin)
���ĵ���
������-�������Ϣ�ںϵĴ������������������Ԥ�ⷽ��
ժҪ����������ʽͨ�����Ϊ��·����ͨ��Ĺؼ��豸���õ��˹㷺��Ӧ�á���������������κι��϶����ܶԽ�ͨ������غ������������ڹ��Ͻ��ܼ��쳣״̬���Ϳ��Լ�������ƹ����ӻ�����Դ�������������ϳ��ڱ��������ԣ��Լ��ɷ����Ƕ����źŵ��˲����ã����µ������źŶ��ڲ����ϲ����У��������ܹ�����ϼ�ʱ�Բ�����ȵ͵����⣬���һ�ֻ������ź�-������Ϣ�ںϵĴ��������������Ԥ�ⷽ��������ȡ������������Ϊ����Ⱥ�ͽ�����֤�Ż���֧��������������ʵ����������������Ƶ�Ԥ�⡣ʵ�����������÷������������ڻ�������
�ؼ��ʣ�����������������ڹ��ϣ�״̬Ԥ�⣻����Ⱥ�Ż��㷨
Foundation item: Project(2018YFB2002100) supported by the National Key R&D Program of China
Received date: 2020-06-22; Accepted date: 2020-10-26
Corresponding author: GU Zhen-yu, PhD, Associate Professor; Tel: +86-18723001932; E-mail: gzy@cqu.edu.cn; ORCID: https://orcid. org/0000-0002-3488-2107

