


Trans. Nonferrous Met. Soc. China 22(2012) 510-515
Effect of Re element on oxidation resistance of Ni3Al-Mo based alloys at 1150 ℃
CHENG Yang, ZHANG Heng, SONG Li-wen, MA Yue, LI Shu-suo, GONG Sheng-kai
School of Materials Science and Engineering,Beijing University of Aeronautics and Astronautics, Beijing 100191, China
Received 9 September 2011; accepted 18 January 2012
Abstract: The isothermal oxidation behaviors of three kinds of Ni3Al-Mo based alloys at 1150 °C were studied. The morphology, structure and element distribution of oxide scales of the alloys were researched by scanning electron microscopy, X-ray diffraction and electron probe microanalysis. The research results show that there are three oxide layers, an outer layer of NiO, an intermediate layer mainly composed of NiO, NiAl2O4 and a small amount of NiMoO4, and an inner layer of NiAl2O4 and Al2O3. Re element was mainly distributed in the intermediate layer, which plays a role as “diffusion barrier” in the process of oxidation, and effectively reduces the diffusion rate of Al and Mo elements outward and diffusion rate of O element inward. As a result, a Al-rich oxide layer formed in the inner layer inhibits the growth of oxide layer and improves the oxidation resistance of the alloy.
Key words: Ni3Al-Mo based alloy; Re element; isothermal oxidation
1 Introduction
Excellent mechanical and oxidation resistance properties are required for the materials used in turbine blades of industrial gas turbines or jet engines, owing to their harsh environment in service [1-3]. In the Ni3Al-based alloys, substrate is γ′ phase and strengthening phase is γ phase. Mo element can strengthen both γ and γ′ phases [4-6]. MACKAY et al [7, 8] and GIAMEI et al [9] had found that the addition of 14% Mo (mass fraction) had a superior high temperature mechanical property, but excessive Mo element would reduce oxidation resistance of the alloys. Solid-solution strengthening effect of Re element is superior to Mo element, 80% of Re element which entered into γ phase could improve γ phase dislocation activation energy. Re-Re atom cluster could hinder the dislocation motion, and improve creep rupture life of the alloys [10-12]. In addition, Re element with a large atom radius and small diffusion coefficient could hamper the diffusion of elements, such as Mo and Al, which was helpful for the enhancement of oxidation resistance of the alloys. CZECH et al [13] had indicated that the alloys with the content of high Re element had better oxidation resistance, and effect of Re element became more significant above 1000 °C.
The purpose of this work is to improve oxidation resistance of the alloy, but not reduce its mechanical property by adding Re element instead of partial Mo element. Furthermore, the aim of this investigation is also to lay theoretical basis for the development of low-cost and high-performance Ni3Al based alloys.
2 Experimental
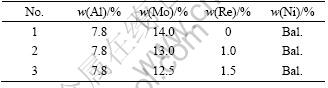
Three kinds of Ni3Al-based alloys used were firstly prepared by applying consumable electrode arc melting in argon atmosphere and cold-wall copper heart vacuum induction melting subsequently. After 10 h heat treatment at 1300 °C, the cast ingots were annealed at 870 °C for 32 h and furnace-cooled. The composition of experimental alloys determined by chemical analysis is given in Table 1.
Samples for oxidation experiment at 1150 °C were all with dimensions of 8 mm×8 mm×8 mm and were cut along the axis of ingots which was parallel to the casting direction. The surfaces of the samples were ground to 2000# SiC paper, and polished both before and after high-temperature exposure, in order to eliminate the defects and the oxidation scale. The specimens were degreased in acetone, ultrasonically cleaned in alcohol and dried in hot air.
Table 1 Composition of experimental alloys
The tests of oxidation kinetics of three kinds of Ni3Al-based alloys were performed at 1150 °C for 100 h. The Al2O3 crucibles in which samples were put were heated at 1300 °C for 10 h to eliminate effect of wet crucibles.
Specimens were put into the homogenous temperature zone of a tubular furnace. After appropriate time intervals followed by HB5828-2000, the specimens were taken out of the tubular furnace, cooled in air, and then the gain mass of samples weighed using an electronic balance with a precision of 0.001 mg. Five specimens were simultaneously tested at each time interval and the average values of mass gain of five samples were used to plot the oxidation kinetic curve.
The morphology of surface and cross-section of specimens were observed on a CS-3400 scanning electron microscope (SEM). The distribution of elements in the oxide layers was analyzed by electron microprobe analysis (EPMA: JEOL EPMA 1610). The microstructure and composition of the oxide phases were analyzed by energy-dispersive X-ray analysis (EDX) and X-ray diffraction and (XRD: D/max 2500 PC, Cu Kα 50 kV/300 mA).
3 Results and discussion
3.1 Oxidation kinetics
Figure 1(a) shows the oxidation kinetic curve of mass gain of the alloys oxidized at 1150 °C for 100 h. In the initial oxidation period of 20 h, the trend of mass gain of the alloys was similar. After 20 h, mass gain of the alloy without Re element addition increased quickly, but mass gain of the alloys containing Re element augmented far below the alloy without Re element. In addition, the alloys including Re element showed mass gain slowly until 100 h. When the oxidation time reached 100 h, mass gain of the alloy without Re addition was 11.08 mg/cm2, 1% Re alloy 5.09 mg/cm2, and 1.5% Re alloy 4.81 mg/cm2. Figure 1(b) shows the oxidation rate of mass gain of the alloys. The oxidation rate of alloy at initial stages was all somewhat high, but gradually declined at longer time and entered to a stable stage. The oxidation rate of the alloy 1.5%Re element at the steady stage was scarcely any. So, it is suggested that adding Re element into alloy instead of partial Mo element reduced significantly oxidation rate of the alloy and improved the oxidation resistance of the alloy.
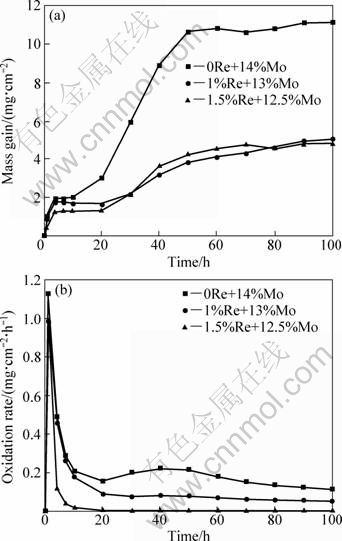
Fig. 1 Oxidation kinetics curves (a) and oxidation rate curves (b) of experimental alloys oxidized at 1150 °C for 100 h
Figure 2 shows the parabolic rate constant of the alloys oxidized at 1150 °C for 100 h. The parabolic rate constant kp was calculated by a linear least-squares algorithm:
kp=(Δm/S)2/t (1)
where Δm/S is the oxidation mass gain per unit surface area (mg/cm2); t is the oxidation time (h).
The oxidation mechanism can be characterized by kp. When the relationship between kp and time is straight line, oxidation kinetics of the alloy follows a parabolic oxidation law. According to Fig. 2, the relationship between kp and time is not linear. On the basis of Wagner’s theory, oxidation mechanism of the alloys does not abide by the parabolic oxidation law; it may explain that the oxidation process of the alloys was not chiefly controlled by elements diffusion. On one hand, mass gain of the specimens resulted from oxidation reaction; on the other hand, the volatilization of MoO3 led to mass loss of the samples. The oxidation processes of the alloys were dominated by combining action both oxidation reaction and the volatilization of MoO3.
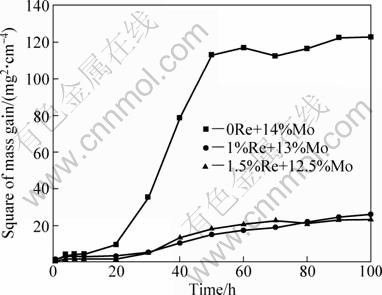
Fig. 2 Square of mass gain per unit area vs time for experimental alloys oxidized at 1150 °C for 100 h
3.2 Adherence condition between oxidation scales and substrate
The reveal of adherence circumstance of oxidation scales and substrate cannot only depend on oxidation kinetic curve of mass gain in the alloys. So, oxidation kinetic curve of mass loss of the specimens was drawn in order to comprehensively evaluate the oxidation resistance of the alloys.
The oxidation kinetic curves of mass loss of samples oxidized at 1150 °C for 100 h are illustrated in Fig. 3(a). The oxidation scales of samples containing Re element did not spall obviously, compared with the samples of the alloy without Re element. When the oxidation was over 60 h, the mass of the samples including Re element did not increase significantly, but continuously reduced slightly. On one hand, it clearly indicated that the samples without Re was provided with the poor adherence condition between the oxidation scales and substrate. Meanwhile, it had implied the counterbalance between volatilization of MoO3 and mass gain through oxidation reaction at the later stage of oxidation. Oxidation rate of samples is explained in Fig. 3(b). It can be drawn from Fig. 3(b) that the alloy without Re element addition presented a higher oxidation rate and oxidation rate of the alloys including Re element was barely at the later oxidation stage, which signified that the alloy without Re did not reach a steady state and the alloys including Re element could achieve a relative balance condition between oxidation reaction and the volatilization of oxide. Because of the weak combination of oxide scales and substrate, the surface of the alloys did not form a compacted oxidation layer to protect the alloy.
3.3 Composition and structure of oxide scales
3.3.1 X-ray diffraction
The structure of the oxides formed on the surface of the alloys and the exfoliated scales oxidized at 1150 °C for 100 h were determined by XRD, as illustrated in Fig. 4. The oxides of the alloys are predominantly NiO, NiAl2O4 with a few of NiMoO4. Morphology of NiO in Fig.5 is a big equiaxial-crystal shape, which easily cracked along the grain boundary. In addition, NiO formed mostly in the outer oxidation layer and exfoliated effortlessly as it has more thermal expansion coefficient and faster growth rate to be 103-104 times that of Al2O3. During the entire oxidation process, it was difficult to produce protective and continuous oxide scales for the reason that both Al2O3 and MoO3 combined with NiO to create to NiAl2O4, NiMoO4 [14].
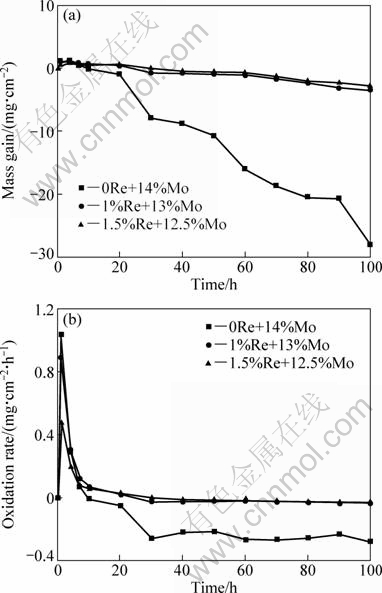
Fig. 3 Oxidation kinetics curves (a) and oxidation rate curves (b) of experimental alloys oxidized at 1150 °C for 100 h
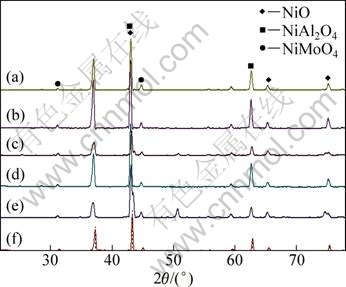
Fig. 4 XRD patterns of oxides formed on surface of alloys and exfoliated scales oxidized at 1150 °C for 100 h: (a) Alloy without Re, surface; (b) Alloy without Re, oxide; (c) Alloy with 1%Re, surface; (d) Alloy with 1%Re, oxide; (e) Alloy with 1.5%Re, surface; (f) Alloy with 1.5%Re, oxide
3.3.2 Surface morphologies of samples
Figure 5 presents the surface morphologies of the alloys oxidized at 1150 °C for 100 h. The morphology of alloy without Re exhibits a rugged appearance, and a large number of protruding parts is mainly NiO with abnormally growing crystal particles. Both sides of protruding parts are less and sparse oxide particles, that is, at the depression zones oxides analyzed by EDS are chemically composed of 14.32Ni-29.56Al-56.12O (molar fraction, %), similar to NiAl2O4 [15]. The local surface is relatively flat and there were obvious tiny cracks, which caused the weaker combination among granules. Spinel NiAl2O4 located on the surface of the specimens is with a variety of morphologies, including spherical, granular, and relatively continuous shape. From Fig. 5, it can be seen that there is obvious difference in surface morphologies of the alloys between without Re and with Re element, which is commonly composed of NiO, NiAl2O4, and NiMoO4.
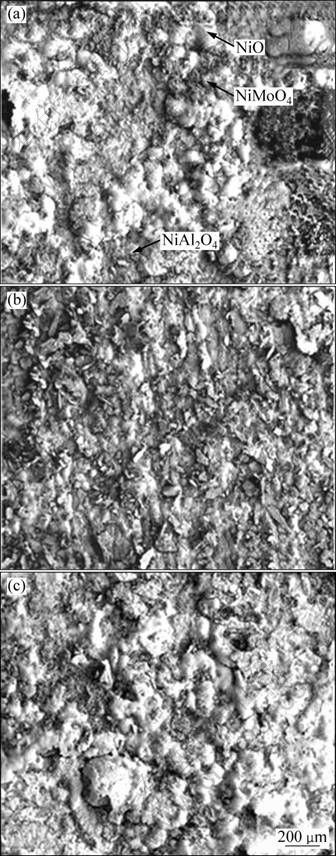
Fig. 5 Surface morphologies of alloys oxidized at 1150 °C for 100 h: (a) Alloy without Re; (b) Alloy with 1%Re; (c) Alloy with 1.5%Re
3.3.3 Cross-sectional microstructure of samples
Figure 6 shows the cross-sectional microstructure of the specimens oxidized at 1150 °C for 100 h. It is observed that the oxide scales were composed of three layers, including NiO layer, mixed oxide layer of NiO, NiAl2O4 and a small amount of NiMoO4, and an inner Al-rich layer of NiAl2O4 and Al2O3. Figure 6 reveals that thickness of the entire oxidation scales reduced and thickness of the Al-rich layer increased remarkable along with increasing Re element in alloy. Thickness values of oxide scales of the alloys without Re, with 1%Re alloy and 1.5%Re were respectively approximately 150, 90 and 30 μm. The condition of uneven oxidation of the alloy without Re is more serious than the alloys with Re element. According to the EDS analysis, there is predominately blocky NiO in the outer layer, and NiAl2O4, NiMoO4 and NiO in the intermediate layer. The inner dark layer named Al-rich layer is composed of the spinel NiAl2O4 and few of Al2O3. The diffusion layer connected with the substrate contains more than 90% Ni element. The interface between diffusion layer and substrate in the alloy without Re is more bent than the alloys with Re element. Figure 7 presents the morphology of the substrate near the diffusion layer. The two-phase (γ phase and γ′ phase) coherency of substrate had been destroyed and γ′ phase gradually dissolved to γ phase.
3.4 Distribution of elements in oxide scales
There are several different oxides formed during the oxidation process in alloys containing Ni, Mo, Al, and Re elements. The Gibbs free energy and growth rate of various oxides are diverse. These alloying elements would result in different effects on oxidation resistance of the alloys.
The distribution of elements of the alloys in the oxide scales is shown in Fig. 8. Because of abundant spallation of NiO, the content of Ni element in oxide scales is lower than that in the substrate. A high concentration of Al element appears at the interface between the mixed oxide layer and the diffusion layer in the alloy, and the thickness of Al-rich zone increases obviously along with the increment of Re element. The content of Mo element is lower than that of the substrate, which emerged in three alloys, as a consequence of the volatilization of MoO3. Concentration of Re element appears obviously in the intermediate oxide layer, where it played a role as diffusion barrier in preventing Mo and Al element outward and O element inward [16].
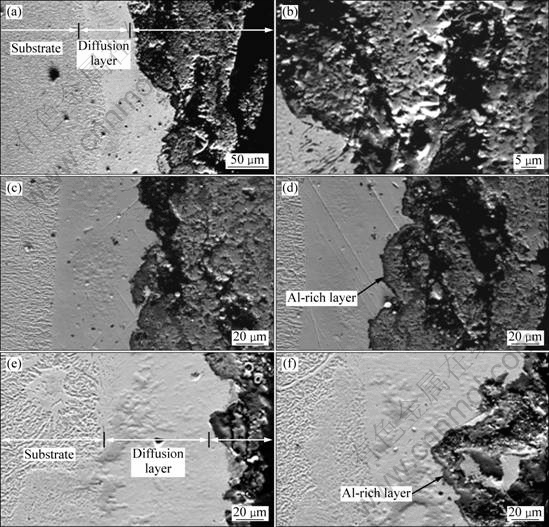
Fig. 6 Cross-section morphologies of samples oxidized at 1150 °C for 100 h: (a), (b) Alloy without Re; (c), (d) Alloy with 1%Re; (e) (f) Alloy with 1.5%Re
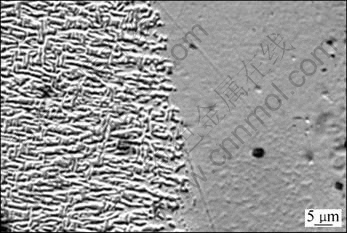
Fig. 7 Morphology of substrate near diffusion layer in alloy without Re
4 Conclusions
1) By adding a few of Re element instead of partial Mo element in the alloy, its oxidation resistance is improved at 1150 °C, of which the level changes from times antioxidation to antioxidation.
2) When the alloys are oxidized at 1150 °C for 100 h, uneven oxidation phenomenon in the alloy without Re element appears and the oxide scales of alloy are composed of NiO, NiAl2O4, NiMoO4 and a few of Al2O3. But the oxidation phenomenon is not found in the alloys including Re element at 1150 °C for 100 h.
3) Re element is mainly concentrated in the intermediate oxide layer, which can prevent the diffusion of Mo and Al outward and O inward. As a result, a compact and continuous inner oxide layer which is rich in Al element forms to slow its oxidation rate and restrain the further incrassation of oxide scales.

Fig. 8 Distribution of elements in cross-sectional oxidation scale oxidized at 1150 °C for 100 h in alloys: (a) Alloy without Re; (b) Alloy with 1%Re; (c) Alloy with 1.5%Re
References
[1] ZHAO J C, WESTBROOK J H. Ultrahigh-temperature materials for jet engines [J]. MRS Bulletin, 2003, 28(9): 622-627.
[2] HU Zhuang-qi, LIU Li-rong, JIN Tao, SUN Xiao-feng. Development of the Ni-base single crystal superalloys [J]. Aircraft Engine, 2005, 31(3): 1-7.
[3] DONG Hong-xing, HE Yue-hui. Progress in research on Ni3Al intermetallic alloys [J]. Materials Science and Engineering of Powder Metallurgy, 2009, 14(2): 83-88. (in Chinese)
[4] ZHANG Jian, LI Jin-guo, JIN Tao, SUN Xiao-feng, HU Zhuang-qi. Effect of Mo concentration on creep properties of a single crystal nickel-base superalloy [J]. Materials Science and Engineering A, 2010, 527: 3051-3056.
[5] ZHANG J, LOU L H. Directional solidification assisted by liquid metal cooling [J]. Journal of Materials Science and Technology, 2007, 23(3): 289-303.
[6] LI Qing, SONG Jin-xia, XIAO Cheng-bo, WANG Ding-gang, HAN Ya-fang. Effect of Al content on microstructure and property of a cast Ni3Al-base alloy with high W and Mo content [J]. Journal of Aeronautical Materials, 2006, 26(5): 10-13.
[7] MACKAY R A,NATHAL M V, PEARSON D D. Influence of molybdenum on the creep properties nickel-base superalloy single crystals [J]. Metallurgical and Materials Transactions A, 1990, 21: 381-387.
[8] MACKAY R A, NATHAL M V. [C]// Micon 86: Optimization of processing properties, and service performance through microstructural control. Philadelphia: ASTM, 1988: 202-210.
[9] GIAMEI A F, PEARSON D D, ANTON D L. High temperature ordered intermetallic alloys [M]. Pittsburgh: MRS, 1985: 293-308.
[10] LI Jia-rong, TANG Ding-zhong, CHEN Rong-zhang. Effect of Re in single crystal superalloys [J]. Materials Engineering, 1997, 8: 3-8.
[11] BLAVETTE D, CARON P, KHAN T. An atom-probe study of some fine-scale microstructure features in Ni-based single crystal superalloys [C]//Superalloys 1988. Pennsylvania: TMS, 1988: 305.
[12] ERICKSON G L. The development and application CMSX-10 [C]//Superalloys 1996. Pennsylvania: TMS, 1996: 35-41.
[13] CZECH N, SCHMITZ F, STAMM W. Improvement of McrAlY coatings by addition of Rhenium [J]. Surf Coat Technology, 1994, 17: 68-69.
[14] FENG Q, TRYON B, CARROLL L J, POLLOCK T M. Cyclic oxidation of Ru-containing single crystal superalloys at 1100 °C [J]. Materials Science and Engineering A, 2007, 458: 184-194.
[15] LI Qing, SONG Jin-xia, XIAO Cheng-bo, WANG Ding-gang, YU Qian, HAN Yan-fang. High temperature oxidation behavior of a Ni3Al base alloy containing high contents of W and Mo [J]. Aeronautical Materials, 2007, 27(2): 6-12.
[16] LIU C T, SUN Xiao-feng, GUAN Heng-rong, HU Zhuang-qi. Effect of rhenium addition to a nickel-base single crystal superalloy on isothermal oxidation of the aluminide coating [J]. Surf Coat Technol, 2005, 194: 111-118.
Re对Ni3Al-Mo基合金的1150 ℃氧化性能的影响
成 阳,张 恒,宋丽文,马 岳,李树索,宫声凯
北京航空航天大学 材料科学与工程学院,北京 100191
摘 要:研究3种Ni3Al-Mo基合金在1150 °C时的静态氧化行为。采用XRD、SEM和EPMA对氧化后试样的表面、截面形貌以及元素在氧化膜的分布进行研究。结果表明:氧化膜主要分为3层,最外层为NiO层,中间层由NiO、NiAl2O4及少量NiMoO4组成,最内层主要由富Al的NiAl2O4、Al2O3组成。Re元素主要分布在中间层,在氧化过程中起到“扩散障”作用,降低Al、Mo元素向外扩散的速率,促使在内层形成富铝氧化膜层以降低氧化速率,提高合金的抗氧化能力。
关键词:Ni3Al-Mo基高温合金;Re;静态氧化
(Edited by YANG Hua)
Foundation item: Project (50971012) supported by the National Natural Science Foundation of China
Corresponding author: MA Yue; Tel: +86-10-82338392; E-mail: mayue@buaa.edu.cn
DOI: 10.1016/S1003-6326(11)61206-5

