
Preparation and analysis of zirconia oxygen sensors
LUO Zhi-an(罗志安), XIAO Jian-zhong(肖建中), XIA Feng(夏 风)
State Key Laboratory of Plastic Forming Simulation and Die and Mould Technology,
Huazhong University of Science and Technology, Wuhan 430074, China
Received 12 April 2006; accepted 25 April 2006
Abstract: Thimble zirconia oxygen sensors were prepared with yttria stabilized zirconia(YSZ). The surfaces of the electrode, electrolyte and their interface were observed by scanning electron microscope(SEM). The sensor was examined with engine bench test to evaluate the essential performance. The results show that the oxygen sensor has good performance, which can meet the demand of practical applications. Chemical equilibrium theory was introduced to explain electromotive force of the sensors and the influence of temperature on the signals. The educed theoretical model of electromotive force agrees well with testing results.
Key words: zirconia oxygen sensor; engine bench test; chemical equilibrium; electromotive force
1 Introduction
Owing to the inherent benefits of low cost, fast response, high sensitivity and feedback controlling, the zirconia oxygen sensors were widely used in the automobile industry to monitor the exhaust gases[1-4]. The emission controlling mechanism is that the sensor quantitatively monitors the instantaneous concentration of the oxygen in the automobile exhaust, and then an electronic control unit(ECU) collects and processes this data to give a feedback to the engine control system. So, in a real-time manner, this system can adjust the air fuel ratio(A/F), or the excessive air coefficient(λ), which is defined as the rate of (A/F)act and (A/F)sto to obtain optimal engine combustion.
The electrochemical principles of the potentiometric oxygen sensor made of zirconia were described elsewhere[5-8]. In brief, the sensor can be regarded as a simple galvanic cell as the following form.
Pt, pref│Zirconia│p(O2), Pt
When temperature rises due to heating and exposing to hot exhaust, the sensor develops an electromotive force(EMF) between the two electrodes. At fixed temperature, the value of EMF is determined by the difference of the oxygen partial pressures between the two electrodes according to the famous Nernst equation.
U=(RT/4F)ln(pref/p(O2)) (1)
where p(O2) is the oxygen partial pressure of the exhaust; pref is the oxygen partial pressure of the reference air; R is the universal gas constant; F is the Faraday constant; T (above 673 K) is the absolute tem- perature of the sensing element.
Many structures and principles of zirconia oxygen sensors were proposed for the measurement of exhaust gas[9-11]. However, because of their reliability or other problems, only the application of thimble-type oxygen sensors was dominated the market of oxygen sensor most successfully. In order to understand the operating principle of the thimble-type oxygen sensors, some zirconia oxygen sensors were prepared and then tested in an engine bench.
In this paper, the relationship between EMF and λ is analyzed, and the influence of the sensor temperature on the EMF output values is discussed according to the test results.
2 Experimental
2.1 Sensor preparation
At 420 K and 100 MPa, 8%(mole fraction) yttria stabilized zirconia(YSZ) with wax and binder was molded into thimble-shape substrate with a powder injection-molding machine. Subsequently, it was degreased and sintered using programmable furnace.Afterward, the internal and external surface was coated with platinum slurry and then sintered at 1 273 K for 1 h. At last, the sensing element with a sandwich-like structure and other parts assembled to form an oxygen sensor, as shown in Fig.1.
2.2 Scanning electron microscope
After sintering, the surface morphology of the YSZ substrate and platinum electrode was observed by a FEI Quanta200 scanning electron microscope(SEM). The microstructure of the interface of electrode and electrolyte was also examined.
2.3 Performance test
The oxygen sensor was evaluated in the typical engine bench test. The schematic diagram of engine bench test setup is shown in Fig.2. The sensor was installed by screws into an exhaust pipe of an engine system. The leads of the heating unit were connected to a 13 V power supply. The electrodes of the sensing element were linked to a voltage data logger. A thermocouple was fixed near the tip of the sensor to measure the gas temperature, and a pressure gauge was used to measure the pressure of the exhaust. The lambda value of the engine operation was monitored with an exhaust analyzer. At the same time, the engine was controlled to keep this value within a certain range by a Jetronic control unit. The exhaust analyzer was calibrated by a standard gas with a known oxygen concentration. The potential output from the sensor was recorded by a voltmeter with internal resistance higher than 1 MΩ. The data was processed with a Y-t recording instrument.
3 Results
3.1 Microstructure of electrode and electrolyte
Fig.3 shows the SEM images of the YSZ electrolyte substrate surface sintered at 1 773 K, platinum electrodes sintered at 1 273 K and interface between the electrode and electrolyte. The YSZ substrate is very smooth and compact, which efficiently enhances the transfer of oxygen ion in the electrolyte at high temperature. This is a preferred microstructure since transfer of oxygen ion need a continuous electrolyte phase. It is obvious that the

Fig.1 Schematic diagram of structure of zirconia oxygen sensor: 1 Lead of heater; 2 Lead of internal electrode; 3 Lock ring; 4 Disk spring; 5 Insulating ceramic; 6 Hexagonal connector; 7 Sensing element with two electrodes; 8 Metallic gasket; 9 Vent hole; 10 Heater; 11 Protecting shield
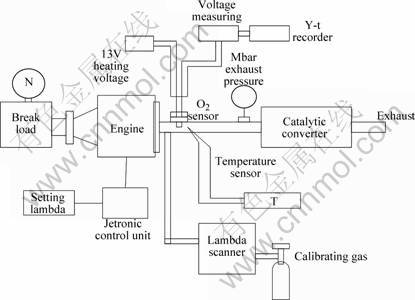
Fig.2 Schematic diagram of engine bench test setup
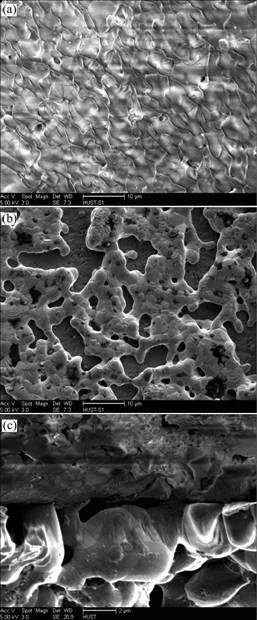
Fig.3 SEM images of YSZ electrolyte surface(a), platinum electrode(b) and interface(c)
electrode surfaces are the interconnecting network with high porosity, which can facilitate the diffusion and adsorption process of oxygen gas on the electrode. It is clear that the platinum metal phase and YSZ electrolyte phase have a good connection, which expands the length of tripe phase boundary, where the metal phase, the electrolyte and the gas phase connect each other, and the electrochemical reaction takes place.
3.2 U―λ curve
Fig.4 shows the variation behaviors of the excessive air coefficient λ and electromotive force U with respect to the testing time at the sensor element temperature of 1 000 K. Through adjusting the injection time, λ slowly increases from 0.78 to 1.2 with a small stride of 0.01 s-1. At the same time, λ and U were recorded. Correspondingly, the U―λ experimental curve is obtained, as shown in Fig.5.
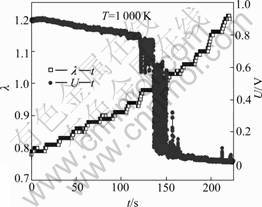
Fig.4 λ―t and U―t curves
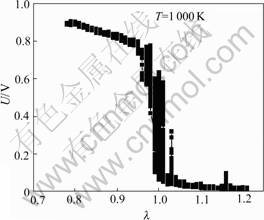
Fig.5 Experimental U―λ curves
It can be seen from Fig.5 that, at 1 000 K, when λ increases from 0.78 to 1, U decreases slightly from approximately 900 mV to about 800 mV. Then, it drops sharply to be less than 160 mV as λ tends to pass 1. It keeps decreasing and the final outputs is lower than 100 mV. The voltage output U shows a step response at the stoichiometric A/F (λ=1). Therefore, by measuring the voltage output U, the detection of the excessive air coefficient, λ, is able to come true.
4 Discussion
The component of the fuel used in the engine of automobile is very complicated, to simplify calculation, the fuel is supposed to be the octane with the molecular formula C8H18 because the component of the fuel used is independent of the value of λ. In addition, the pressure of the exhaust is supposed to be equal to the pressure of the air. When the octane reacts with air in the engine in stoichiometry (λ=1), there is
 (2)
(2)
According to the definition of λ, it is found that
 (3)
(3)
where nair is mole number of the used air when 1 mol C8H18 is burnt; Mair is the mean molecular mass of air;  is the molecular mass of the octane. So, for 1 mol C8H18, the mole number of the used air is nair=12.5λ/0.21.
When λ is more than 1, the burning state is the lean combustion with excessive oxygen. The partial pressure of oxygen is dependant on the excessive air. The lean combustion reaction between the octane and air can be written as

 (5)
(5)
where pΘ is the standard atmosphere pressure.
Substituting this result into Eqn.(1),
 (6)
(6)
When λ is less than 1, the burning state is the rich combustion with excessive fuel, which produces the reducing gases, such as CO and CH compound. Here, the resultant of incomplete combustion is supposed to be CO. The partial pressure of oxygen is dependant on the chemical equilibrium between the reducing gas and oxygen in the exhaust. The rich combustion reaction between the octane and air can be written as
 (7)
(7)
Under this condition, the partial pressure of oxygen is dependent on the chemical equilibrium reaction of CO, CO2 and O2 in the exhaust 2CO2→2CO+O2. The equilibrium constant of this reaction is supposed to be KΘ. Based on Eqn.(7), the equilibrium constant can be written as
 (8)
(8)
where p(CO), p(CO2) and p(O2) are the partial pressure of CO, CO2 and O2, respectively. So it gets
 (9)
(9)
Substituting Eqn.(9) into Eqn.(1), we get
 (10)
(10)
When the temperature of exhaust is 1 000 K for the chemical equilibrium 2CO2→2CO+O2, the thermo- dynamics parameters of CO, CO2 and O2 can be found in Ref.[12] and are listed in Table 1.
 and
and  are the Gibbs free energy under the temperature of T, enthalpy and enthalpy difference under 0 K, respectively.
Table 1 Thermodynamics parameters of CO, CO2 and O2 (T= 1 000 K)


Based on the result and the data in Table 1, we can yield
 (12)
(12)
So
 =-47.06
Substituting this result into Eqn(10), when the temperature of the exhaust is 1 000 K, the EMF of the sensor in rich combustion can be written as follows.
 (13)
(13)
So, when the temperature of the sensing element is 1 000 K, in the rang of λ, according to Eqns.(6) and (13), the λ―U curve is shown in Fig.6.
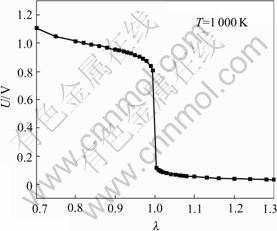
Fig.6 Theoretical U―λ curve
The λ―U curve from the chemical equilibrium theory conforms with the experimental U―λ curve. But when λ<1, the theoretical value is a little more than the measured value from experiment. The reason is that there is the residual oxygen due to incomplete combustion in the exhaust and the pressure of the exhaust is a little more than atmosphere pressure. These factors make the actual partial pressure of oxygen be more than the theoretical partial pressure of oxygen. Therefore, the EMF output of sensor in the rich combustion is a little less than the theoretical value.
Under the rich combustion for the reaction 2CO2→2CO+O2,based on Gibbs-Helmholtz equation[7], for the ideal gas in standard condition, there are the following equation
 (14)
(14)
Take place of above equation with  -RTlnKΘ, we can find
 (15)
(15)
where  >0 is the isobaric reaction heat of material under the standard condition; T is the temperature.
For the equilibrium reaction 2CO2→2CO+O2, the enthalpy difference>0,so (d())/(dT)>0, that is, increases with the rise of the temperature. So, accounting to Eqn.(9), the partial pressure of oxygen in exhaust increases also, then the EMF decreases of the sensor with the rise of the temperature.
In the range of the temperature from 800 to 1 200 K, the value of does not change much. So, can be regarded as a constant. Calculating the integral of above Eqn.(15)
 (16)
(16)
Then Eqn.(16) is simplified as
 (17)
(17)
where I′ is integral constant. Substituting Eqn.(17) into Eqn.(10), we have
 18)
18)
So in the rich combustion, when λ is given, the temperature of the sensor has influence on not only the coefficient of EMF in the Nernst equation, but also the partial pressure of oxygen in the Nernst equation. And accounting to the above equation, the EMF of sensors shows linear dependence on the temperature of sensing element.
In the lean combustion, the temperature of sensors hardly affects the partial pressure of oxygen in the exhaust. And on the base of Eqn.(6) in lean combustion, the EMF of sensors is in direct proportion to the temperature of sensing element.
5 Conclusions
Under 1 000 K, the EMF output in the rich combus- tion condition is higher than 800 mV, and it is less than 100 mV in the lean combustion condition. The λ―U curve in the whole λ range on the base of chemical equilibrium between the products of combustion is obtained, and the theoretical λ―U curve is well consistent with the experimental result.
References
[1] Hamann E, Manger h, Steinke l. Lambda-sensor with Y2O3-Stabilized ZrO2-Ceramic for application in automotive emission control systems [J]. SAE Paper, 1977, 86: 807-823.
[2] Mizusawa k, Katoh k, Hayachi s, HAYASHI H, HOCHO S. Development of air fuel ratio sensor for 1997 model year LEV vehicle [J]. SAE Paper, 1997, 970834: 1362-1373.
[3] Gopel w, Reinhardt g, Rosch m. Trends in the development of solid state amperometric and potentiometric high temperature sensors [J]. Solid State Ionics, 2000, 137: 519-531.
[4] Nakae m, Tsuruta t, Mori r. Development of planar air fuel ratio sensor [J]. SAE Paper, 2002, 112: 995-001.
[5] Riegel j, Neumann h, Wiedemann h m. Exhaust gas sensors for automotive emission control [J]. Solid State Ionics, 2002, 152-153: 783-800.
[6] XIA Feng. The Basic Research on Nonequilibrium ZrO2 Cell [D]. Wuhan: Huazhong University of Science and Technology, 2000.(in Chinese)
[7] Maskell w c, Steele b c h. Solid state potentiometric oxygen sensors [J]. J. Applied Electrochemistry, 1986, 16: 475-485.
[8] ADLER S B, LANE J A, STEELE B C H. Electrode kinetics of porous mixed conducting oxygen electrodes [J]. J Electrochem Soc 1996, 143: 3554-3564.
[9] Kim b k, Lee j h, Kim h. A wide range air fuel ratio sensor with a plate type structure [J]. Solid State Ionics, 1996, 86-88: 1079-1085.
[10] Makino k, Nishio h, Okawa t. Compact thick film type oxygen sensor [J]. SAE Paper, 1999, 108: 1714-1717.
[11] Ramamoorthy r, Dutta p k. Akbar s a. Oxygen sensor: material, methods, designs and applications [J]. Journal of Materials Science, 2003, 38: 4271-4282.
[12] FU Xian-cai, SHEN Wen-xia, YAO Tian-yang. Physical Chemistry [M]. Beijing: Higher Education Press, 2001. (in Chinese)
(Edited by LI Yan-hong)
Corresponding author: XIAO Jian-zhong; Tel: +86-27-87542800; Fax: +86-27-87544307; E-mail: jzxiao@126.com

