
Three-dimensional analysis of elastic stress distribution of indented ceramic surface by finite element method
Tatsuyuki NEZU
Department of Mechanical Engineering, Ichinoseki National College of Techcology, Takanashi, Hagisho Ihinoseki Iwate 021-8511, Japan
Received 10 April 2006; accepted 25 April 2006
Abstract: The three-dimensional stress distributions in the area surrounding indentation pattern for three different materials, Al2O3, Si3N4 and SiC were analyzed by finite element method(FEM). Those theoretical results were also compared with the experimental ones by Rockwell hardness test. The effect of loading stress on the plastic deformation in specimens, surface was investigated on the assumption of shear strain energy theory by Huber-Mises when the materials were indented. The distributions of nomal stress, shear stress, and Mises stress were analysed with variations of loading conditions. It is clear that the analytical results for the stress distributions, the crack length and its density of probability are in good agreement with the experimental results.
Key words: ceramics; stress distribution; three-dimensional; finite element method
1 Introduction
The brittle materials cannot be applied in metal materials when needing plastic property. It is difficult for ceramics to take on mechanical processing such as shearing and grinding. Moreover there are many obstacles when processing into mechanical parts. However, even if the ceramics materials are very brittle, using their special properties and current technology, without taking into account the economy and time, it is possible to prepare comparative complicated shapes. So, to apply such ceramics effectively, it is very important to grasp their mechanical properties. Thus, in order to achieve such strength evaluating criterion, when the three different materials, Al2O3, Si3N4 and SiC were indented, the compressive strength was analyzed and evaluated, which is important owing to the developing of analyzed indentation system[1-3].
According to the above situation, in this study, the three-dimensional stress distributions of indentation pattern for three different materials, Al2O3, Si3N4 and SiC were analyzed. The effect of loading stress on the plastic deformation on test surface was investigated with variations of loading conditions by FEM. According to the indentation pattern, under the assumption of shear
strain energy theory by Huber-mises, the beginning of the plastic deformation and the distributions of loading stress were analyzed. The aim of the paper is to propose the present analysis[4] for the stress distributions, the crack length and its density of probability.
2 Experimental
Al2O3 used in the experiment was from KYOCERA fine ceramics (A-473), Si3N4(SN-220), SiC(SC-211). The mechanical properties of materials are shown in Table 1. Especially, the stress intensity factor K��C was calculated by IF method. IF method refers to the hemicycle or semi-elliptic vertical crack near the indentation during the Vickers indentation test on the surface of brittle ceramics. The value of the crack was evaluated using K��C. The dimensions of samples were 10 mm��20 mm��60 mm. After the samples were ground, the indentation zone and crack-tip were observed by optical microscopy. After corrosion treatment, namely, Al2O3 with 30% NaOH solution, Si3N4 and SiC with 60% HNO3 solution respectively at 70 �� for 5 min, the evaporation of treated samples was observed by scanning electron microscopy(SEM).
Table 1 Mechanical properties of materials

3 Results and discussion
3.1 Evaluation of indentation damage
The Rockwell indenter was forced on test surface with an apex angel of 120?. Usually, the elastic deformation firstly took place, then turned into the plastic deformation as loading up. However, on the very brittle surface of the ceramics, if loading up more, the crack extended around the radius between elastic and plastic zone. The beginning of radial crack and the indentation extending down has been known[5, 6]. The average of the maximum diameter and orthogonal diameter was considered as the representative one. The relationships of diameter, compressive strength and elastic modulus are shown in Fig.1. The indentation diameters descend linearly in order of Al2O3, Si3N4 and
SiC and those compressive strength and elastic modulus are constants respectively. When the samples in the experiment were loaded from 294 N to 1 470 N, the linear slope gradually trends bigger. The porosity, crystal morphology, grain, matrix and relative mechanical properties were close and related one another. The bending strength and K��C vs depth of indentation are shown in Fig.2. With the increasing of the bending strength and K��C, the depth of indentation descended gradually in order of Al2O3, Si3N4 and SiC as loading from 294 N to 1 470 N.

Fig.1 Compressive strength(a) and elastic modulus(b) vs diameter of indentation

Fig.2 Bending strength(a) and K��C(b) vs depth of indentation
3.2 Effect of compressive strength on deformation
Due to the indenter test, an indentation occurred on the test surface, near which was the crack. The typical residual crack patterns on indented surfaces of ceramics are shown in Fig.3. It is concluded that, when loading up to 294 N, the indentation is mainly the crown, extending from the center on radial crack. Especially, when using SiC materials, the indentation extended along the test surface, and turned bigger in turn as loading up. The radical crack extended indented insteaded of linear. The indented crack spreaded to the pores. As a stress raiser, the pores caused partial damage, forming chapping. The change of extending direction ceased the chapping. However, as shown in Fig.4, under the condition of the load p=294 N, the depth indentation of Al2O3, Si3N4 and SiC are 140��90 and 120 ?m, respectively. There is a little error between the calculating ones and testing ones, which resulted from the actual measuring [7-14].
The relation between the diameter of indentation and load is shown in Fig.5.
4 Analysis of data by FEM
4.1 Damage behavior simulation by FEM
Analyzing the damage behaviors, finite elements method was adopted using Marc volume program. The stress distribution, shear stress and mises stress
were analyzed by workstation. The actual deformation was elastic originally, then turned into one in the equilibrant state as the motion of the indenter. Limited by the elements of calculating timeand content, the nodes changed from 754 to 576. These elements were composed of pentahedron of 72 elements and hexahedron of 504 elements. Degrees of freedom of total model didn��t turn compared with x-axis and y-axis, only parallel moving. Due to the body symmetry one-quarter of the indented microarea was used for the calculation, here, the boundary condition was limited to move in the direction of z-axis. The aim was to investigate the inner damage of indentation pattern for three materials, considering the contacted section and the immobility of fixed surface as the boundary condition. Mesh patterns of FEM model under the loading of 294 N are shown in Fig.6. The loading conditions were estimated by analyzing the chapping caused near the indentation region by FEM. It is inapplicable for the given model to carry out the calculating by the method. Therefore, the indentation was proximate taper, whose radius can be decided by the average of 30 samples. The depth of indentation can be obtained by
h(mm)= (100-regidity) ��0.002 (1)
The values are shown in Fig.4. In this case, the stress distribution, shear stress and mises stress were calculated, respectively.
4.2 Elastic damage model and analyzed results by FEM
Analyzing the data according to the indentation pattern, the results of elastic analysis are shown in Fig.7. When the test samples and indenter pressing, the damage does not occur, that is, the stress does not exceed the intension of the materials. It can be deduced deduced where the point of damage took place but difficult to know about the degrees of the damage when analyzing the elastic deformation by

Fig.3 Typical residual crack patterns on indented surface of ceramics at loading of 294 N: (a) Al2O3; (b) Si3N4; (c) SiC
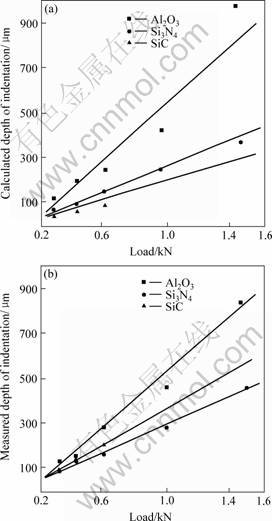
Fig.4 Relation between depth of indentation and compressive load: (a) Load vs calculatd depth of indentation; (b) Load vs measured depth of indentation
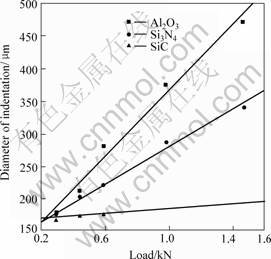
Fig.5 Load vs diameter of indentation
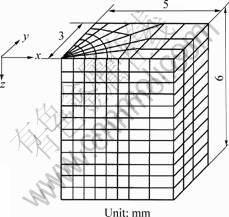
Fig.6 Mesh patterns of FEM model
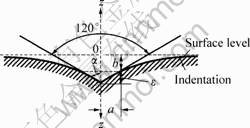
Fig.7 Results of elastic deformation pressed by diamod conical indenter
FEM [15-19]. The analyzing precision depended on the division of elements. When analyzing the indentation of Al2O3, the elastic deformation was analyzed by the adjusted division of elements. The analyzing precision was discussed when analyzing the elastic deformation theoretically, as shown in Fig.6. The Dx-x and Dy-y displacements are shown in Fig.8(a). Among all Dx-x and Dy-y displacements, Dx-x displacement is smaller than that of Dy-y. On the boundary site, the displacements of Dx-x and Dy-y keep the same, and the radial crack is proportional to the elastic deformation amount. The shape of the elastic deformation accords with the extent of the crack. For the x-axis and y-axis, displacements in the direction of z-axis are constant, which has no effect on the axis length, however, in proportion to the depth of crack and the deformation in the direction of z-axis.
Moreover, the stress distributions are shown in Fig.9. For the values of x-axis and y-axis, the stress distributions along the radius near the center of y-axis are bigger than those of x-axis, and there is little difference near the boundary site. While, for the Dx-y and Dy-x, the difference between x-axis and y-axis is little, almost keeps the same near the boundary site.
The crack-tip stresses are shown in Fig.10, respectively. For the Dx-x and Dy-y, there is little difference along the radius. In the direction of cross section, its crack-tip stress in the center of circle varies inversely with the boundary length, and goes to zero away from the center along the radius, about zero. In the direction of x-zx and y-yz, the crack-tip stress has no relationship with x-axis and y-axis, keeping the same, and to the great extent influences the creation of the crack.
The mises stress is shown in Fig.11. The combined stress of compressive stress and crack-tip stress can be seen in Fig.11. The mises stress has no relationship with x-axis and y-axis, keeping the same. Moreover, there is a little difference along the radius. which can be used as the norm for judging thecreation of the crack.

Fig.8 Displacements of Dx-x or Dx-y(a) and Dx-z or Dy-z(b)
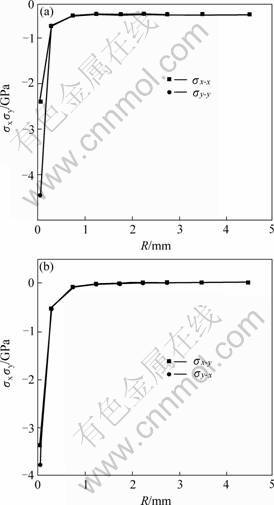
Fig.9 Normal stress distribution of ��x-x or ��y-y(a) and ��x-y or ��y-x
4.3 Crack distributions near indentation and its relationships with Mises stress
Because the radial crack length distributions occurred near the indentation belong to Weibull��s distributions, the shape parameters of distribution in the same material don��t vary with the loading, keeping the constant. However, the size parameters in the same material increase with the increase of the loading. Thus, only the shape parameters are taken as the inherent characteristic values of materials. The crack occurs if the compressive strength is bigger than the bending strength. It can be concluded from Fig.12 that the crack occurs at R��0.08 mm. The Mises stress distributions are identical with its density of probability. Therefore, when the compressive strength increases greatly at R��0.08 mm, it is apt for the crack occurred and the density of probability increased according to the mises strength distributions. Thus, it is suggested that the creation of crack relates with the compressive stress.

Fig.10 Crack-tip shear stress distribution: (a) ��x-xy or ��y-xy; (b) ��x-xz or ��y-xz; (c) ��x-zx or ��y-yx

Fig.11 Mises stress along x and y directions

Fig.12 Mises stress vs probabilisity density
5 Conclusions
In this study, three different materials, Al2O3, Si3N4 and SiC were used to carry out the experiments by Rockwell indenter test. The relationship between loading and crack length was obtained. The stress distribution near the indentation, stress-tip distribution, shear stress and Mises stress were discussed respectively by FEM. The theoretical results were compared with the experimental ones. The following conclusions can be drawn.
1) Whatever kind of materials, the indentation is mainly the crown, the radial crack, the median crack and the lateral crack. The indentation diameter and depth increase linearly as loading up, moreover, the bending strength, the compressive strength, the elastic modulus and the fracture toughness also increase linearly, which shows great relationship with the mechanical properties,reaching the maximal level especially for Al2O3.
2) The radial crack extends the indented shape. When spreading to the pores and the grain bound is damaged, the crack begins to extend. Moreover, the crack ceases in the pore. The pore serves as the place of concentrated stress, the crack occurred for the out lower stress results in the part damage. Therefore, the indented crack on the test surface is stopped because of the pores and the extending direction of crack changed.
3) The depth of indentation by Rockwell indenter test corresponds to the stress distribution by FEM. It is concluded that when Al2O3 crack occurs and if the crack spreads easily depend on the values of mises stress. When the loading is 294 N, for the stress and stress-tip distributions, shear stress and Mises stress of Al2O3 materials, the y deformation is bigger than that of x. Thus, it is apt to bring and spread the radial crack in the direction of x.
4) The crack occurs if the compressive strength is bigger than the bending strength. The density of probability of higher stress is higher than that of the lower. Thus, the crack distributions can be evaluated by Mises stress distributions.
References
[1] HIROSHIGE S, TAKAYOSHI I. Ceramic Strength and Fracture of Materials[M]. Kyouritusyubann, 1992.
[2] HAMADA S, TERAMAE T, GODAI G. Journal of Japan Society of Mechanical Engineers, 1994, A60: 456.
[3] HIROYUKI K, MASAHIRO I, TOORU T. Journal of Japan Society of Mechanical Engineers, 1990, A58: 546.
[4] TENKI Y, KIKUO N. J Ceram Soc Japan, 1996, 104: 121-125.
[5] HIROMASA I, HIROSHI I, TAKERU U. Journal of Japan Society of Mechanical Engineers, 1900, A56: 532.
[6] HAMILTON G M, GOODMAN L E.. Trans ASME Appl Mech, 1966, 33: 371-377.
[7] FRANK F C, LAWN B R. Proc R Soc, 1967, A229: 291-267.
[8] IRWIN G R. Proc 9th Int Congr Appl Mech, 1957, 8: 245-251.
[9] HONSHIN N, IROSHI N. Journal of Japan Society of Mechanical Engineers, 1986, A52: 477.
[10] VARIAS A G, SHINC F. J MechPhys Solids, 1993, 415: 835-841.
[11] KENZIROU K, KOUZI M, MASAKI O. Journal of Japan Society of Mechanical Engineers, 1988, A54: 500.
[12] TETUSHI T, WATARU H, HONSHIN N, TAKAHIRO T. Journal of Japan Society of Mechanical Engineers, 1994, A60: 596.
[13] WATARU H, HONSHIN N, TETUSHI T, TAKAHIRO T. Journal of Japan Society of Mechanical Engineers,1994, A60: 575.
[14] WARREN R. Acta Met, 1978, 26: 1759.
[15] OSAMU S. Journal of the Society of Materials Science, 1988, 37: 152.
[16] JOHNSON K L, O��CONNOR J J, WOODWARD A C. Proc R Sov, London, 1973, 334: 95-101.
[17] AKIMUNE J. Am Cearm Soc, 1990, 98: 25-29.
[18] HONSHIN N, NORIO K. Journal of Japan Society of Mechanical Engineers, 1984, A50: 450.
[19] NOSE T, FUJII T. J Am Ceram Soc, 1988, 71: 328-334.
(Edited by CHEN Wei-ping)
Corresponding author: Tatsuyuki NEZU; Tel: 0191-24-4734; Fax: 0191-24-4734; E-mail: kelvin@ichinoseki.ac.jp

