Trans. Nonferrous Met. Soc. China 23(2013) 128-133
Low temperature synthesis and thermal properties of Ag-Cu alloy nanoparticles
W. BHAGATHSINGH1, A. SAMSON NESARAJ2
1. School of Nanosciences and Technology, Karunya University, Coimbatore-641 114, Tamil Nadu, India;
2. Department of Chemistry, Karunya University, Coimbatore-641 114, Tamil Nadu, India
Received 24 February 2012; accepted 4 September 2012
Abstract: Ag-Cu alloy nanoparticles were synthesized by simple low temperature chemical reduction method using metal salts (acetate/sulphates) in aqueous solution with sodium borohydride as reducing agent. The chemical reduction was carried out in the presence of nitrogen gas in order to prevent the oxidation of copper during the reaction process. The alloy nanoparticles were characterized by XRD, UV-Vis, particle size analysis, EDS, TG-DTA and SEM analysis. From the XRD analysis, the crystallite sizes of the prepared samples were calculated using Scherrer formula and the values were found to be in the range of 15 nm. UV-Vis studies conform the formation of alloy nanoparticles. EDS analysis shows the presence of silver and copper in the samples. The SEM observation reveals that the samples consist of grains with average grain size up to 40 nm, and the particle size dependant melting point was studied by TG-DTA.
Key words: Ag-Cu alloy nanoparticles; chemical reduction method; characterization
1 Introduction
The fabrication of materials with well defined, controllable properties and structures on the nanometer scale coupled with the flexibility paid by intermetallic materials, which is referred as nanoalloys [1]. Metallic alloys in the nanoregime reveal unique optical, catalytic, electric, and magnetic properties that are widely different from those of the corresponding bulk materials [2]. When two or more kinds of metals are melted together, the melting point, rigidity, conductivity, and extensibility change considerably. And when it comes to nanoalloy materials, new and interesting properties show up [3,4].
Electronic packaging is a manufacturing technology used for electronic products. Packaging provides a medium for electronic interconnections and mechanical support, and solder alloys provide the electrical and mechanical connections between the die (chip) and the bonding pads. The selection of materials for solder alloys is critical and plays an important role in solder joint reliability [4]. A solder is a fusible metal alloy, which is melted to join metallic surfaces, especially in the fields of electronics and plumbing, in a process called soldering [5].
Sn-Pb alloy is a traditional material which has been used for interconnect materials for a long history. However, due to the inbuilt toxicity and the harm to human health and environment, Sn-Pb alloy is gradually being taken out of the electronic industry in many countries. As a result, electronics manufacturers need to be aware of the solder alloy choices available to them. Due to the toxicity of lead, the studies were directed towards the lead-free solders. Nowadays, attention has been directed to lower the eutectic temperature or melting point of lead-free alloys for soldering purposes.
The utilization of metals such as tin, copper, silver, and sometimes bismuth, indium, zinc, antimony, and other metals has been investigated [6-8]. As a result, many lead-free solder alloys have been proposed. The melting point of most lead-free solders is higher than that of electric Sn-Pb solder (melting point: 221 °„C). This higher melting point, in turn, pushes the solder reflow (i.e., spreading of molten alloy on the contact surface) temperature to over 260 °„C and severely limits the applicability of this metal alloy to temperature sensitive components and/or low cost organic printed circuit boards.
The melting point can be dramatically decreased when the size of substances is reduced to nanometer size [9]. The high ratio of the surface area to volume of nanoparticles has been known as one of the driving forces for the size-dependent melting point depression. Therefore, there is an increasing interest in the application of nanoscale metal alloys as low temperature lead-free solders. Among the metals, Ag is most widely used as electrically conductive adhesives because Ag has the highest electrical conductivity and, unlike many other metals, their oxides are also relatively conductive [10]. Copper has also been proposed as an alternative conductive filler in electrically conductive adhesives for the next generation of lead-free interconnect materials, due to its low cost, high electrical conductivity, low electrical migration and high compatibility. However, due to its easy oxidation nature, the use of pure copper in composites has been limited.
Metal alloy nanoparticles can readily be prepared by chemical reduction methods. In this method the appropriate mixture of metal salts in the solution phase is reduced by using reducing agents such as NaBH4 and N2H4 [11,12]. During the reduction process of the metal species with similar redox potentials and metals with relatively large enthalpies of mixing, alloyed bimetallic particles can be generated. The metal species with the highest redox potential generally precipitates first, forming a core on which the second component is deposited as a shell [13]. The metal such as copper, iron and silver are pronounced to oxidation. To avoid the oxidation of these metals the reduction can be carried out in the presence of the surfactants or in the inert atmosphere. In the nitrogen gas atmosphere the oxidation of these metals can be retarded.
In this study, a low temperature chemical reduction method is employed to synthesize the Ag-Cu alloy nanoparticles for lead-free interconnects applications. The effect of precursor metal salt on the formation of the alloy nanoparticles is studied. The average diameter of the particles can be achieved down to 40 nm. In this method nitrogen gas is employed to prevent the oxidation of the synthesized Ag-Cu alloy nanoparticles. The microstructures of the synthesized Ag-Cu nanoparticles are characterized.
2 Experimental
2.1 Materials
Silver nitrate (99.5%, Merck, India), copper sulphate (98.5%, Qualigens, India), copper acetate (98%, Qualigens, India) and sodium borohydride (95%, Merck, India) were used as precursor materials and reducing agent, respectively. The above chemicals were dissolved in double distilled water throughout this study. Sodium hydroxide (97%, Merck, India) was used to maintain alkaline pH. Calcium chloride (Merck, India) was used for drying the prepared sample in the desiccator.
2.2 Synthesis
2.2.1 Synthesis of Ag-Cu alloy nanoparticles from copper sulphate and silver nitrate
The two metal salt solutions (0.1 mol/L silver nitrate and 0.1 mol/L copper sulphate) were mixed in a round bottom flask and purged with nitrogen gas. The round bottom flask was covered with black cloth to avoid photochemical reaction of AgNO3. The reaction mixture was stirred for 10 min using magnetic stirrer. To this reaction mixture, sodium borohydride solution (0.3 mol/L) was added slowly through a dropping funnel and stirred for 1 h. The whole reaction was carried out under the ice cold condition and nitrogen atmosphere. The dark green precipitate was obtained and separated by filtration. The obtained precipitate was washed with ethanol water mixture. The prepared sample was dried in a desiccator having calcium chloride at room temperature. The following chemical reduction reaction may take place during the process.
AgNO3+CuSO4+3NaBH4 Ag-Cu+1.5H2+1.5B2H6+NaNO3+Na2SO4 (1)
2.2.2 Synthesis of Cu-Ag alloy nanoparticles from copper acetate and silver nitrate
The metal salt solutions (0.1 mol/L silver nitrate and 0.1 mol/L copper acetate) and reducing agent ( 0.3 mol/L sodium borohydride solution) were used to prepare Cu®CAg alloy nanoparticles with the similar procedure. The following chemical reduction reaction is proposed for the synthesis.
AgNO3+Cu(CH3COO)2+3NaBH4Ag-Cu+1.5H2+1.5B2H6+NaNO3+2CH3COONa (2)
2.3 Characterization
The powder XRD study was carried out using a Shimadzu XRD 6000 X-ray diffractometer using Cu Ka radiation. The crystallite sizes of the Cu-Ag nanoparticles were calculated by Scherrer formula. EDAX analysis was performed to find out the content of elements present in the samples. The particle size of the powder was measured using a Malvern particle size analyzer using triple distilled water as medium. The morphology of the particles was studied by JEOL model JSM-6360 scanning electron microscope. The UV- visible spectroscopy study for the synthesized powder was carried out with JASCO V630 UV-visible spectrophotometer. The TG-DTA studies for the synthesized powder were carried out with Perkin Elmer diamond thermogravimetric analyzer.
3 Results and discussion
3.1 XRD characterization
In order to see the crystalline behavior of the Ag-Cu alloy nanoparticles and to estimate the crystal size using Scherrer equation [14], XRD measurements of the thin films containing Ag-Cu alloy particles were carried out. Figure 1 shows the XRD patterns of Ag-Cu alloy nanoparticles synthesized by chemical reduction reaction using CuSO4+AgNO3 and Cu(OAC)2+ AgNO3, respectively. The XRD patterns show intense peaks positioned at 2¶» of 36.71°„, 38.65°„, 44.80°„, 64.79°„ and 77.9°„. No literature is available with regard to the XRD studies of Ag-Cu alloy. Hence, the obtained XRD pattern was compared with the reported standard JCPDS patterns of Ag (JCPDS No. 89-3722), Cu (JCPDS No. 04-0836) and CuO (JCPDS No. 48-157). The peaks at 36.71°„ and 38.65°„ in both the samples may be attributed to the formation of Ag-Cu alloy nanoparticles, since these peaks did not match with the above JCPDS data. There are few less intense peaks at 35.700°„, 36.812°„, 61.772°„ in the XRD patterns of samples. This may correspond to the presence of CuO in the samples. The appearance of peaks related to CuO may be due to the oxidation of copper after the synthesis process. The crystallite size of the powder was calculated by Scherrer equation.
The crystallite size of Ag-Cu alloy size is found to be in the range of 13-16 nm for the sample prepared with CuSO4+AgNO3 and 13-15 nm for the sample prepared with Cu(OAC)2+AgNO3.
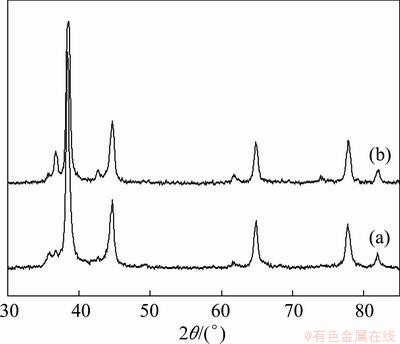
Fig. 1 XRD patterns of Ag-Cu alloy nanoparticles synthesized from CuSO4+AgNO3 (a) and Cu(OAC)2+AgNO3 (b)
3.2 Energy dispersive spectroscopy (EDS) analysis
The EDS spectra of Ag-Cu alloy nanoparticles synthesized by chemical reduction reaction using CuSO4+AgNO3 and Cu(OAC)2 + AgNO3 are reported in Fig. 2. From Fig. 2, the peak related to oxygen is observed in both the samples. The presence of oxygen may be due to the presence of CuO and moisture in the samples due to their less particle size. The above result is in accordance with the XRD data.
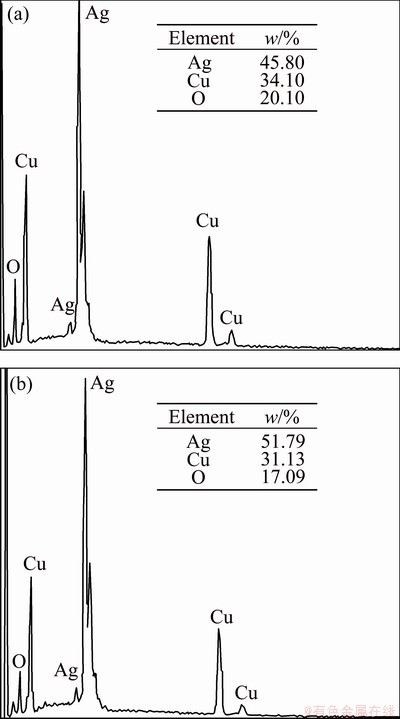
Fig. 2 EDS profiles of Ag-Cu alloy nanoparticles synthesized from CuSO4+AgNO3 (a) and Cu(OAC)2+AgNO3 (b)
3.3 Particle size analysis
The prepared Ag-Cu alloy nanoparticles were subjected to particle size measurements using Malvern particle size analyzer with triple distilled water as medium. For all the measurements, the sample was sonicated in triple distilled water for about 10 min and after that the sample was subjected to particle size analysis. The particle size distribution curves of the Ag-Cu alloy nanoparticles are shown in Fig. 3.
The particle size distribution curve obtained with Ag-Cu alloy nanoparticles prepared from CuSO4+ AgNO3 is shown in Fig. 3(a) (recorded by sonicating 0.02 g of powder in 10 mL water). From this figure it was seen that 100% of particles were present below 317 nm.
The particle size distribution curve obtained with Ag-Cu alloy nanoparticles prepared from Cu(OAC)2+ AgNO3 is shown in Fig. 3(b) (recorded by sonicating 0.02 g of powder in 10 mL water). From this figure, it was understood that 100% of the particles were present below 238 nm.
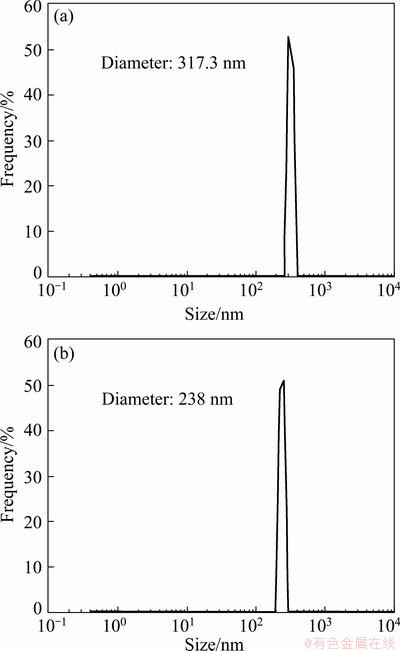
Fig. 3 Particle size distribution profiles of Ag-Cu alloy nanoparticles synthesized from CuSO4+AgNO3 (a) and Cu(OAC)2+AgNO3 (b)
3.4 SEM analysis
Figure 4(a) shows the typical SEM image of the Ag-Cu alloy nanoparticles prepared from CuSO4+ AgNO3. This figure depicts the shape and morphology of the microstructure. The spherical alloy particles remain well separated, and the size distribution calculated from several SEM images indicates that the average particle diameter is in the range of (65°ņ5) nm.
Figure 4(b) shows the typical SEM image of the Ag-Cu nanoalloys nanoparticles prepared from Cu(OAC)2+AgNO3. The spherical alloy particles linked with each other, and the size distribution calculated from several SEM images indicates that the average particle diameter is in the range of (50°ņ10) nm. In addition, few large particles of -100 nm were also found.
3.5 UV-visible spectroscopic studies
The experimentally observed UV-vis spectra of Ag-Cu alloy nanoparticles are shown in Fig. 5. Figure 5(a) indicates the UV-vis spectrum of the Ag-Cu alloy nanoparticles synthesized from CuSO4+AgNO3, which shows a strong absorption peak at 502 nm. From the literature, it was understood that pure Ag and pure Cu should show absorption peaks at 431 nm and 592 nm respectively [15]. However, the Ag-Cu alloy nano- particles synthesized through CuSO4+AgNO3 showed a single peak at 502 nm. Similarly, Fig. 5(b) indicates the UV-vis spectrum of the Ag-Cu alloy nanoparticles synthesized from Cu(OAC)2+AgNO3, which shows a strong absorption peak at 477 nm. The above observations suggest that the particles prepared in our case (with two methods) may be in alloy form, rather than a mixture of silver and copper individually. The variation in absorption peaks obtained in the two samples by two methods may be due to the variation in atmospheric/experimental conditions of the synthesis processes.
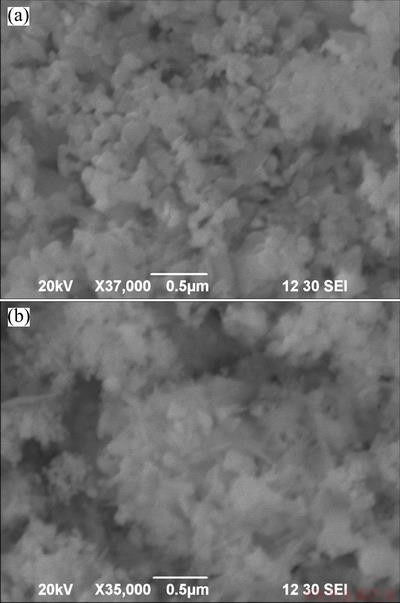
Fig. 4 SEM images of Ag-Cu alloy nanoparticles synthesized from CuSO4+AgNO3 (a) and Cu(OAC)2+AgNO3 (b)
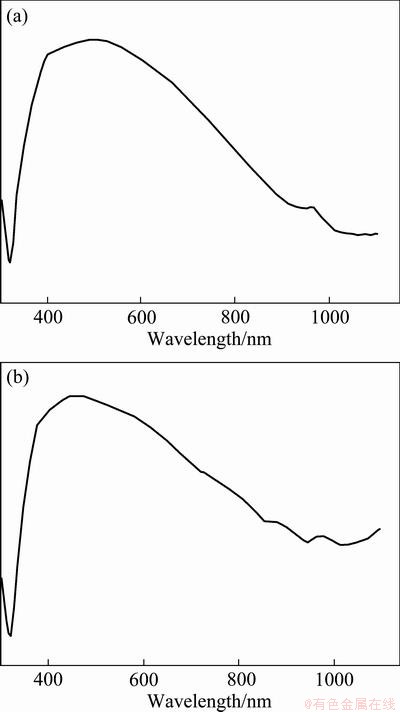
Fig. 5 UV-vis spectra of Ag-Cu alloy nanoparticles synthesized from CuSO4+AgNO3 (a) and Cu(OAC)2+AgNO3 (b)
3.6 TG and DTA analysis
From Fig. 6 it is found that the mass loss below 150 °„C may be due to the evaporation of absorbed moisture from the samples. However, it was noticed that the gradual mass loss continued to 323.8 °„C for the sample prepared with CuSO4+AgNO3 and to 359 °„C for the sample prepared with Cu(OAC)2+AgNO3. From this, it was clearly understood that for both the samples the thermal decomposition started at around 150 °„C. However, the samples underwent gradual mass loss till to 323.8 and 359 °„C, respectively. The above gradual mass loss was confirmed from the endothermic peaks observed in the DTA curves of the samples. Also, it was reported that small particles may tend to evaporate at low temperature when compared with the bigger particles. Hence, the wide range of thermal decomposition observed in our samples may be due to the presence of different size particles. From the TG-DTA data, it was found that no oxidation of Ag-Cu alloy nanoparticles was observed in the samples. Further, it was observed that the gradual mass loss indicates that the alloy particles behave well in a wide temperature range. From the results, it was noted that the Ag-Cu alloy nanoparticles prepared by us may be used for solder applications in a wide temperature range.
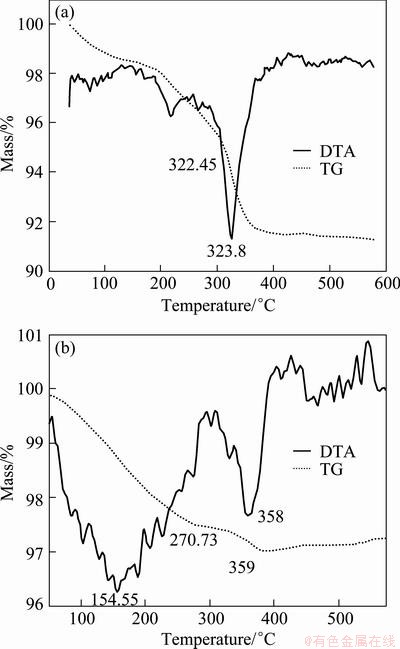
Fig. 6 TG-DTA curves of Ag-Cu alloy nanoparticles synthesized from CuSO4+AgNO3 (a) and Cu(OAC)2+AgNO3 (b)
4 Conclusions
Ag-Cu alloy nanoparticles were successfully synthesized by low temperature chemical reduction method. The particle size of the powder was found to be in the range from 238 to 317 nm. From the SEM observation, it was found that the grains were present individually and linked with each other in nanometer range. The UV-visible spectroscopy confirmed the formation of Ag-Cu alloy in the samples. The TG-DTA results confirmed the stability of Ag-Cu alloy in the wide temperature range. The fundamental and thermal behaviors suggested that the Ag-Cu alloy nanoparticles prepared by simple chemical reduction process may be used as low melting lead free solders.
Acknowledgements
The authors express their gratitude to Karunya University for promoting nonmaterials based research activity. One of the authors, Mr. W. BHAGATHSINGH sincerely thanks The Nanomission, Department of Science and Technology, Govt. of India for providing fellowship to do his post graduate (M.Tech.) study at Karunya University.
References
[1] FERRANDO R, JELLINEK J, JOHNSTON R L. Nanoalloys: From theory to application of alloy clusters and nanoparticles [J]. Chemical Reviews, 2008, 108(3): 846-910.
[2] WELLER H. Quantized semiconductor particles: A novel state of matter for materials science [J]. Advanced Materials, 1993, 5: 88-95.
[3] JIANG H J, MOON K S, HUA F, WONG C P. Synthesis and thermal and wetting properties of tin/silver alloy nanoparticles
for low melting point lead-free solders [J]. Chemistry of Materials, 2007, 19: 4482-4485.
[4] ZOU Chang-dong, GAO Yu-lai, YANG Bin, ZHAI Qi-jie. Melting and solidification properties of the nanoparticles of Sn3.0Ag0.5Cu lead-free solder alloy [J]. Materials Characterization, 2010, 61(4): 474-480.
[5] HSIAO L Y, DUH J G. Synthesis and characterization of lead-free solders with Sn-3.5Ag-xCu (x=0.2, 0.5, 1.0) alloy nanoparticles by the chemical reduction method [J]. Journal of the Electrochemical Society, 2005, 152(9): 105-109.
[6] DE S, PAL A, PAL T. Molecular photonic switches employing ions and nanoparticles of coinage and platinum metals [J]. Langmuir, 2000, 16: 6855-6861.
[7] MAO Bing-wei, TANG Jing, RANDLER R. Clustering and anisotropy in monolayer formation under potential control: Sn on Au(111) [J]. Langmuir, 2002, 18: 5329-5332.
[8] JIN Hong-mei, WU Ping. Coefficient of thermal expansion for solder alloys based on cluster expansion method [J]. Journal of Materials Chemistry, 2002, 12: 1090-1093.
[9] WOLFEBSTINE J. A high ratio of the testing temperature to the melting temperature: A necessary but not sufficient condition for an alloy anode to exhibit low capacity fade [J]. Materials Letters, 2003, 57: 3983-3986.
[10] JIANG H J,MOON K S,WONG C P. Synthesis of Ag-Cu alloy nanoparticles for lead-free interconnect materials [C]// Proceedings of the International Symposium on Advanced Packaging Materials: Processes, Properties and Interfaces. Georgia Institute of Technology, 2005: 173-177.
[11] BONNEMAN H, RICHARDS R M. Nanoscopic metal particles°™Synthetic methods and
potential applications [J]. Eur J Inorg Chem, 2001, 10: 2455-2480.
[12] 1432072abstract
BURDA C, CHEN X, NARAYANAN R, EL-SAYED M A. Chemistry and properties of
nanocrystals of different shapes [J]. Chemical Review, 2005, 105(4): 1025-1102.
[13] GOIA D V, MATIJEVIC E. Preparation of monodispersed metal particles [J]. New J Chem, 1998, 22: 1203-1215.
[14] VERMA S, PRADHAN S D, PASRICHA R, SAINKAR S R, JOY P A. A novel low-
temperature synthesis of nano-sized NiZn ferrite [J]. Journal of American Ceramic Society, 2005, 88(9): 2597-2599.
[15] NANDA K K. Size-dependent melting of nanoparticles: Hundred years of thermodynamic model [J]. Pramana Journal of Physics, 2009, 72(4): 617-628.
Ag-Cu ļŌĹūń…√◊ŅŇŃ£ĶńĶÕő¬ļŌ≥…”Ž»»—ß–‘ń‹
W. BHAGATHSINGH1, A. SAMSON NESARAJ2
1. School of Nanosciences and Technology, Karunya University, Coimbatore-641 114, Tamil Nadu, India;
2. Department of Chemistry, Karunya University, Coimbatore-641 114, Tamil Nadu, India
’™ “™£ļ≤…”√“Ľ÷÷ľÚĶ•ĶńĶÕő¬ĽĮ—߼Ļ‘≠∑Ĺ∑®£¨‘ŕňģ»‹“ļ÷–ņŻ”√NaBH4◊ųő™ĽĻ‘≠ľŃĽĻ‘≠ī◊ňŠĽÚŃÚňŠÕ≠£¨÷∆ĪłŃňAg-Cuń…√◊ŅŇŃ£°£∑ī”¶Ļż≥Ő÷–Õ®»ŽĶ™∆Ýņī∑ņ÷Ļ…ķ≥…ĶńļŌĹūĪĽ—űĽĮ°£≤…”√XRD°Ę◊ŌÕ‚-Ņ…ľŻĻ‚∆◊°ĘŅŇŃ£≥ŖīÁ≤‚ ‘°ĘEDS∑÷őŲ°ĘTG-DTA∑÷őŲļÕSEMĻŘ≤žĶ» ÷∂őņīĪŪ’ųļŌ≥…ĶńAg-Cuń…√◊ŅŇŃ£°£XRD∑÷őŲĪŪ√ų£¨ňýļŌ≥…ĶńAg-Cuń…√◊ŅŇŃ£ĶńĺßŃ£≥ŖīÁő™15 nm◊ů”“°£◊ŌÕ‚-Ņ…ľŻĻ‚∆◊∑÷őŲ÷§ ĶŃňń…√◊ŅŇŃ£Ķń…ķ≥…°£EDS∑÷őŲĪŪ√ų£¨—ý∆∑÷–īś‘ŕAgļÕCu°£SEMĻŘ≤žĪŪ√ų£¨ňý÷∆ĪłĶń—ý∆∑Ķń∆ĹĺýĺßŃ£≥ŖīÁő™40 nm°£TG-DTA—–ĺŅĪŪ√ų£¨ļŌĹūĶń»ŘĶ„”ŽŅŇŃ£≥ŖīÁ”–Ļō°£
ĻōľŁī £ļAg-CuļŌĹūń…√◊ŅŇŃ££ĽĽĮ—߼Ļ‘≠∑Ĺ∑®£ĽĪŪ’ų
(Edited by Sai-qian YUAN)
Corresponding author: A. SAMSON NESARAJ; Tel: +91-422-2614301; E-mail: drsamson@karunya.edu
DOI: 10.1016/S1003-6326(13)62438-3

