Trans. Nonferrous Met. Soc. China 24(2014) 536-543
Leaching kinetics of selenium from selenium-tellurium-rich materials in sodium sulfite solutions
Ya-jie ZHENG1, Kun-kun CHEN 2
1. School of Metallurgy and Environment, Central South University, Changsha 410083, China;
2. Institute of Electronic Materials, Northwest Institute for Non-ferrous Metal Research, Xi’an 710016, China
Received 4 January 2013; accepted 27 March 2013
Abstract: The leaching kinetics of selenium from selenium-tellurium-rich materials in sodium sulfite solutions was studied. The morphologies of selenium-tellurium-rich materials are mainly spheroid and columnar bodies and the range of particle size of selenium-tellurium-rich materials is between 17.77 μm and 56.58 μm, which contain 41.73% selenium and 40.96% tellurium. The ranges of experimental elements are 126-315 g/L of sodium sulfite concentration, 100-400 r/min of agitation speed, 23-95 °C of reaction temperature, 7:1-14:1 of liquid-solid ratio and 17.77-56.58 μm of average particle size. The results show that the leaching rate increases with increasing the sodium sulfite concentration, agitation speed, reaction temperature or liquid-solid ratio and the leaching rate decreases with increasing the particle size. The reaction temperature has the significant effects on the selenium leaching rate which increases from 21% to 67% with increasing temperature from 23 °C to 95 °C. The experimental data agree quite well with the Avrami model for leaching, with model parameter of 0.235 and apparent activation energy of 20.847 kJ/mol.
Key words: selenium; tellurium; sodium sulfite; leaching kinetics
1 Introduction
Selenium, as a scattered element of semimetals, possesses many complex chemical and biochemical properties. Selenium can be widely used in chemical, metallurgical and electronic industries [1-4]. Moreover, selenium is an essential trace element in biology [5-7]. At present, more than 90% of selenium comes from the anode slimes of copper, nickel and lead in electrolytic refining in the world [8, 9]. In addition, the acid mud of sulfuric acid plants, the coal fly ash of the coal-fired power and the calcination dust of lead-zinc ore are also used to produce selenium [10-13]. The pyrometallurgical methods used widely in anode slime processing include oxidative roasting method and sulfuric acid roasting method, by which the selenium is transferred into selenium dioxide and is reduced into elemental selenium by sulfur dioxide or sodium sulfite in aqueous solutions [14,15]. The hydrometallurgical methods can be used to recover selenium, including acid leaching and alkali leaching [14,16,17]. Although these hydrometallurgical methods can effectively extract the selenium, the whole process becomes complicated because it is necessary to use solvent extraction, ion exchange for separating the other elements. In order to avoid this problem, selenium is often leached by sodium sulfite while it has easy operation, simple device as well as free pollution [18,19]. CHEN et al [19] studied leaching elemental selenium in sediments with CS2 and Na2SO3, and their results showed that elemental selenium was completely dissolved in a sodium sulfite solution. VELINSKY and CUTTER [20] proposed that elemental selenium in sodium sulfite solution (pH 7) was leached by an ultrasonic. WRIGHT et al [21] mentioned that the sodium sulfite method can be effective for leaching elemental selenium. Sodium sulfite to leach selenium from selenium-containing materials is widely studied, while it is very important to study the leaching kinetics of selenium from selenium-bearing materials in sodium sulfite solution because the kinetics of leaching selenium from selenium-rich materials will provide a theoretical guide for the processing improvement and the industrial application in the future.
2 Experimental
Selenium-tellurium-rich materials came from Penghui copper smelter of Shandong Province, China. Elemental composition of the selenium-tellurium- rich materials is shown in Table 1. The XRD pattern (D/max-TTR Ⅲ; Cu-Kα radiation; 40 kV/250 mA X-ray; scanning rate: 0.02(°)/s) and scanning electron microscopy (SEM, JSM-6360; accelerating voltage of 20 kV) of the selenium-tellurium-rich materials are shown in Fig. 1.
Table 1 Chemical composition of selenium-tellurium-rich materials (mass fraction, %)
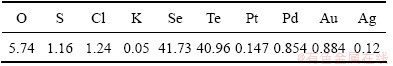
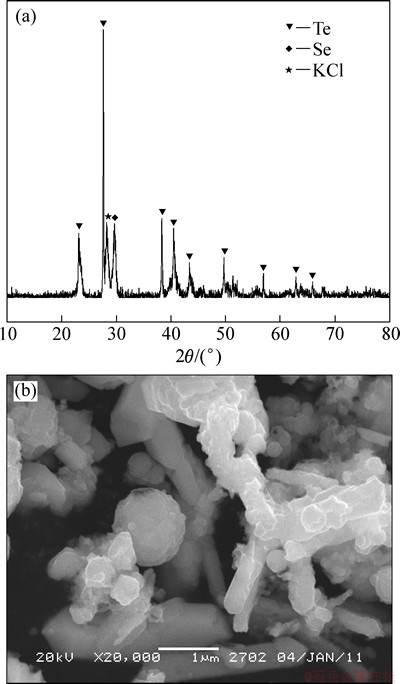
Fig. 1 XRD pattern (a) and SEM image (b) of selenium-tellurium-rich materials
The selenium-tellurium-rich materials contain 41.73% selenium and 40.96% tellurium according to Table 1. There are elemental tellurium, elemental selenium and KCl in the selenium-tellurium-rich materials and the morphologies of selenium-tellurium- rich materials are mainly spheroid and columnar bodies from Fig. 1.
The selenium-tellurium-rich materials were ground into four different finenesses in a laboratory planetary ball mill. The particle size analyses of ground samples were performed by a Malvern laser particle size analyzer (Model Mastersize 2000). Four average particle sizes of 56.58, 44.50, 28.67 and 17.77 μm were obtained. The selenium-tellurium-rich materials with average particle size of 56.58 μm were used for all leaching experiments while the others were used for the test of the effect of particle size on selenium leaching rate.
Batch leaching experiments were conducted in a 2 L cylindrical glass reactor equipped with a stirrer at constant temperature with a super thermostatic water bath. The sodium sulfite solution was added into the glass reactor and the agitation speed was set to the desired speed. The solution was heated to the desired temperature before adding the selenium-tellurium-rich materials. Then, 100 g of selenium-tellurium-rich materials were added into the sodium sulfite solution rapidly. Approximately 2 mL of slurry samples was taken at regular intervals and filtered once for analysis. After the reaction, the leaching residue was washed with deionized water and dried at 85 °C. The filtrate was assayed for selenium content by inductively coupled plasma (ICP, Intrepid Ⅱ XSP; RF power of 1199 W; carrier gas of 0.5 L/min; nebulization gas flow of 1.8 mL/min; exposure time of 10 s; wave length of Se: 1960  ) emission spectrometry. From the analysis results, the leaching rate (X) of selenium can be calculated according to the following equation:
 (1)
(1)
where εt is the total amount of selenium leached from the selenium-tellurium-rich materials after reaction time t, ε0 is the total amount of selenium in the selenium- tellurium-rich materials.
3 Results and discussion
3.1 Effect of sodium sulfite concentration on leaching rate of selenium
The effect of the sodium sulfite concentration on the leaching rate of selenium was performed at sodium sulfite concentrations of 126, 189, 252 and 315 g/L. Each of these four concentrations was tested at 85 °C, 300 r/min of the agitation speed and 7:1 of the liquid-solid ratio (mL/g). Figure 2 indicates that the leaching rate increases with increasing the sodium sulfite concentration. It is important to note that the rate of reaction is very fast at the initial stage of the reaction (within 5 min) and later becomes slow. The slowing of reaction rate (after 5 min) can be explained by the decrease of sodium sulfite concentration with the reaction conducting. Hence, increasing sodium sulfite concentration may promote the leaching process of selenium in sodium sulfite solution.
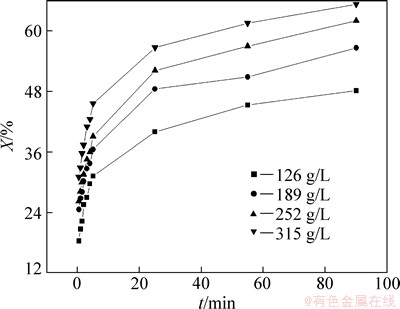
Fig. 2 Effect of Na2SO3 concentration on leaching rate of selenium
3.2 Effect of agitation speed on leaching rate of selenium
The influence of agitation speed on the leaching rate of selenium was investigated at agitation speeds of 100, 200, 300, and 400 r/min, respectively. In these experiments, the sodium sulfite concentration was 252 g/L, the temperature was 85 °C and the liquid-solid ratio was 7:1. The results are shown in Fig. 3, from which it can be seen that agitation speed improves selenium leaching. This can be resulted from the reactants contacting sufficiently with each other and decreasing the thickness of the mass transfer boundary layer on the surface of the particles with increasing agitation speed.

Fig. 3 Effect of agitation speed on leaching rate of selenium
3.3 Effect of reaction temperature on leaching rate of selenium
In order to determine the effect of the reaction temperature on the leaching rate of selenium, experiments were carried out at temperatures of 23, 50, 70, 85, and 95 °C, under the conditions of 252 g/L sodium sulfite solution, agitation speed 300 r/min, liquid-solid ratio 7:1. Figure 4 shows the change on selenium leaching with the leaching time as function of temperature.
Figure 4 clearly shows the significant effect of temperature on the kinetics of selenium leaching. The selenium leaching rates increased from 21% to 67% with increasing temperature from 23 to 95 °C. This is expected from the exponential dependence of the rate constant in the Arrhenius equation. Furthermore, this can be due to reactant activity increasing with increasing the reaction temperature.
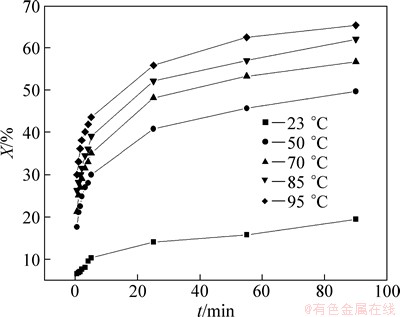
Fig. 4 Effect of reaction temperature on leaching rate of selenium
3.4 Effect of liquid-solid ratio on leaching rate of selenium
The influence of the liquid-solid ratio on leaching rate of selenium was determined at liquid-solid ratios of 7:1, 10:1, 12:1 and 14:1, when the sodium sulfite concentration was 252 g/L, the temperature was 85 °C and the agitation speed was 300 r/min.
Figure 5 reveals that the leaching rate increases with increasing liquid-solid ratio is owing to the increase in the mole mass of sodium sulfite with the increase of liquid-solid ratio.
3.5 Effect of particle size on leaching rate of selenium
To observe the effect of the particle size on leaching rate of selenium, leaching experiments were carried out at average particle sizes of 56.58, 44.50, 28.67 and 17.77 μm as the sodium sulfite concentration, reaction temperature, liquid-solid ratio and agitation speed were kept at 252 g/L, 85 °C, 7:1 and 300 r/min, respectively. The results are shown in Fig. 6. It shows that the leaching rate increases with the decrease of particle size of the selenium-tellurium-rich materials. The smaller the particle size is, the faster the leaching of selenium is and the higher the leaching rate is. This can be caused by the increase of specific area with the decrease of particle size, so that the mass transfer process of leaching is enhanced. In addition, solid particles are also activated during grinding, the enwrapped selenium is exposed, resulting in leaching easily.
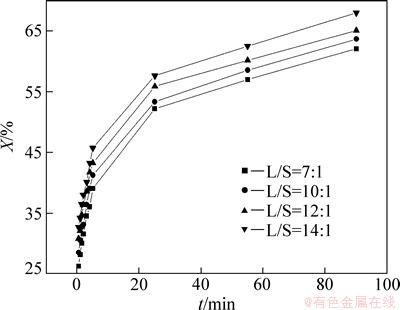
Fig. 5 Effect of L/S ratio on leaching rate of selenium
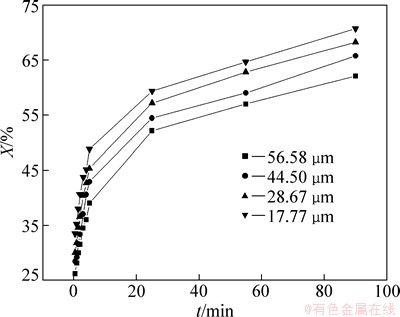
Fig. 6 Effect of particle size on leaching rate of selenium
3.6 Kinetics analysis
The reaction between selenium and sodium sulfite in the solution is as follows [18,19]:
Na2SO3(l)+Se(s)=Na2SeSO3(l) (2)
The reactions between solid and fluid are heterogeneous, which can be expressed by shrinking core model [22,23]. The shrinking core model assumes that the rate may be controlled by diffusion through a fluid film, or by diffusion through the product layer, or by a surface chemical reaction. For spherical particles, the rate equations for each of the above control mechanisms, i.e. the leaching rate (X) as a function of the reaction time, (t) can be written as follows [24]:
Surface chemical reaction control,
1-(1-X)1/3=kt, (3)
Film diffusion control through a fluid film,
1-(1-X)2/3=kt, (4)
Film diffusion control through product layer,
1-2/3X-(1-X)2/3=kt, (5)
In addition to the above rate equations, the following models may be also used to determine the rate equations [23, 25]:
Zero order pseudo homogeneous model,
X=kt, (6)
First order pseudo homogeneous model,
-ln(1-X)=kt, (7)
Second order pseudo homogeneous model,
1/(1-X)=kt, (8)
The Avrami model,
-ln(1-X)=ktn, (9)
According to the test data, the leaching kinetics of the selenium-tellurium-rich materials does not fit both the shrinking core model and the pseudo homogeneous model. However, these data fit successfully the Avrami model [25-27]. The Avrami model was derived originally from systems in which the crystallization phenomenon occurred and might be also used to derive the rate equations in non-catalytic fluid-solid systems [27,28]. In this test the reaction between selenium and sodium sulfite is the non-catalytic reaction between the fluid and the solid. The logarithm form of Eq. (9) for the Avrami model is as follows:
ln[-ln(1-X)]=ln k+nln t (10)
According to the experimental data of effect of reaction temperature on the leaching rate of selenium in Fig. 4, a plot of ln[-ln(1-X)] versus ln t can be obtained. As shown in Fig. 7, it can be seen that ln[-ln(1-X)] and ln t in Eq. (10) fit the linear relationship. It is confirmed that the kinetics of leaching selenium with sodium sulfite solution is fitted to the Avrami model.
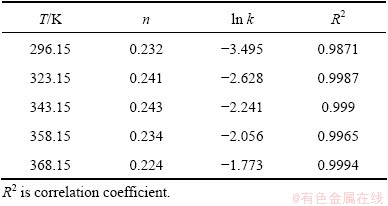
n and ln k are respectively the slope and the intercept of the line in Fig. 7. The values of n and ln k at different reaction temperatures are shown in Table 2. The average value of n and standard deviation are 0.235 and 0.0076, respectively.
KABAI [29] repotted that n in Eq. (9) was independent of process conditions, but was a function of properties and geometry of the solid particles. The leaching reactions were classified according to the value of n: for n<1 the initial rate is infinite and the rate continually decreases with increasing time; for n=1 the initial rate is finite; for n>1 the reaction exhibits an initial rate approaching zero.
In this study, the Avrami model parameter n is 0.235, so the initial reaction rates are very fast at different reaction conditions when sodium sulfite leaches selenium from the selenium-tellurium-rich materials. This research result is as the same as that reported by KABAI [29].

Fig. 7 ln[-ln(1-X)] vs ln t at different reaction temperatures
Table 2 Values of n and ln k at different reaction temperatures
Furthermore, the kinetics equation of leaching selenium from the selenium-tellurium-rich materials in sodium sulfite solution can be described as follows when n is equal to 0.235.
-ln(1-X)=kt0.235 (11)
The plots of -ln(1-X) versus t0.235 under different leaching conditions can be obtained and shown in Figs. 8-12, according to the experimental data in Figs. 2-6.
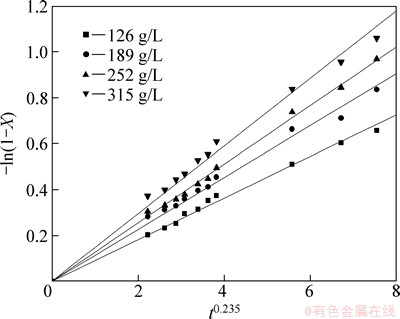
Fig. 8 Variation of -ln(1-X) versus t0.235 with different Na2SO3 concentrations
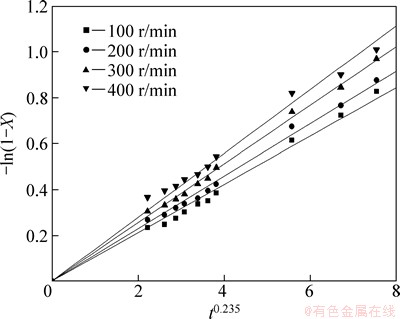
Fig. 9 Variation of -ln(1-X) versus t0.235 at different agitation speeds
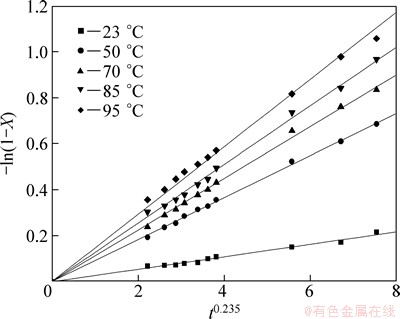
Fig. 10 Variation of -ln(1-X) versus t0.235 at different reaction temperatures
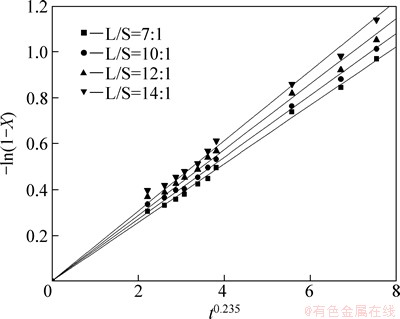
Fig. 11 Variation of -ln(1-X) versus t0.235 with different L/S ratios
It can be seen from Figs. 8-12 that the rate constant k is related to the sodium sulfite concentration, agitation speed, reaction temperature, liquid-solid ratio and particle size. The dependence of the rate constant on these five variables can be expressed with the Arrhenius equation.
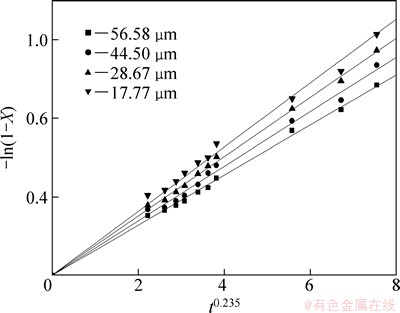
Fig. 12 Variation of -ln(1-X) versus t0.235 with different particle sizes
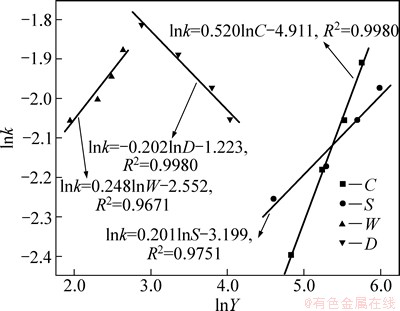
Fig. 13 lnk versus lnY (Y represents C, S, W and D)
k=k0CaDbWcSdexp[-E/(RT)] (12)
where k0 is the frequency factor; E is the apparent activation energy; R is the gas constant; T is the reaction temperature; C is the sodium sulfite concentration; D is the particle size; W is the liquid-solid ratio; S is the agitation speed (r/min); a, b, c and d are the constants.
The slopes of the lines in Figs. 8-12 represent the rate constant. The ln k can be calculated from these k values. The values of a, b, c and d in Eq. (12) are determined by linear regression analysis according to ln k and ln C, ln D, ln W, ln S values respectively (Fig. 13). a=0.520, b=-0.202, c=0.248, d=0.201, so the logarithm form of Eq. (12) is as follows:
lnk=-E/RT+A (13)
A=ln(k0C0.520D-0.202W0.248S0.201) (14)
To determine the activation energy of the leaching reaction, a ln k versus 1/T plot is plotted using the values of ln k and 1/T in Table 2. Figure 14 shows an approximate straight line. The slope of this line gives the E/R value, and the intercept is A. The values of E and A are calculated to be 20.847 kJ/mol and 5.031, respectively. Based on Eq. (14), the value of k0 is determined as 3.595. The final expression for the rate constant k is
k=3.595C0.520D-0.202W0.248S0.201exp[-20847/(RT)] (15)
So, according to Eqs. (11) and (15), we can get the leaching kinetics equation -ln(1-X)=3.595C0.520D-0.202・ W0.248S0.201exp[-20847/(RT)]t0.235.
In order to determine the compatibility of the model with the experimental data, a plot of theoretical leaching rate versus experimental leaching rate is given in Fig.15. It can be seen from Fig.15 that the ratio of theoretical data to experimental data approximates 1, which confirms the Avrami model is suitable for describing the kinetics of leaching selenium in sodium sulfite solution.
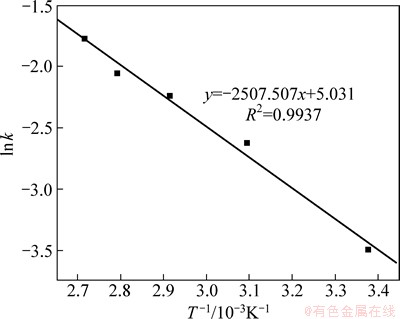
Fig. 14 Arrhenius plot for leaching of selenium
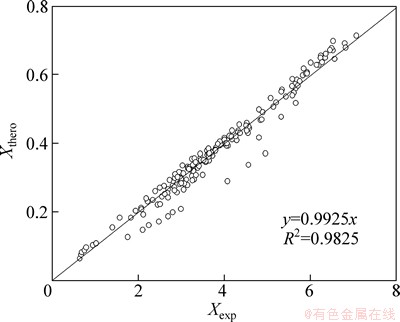
Fig. 15 Plot of theoretical leaching rate vs experimental leaching rate
4 Conclusions
1) Selenium can be leached successfully from the selenium-tellurium-rich materials by Na2SO3 solution under experimental conditions. The leaching rate increases with increasing the sodium sulfite concentration, agitation speed, reaction temperature, liquid-solid ratio and with decreasing particle size.
2) The leaching process is successfully described by the Avrami model. The model parameter and apparent activation energy are respectively 0.235 and 20.847 kJ/mol.
3) The leaching kinetics can be described by -ln(1-X)=3.595C0.520D-0.202W0.248S0.201exp[-20847/(RT)]・t0.235.
References
[1] MICHEAL W G. Selenium and tellurium [M]. US: Geological Survey Minerals Yearbook, 2003: 65.1-65.8.
[2] SEBY F, POTIN-GAUTIER M, GIFFAUT E, BORGE G, DONARD O F X. A critical review of thermodynamic data for selenium species at 25 °C[J]. Chemical Geology, 2001, 171(3-4): 173-194.
[3] XIONG Yong-liang. Predicted equilibrium constants for solid and aqueous selenium species to 300 °C: Applications to selenium-rich mineral deposits [J]. Ore Geology Reviews, 2003, 23(3-4): 259-276.
[4] ZHAI Xiu-jing, ZHOU Ya-guang. Scattered metals [M]. Hefei: University of Science and Technology of China Press, 2009. (in Chinese)
[5] MISTRY H D, PIPKIN F B, REDMAN C W G, POSTON L. Selenium in reproductive health [J]. American Journal of Obstetrics and Gynecology, 2012, 206(1): 21-30.
[6] GEOFFROY N, DEMOPOULOS G P. The elimination of selenium(Ⅳ) from aqueous solution by precipitation with sodium sulfide [J]. Journal of Hazardous Materials, 2011, 185: 148-154.
[7] HYMER C B, CARUSO J A. Selenium speciation analysis using inductively coupled plasma-mass spectrometry [J]. Journal of Chromatography A, 2006, 1114: 1-20.
[8] HOFFMANN J E. Recovering selenium and tellurium from copper refinery slimes [J]. The Journal of the Minerals Material Society, 1989, 41(7): 33-38.
[9] ABDOLLAHY M, SHAFAEI S Z. Optimized leaching conditions for selenium from Sar-Cheshmeh copper anode slimes [J]. Iran J Chem & Chem Eng, 2004, 23(2): 101-108.
[10] CORNELIS G, POPPE S, GERVER T V, BROECK E V D, CEULEMANS M, VANDECASTEELE C. Geochemical modeling of arsenic and selenium leaching in alkaline water treatment sludge from the production of non-ferrous metals [J]. Journal of Hazardous Materials, 2008, 159: 271-279.
[11] JOSE R O R, MARIA J M F, JORGE M P, ELIA A R, SOLEDAD M L, PURIFICACION L M, DARIO P R. Influence of several experimental parameters on As and Se leaching from coal fly ash samples [J]. Analytica Chimica Acta, 2005, 531: 299-305.
[12] SHUNSUKE K, HAJIME O, YUICHI K, HIROSHI K, KAZUYO M, TETSUYA N. Dissolution behavior of selenium from coal fly ash particles for the development of an acid-washing process [J]. Chemosphere, 2011, 85(4): 598-602.
[13] HOU Xiao-chuan, XIAO Lian-sheng, GAO Cong-jie, ZHANG Qi-xiu, ZENG Li. Kinetics of leaching selenium from Ni-Mo ore smelter dust using sodium chlorate in a mixture of hydrochloric and sulfuric acids [J]. Hydrometallurgy, 2010, 104: 76-80.
[14] CHERNYSHEV A A, PETROV G V, BELEN,KII A M, KOVALEV V N, KUKOLEVSKII A S. Recycling copper-bearing sludge: Status and prospects [J]. Metallurgist, 2009, 53(5-6): 296-299.
[15] DUTTON W A, van den STEEN A J, THEMELIS N J. Recovery of selenium from copper anode slimes [J]. Metallurgical Transactions, 1971, 2: 3091-3097.
[16] PUMURE I, RENTON J J, SMART R B. Accelerated aqueous leaching of selenium and arsenic from coal associated rock samples with selenium speciation using ultrasound leaching [J]. Environ Geol, 2009, 56: 985-991.
[17] ROBERT J H, MANALO R C. Process for the recovery of selenium from minerals and/or acidic solutions: US, 20100329968A1 [P]. 2010-12-30.
[18] ZHENG Ya-jie, CHEN Kun-kun. Selective leaching Se from selenium residue by Na2SO3 solutions and leaching kinetics [J]. The Chinese Journal of Nonferrous Metals, 2012, 22(2): 585-591. (in Chinese)
[19] CHEN Y W, LI L, D’ULIVO A, BELZILE N. Leaching and determination of elemental selenium in sediments―A comparative study [J]. Analytica Chimica Acta, 2006, 577: 126-133.
[20] VELINSKY D J, CUTTER G A. Determination of elemental and pyrite-selenium in sediments [J]. Analytica Chimica Acta, 1990, 235: 419-425.
[21] WRIGHT M T, PARKER D R, AMRHEIN C. Critical evaluation of the ability of sequential leaching procedures to quantify discrete forms of selenium in sediments and soils [J]. Environ Sci Technol, 2003, 37(20): 4709-4716.
[22] LI Hong-gui. Metallurgical principle [M]. Beijing: Science Press, 2005. (in Chinese)
[23] DICKINSON C F, HEAL G R. Solid-liquid diffusion controlled rate equations [J]. Thermochimica Acta, 1999, 340-341: 89-103.
[24] LEVENSPIEL O. Chemical reaction engineering, third edition [M]. New York: John Wiley & Sons, 1999.
[25] NIZAMETTIN D, ASIM K. Dissolution kinetics of ulexite in perchloric acid solutions [J]. Int J Miner Process, 2007, 83: 76-80.
[26] OKUR H, TEKIN T, KADIR OZER A, BAYRAMOGLU M. Effect of ultrasound on the dissolution of colemanite in H2SO4 [J]. Hydrometallurgy, 2002, 67: 79-86.
[27] AVRAMI M. Kinetics of phase change. Ⅰ General theory [J]. Journal of Chemical Physics, 1939, 7(12): 1103-1112.
[28] TUNC M, KOCAKERIM M M, KUCUK O, ALUZ M. Dissolution of colemanite in (NH4)2SO4 solutions [J]. Korean J Chem Eng, 2007, 24(1): 55-59.
[29] KABAI J. Determination of specific activation energies of metal oxides and metal oxides hydrates by measurement of the rate of dissolution [J]. Acta Chim Acad Scientiarium Hungaricae, 1973, 78: 57-73.
Na2SO3从硒碲富集物中浸出硒动力学
郑雅杰1,陈昆昆2
1. 中南大学 冶金与环境学院,长沙 410083;
2. 西北有色金属研究院 电子材料研究所,西安 710016
摘 要:研究用Na2SO3溶液从硒碲富集物中浸出硒的动力学。该硒碲富集物的微观形貌主要为球状体和柱状体,其粒径范围为17.77~56.58 μm,且其主要成分为41.73%Se和40.96%Te。研究Na2SO3浓度(126~315 g/L)、搅拌速度(100~400 r/min)、反应温度(23~95 °C)、液固比(7:1~14:1)及硒碲富集物平均粒径(17.77~56.58 μm)对Se浸出率的影响。结果表明:增加Na2SO3浓度、提高搅拌速度、升高反应温度和增加液固比均可以提高Se浸出率,而增大硒碲富集物的粒径会导致Se的浸出率降低;反应温度对Se浸出率影响较大,当反应温度从23 °C升高至 95 °C时,Se浸出率从21%增至67%;该浸出过程符合Avrami模型,其模型特征参数和表观活化能分别为0.235和20.847 kJ/mol。
关键词:硒;碲;亚硫酸钠;浸出动力学
(Edited by Xiang-qun LI)
Foundation item: Project (2011B0508000033) supported by the Special Foundation of Guangdong Province Major Science & Technology Program of China
Corresponding author: Ya-jie ZHENG; Tel: +86-731-88836285; E-mail: zyj@csu.edu.cn
DOI: 10.1016/S1003-6326(14)63093-4

