
Microstructure and dry wear properties of Ti-Nb alloys for dental prostheses
XU Li-juan(徐丽娟)1, XIAO Shu-long(肖树龙)1, TIAN Jing(田 竟)1,
CHEN Yu-yong(陈玉勇)1, HUANG Yu-dong(黄玉东)2
1. School of Materials Science and Engineering, Harbin Institute of Technology, Harbin 150001, China;
2. School of Chemical Engineering and Technology, Harbin Institute of Technology, Harbin 150001, China
Received 10 August 2009; accepted 15 September 2009
Abstract: The microstructure and properties of a series of binary Ti-Nb alloys for dental prostheses with niobium contents ranging from 5% to 20% were investigated. The experimental results indicate that the crystal structure and morphology of Ti-Nb alloys are sensitive to their niobium contents. When Nb content is 5%, the acicular α crystal grain is observed. When Nb content is 10%, the coarse equiaxed crystal grain and the fine, acicular α crystal grain are observed. When Nb content is 15%, only the α equiaxed crystal grain is observed. When the alloy contains 20%Nb, the equiaxed and dendritic α crystal grain are observed. For Ti-Nb alloys, the increase of Nb content modifies the microstructure of Ti-Nb alloys significantly and decreases their compression elastic modulus, in which Ti-20Nb alloy shows the largest compression strength and Ti-5Nb alloy shows the best plasticity. The dry wear resistance of Ti-Nb alloys against Gr15 ball was investigated on CJS111A ball-disk wear instrument. For Ti-Nb alloys, Ti-10Nb alloy shows a smallest steady friction coefficient, Ti-5Nb alloy shows the smallest wear depth and best wear resistance, and Ti-15Nb alloy shows the largest wear depth and worst wear resistance. The phenomenon of furrow cut happens and furrows form during wear tests.
Key words: Ti-Nb alloy; microstructure; dry wear resistance; dental prostheses material
1 Introduction
Titanium and its alloys have been increasingly used for some dental appliances because of their excellent biocompatibility, corrosion resistance, and mechanical properties[1-3]. Commercially pure titanium (CP-Ti) has been pointed out to have disadvantages of low strength, difficulty in polishing, and poor wear resistance. Therefore, titanium is still insufficient for high-stress applications[4]. Ti-6Al-4V alloy, originally developed as an aeronautical material, has been tested as a replacement for CP-Ti, because of its higher strength with sufficient corrosion resistance; however, the cytotoxicity of elemental vanadium is questionable[5-6]. Subsequently, Ti-6Al-7Nb alloy, developed for orthopedic application as a wrought material, has been evaluated as a new alloy for dental casting. Ti-6Al-7Nb alloy offers a potential biocompatibility advantage over Ti-6Al-4V owing to the absence of vanadium. But in terms of mechanical properties it is quite similar to Ti-6Al-4V, and it still contains aluminum[5-7]. The preferred titanium alloy for biomedical applications should have low modulus of elasticity, excellent mechanical strength, corrosion resistance, formability, and no potential toxic elements. As a result, Nb, Ta, Mo, Zr and Sn are selected as the safest alloying elements to titanium[7-9]. Among other alloys, researchers have extensively studied Ti-Cu and Ti-Mo alloys in regard to various properties for dental applications[1, 8, 10]. Otherwise, CHAI et al[10-11] have extensively studied Ti-Nb alloys for shape memory alloys. But Ti-Nb alloys for dental applications haven’t been reported. Therefore, the studies on Ti-Nb alloys for dental applications have the important academic values and application values.
Wear characteristics constitute another aspect of the performance of dental alloys. The accumulation of wear debris will produce an adverse celluar response leading to inflammation, release of damaging enzymes, osteolysis, inflection, implant loosing and pain[9]. Therefore, in order to select a suitable dental material, it is the most important to understand wear behaviour of experimental materials.
In the present study, the microstructure and mechanical properties of a series of binary Ti-Nb alloys with Nb contents ranging from 5% to 20%(mass fraction) were investigated. Otherwise, the dry wear resistance of Ti-Nb alloys against Gr15 ball was investigated on CJS111A ball-disk wear instrument.
2 Experimental
Ti-Nb alloys with four kinds of contents of niobium (5%, 10%, 15% and 20%) were selected for this study. The series of Ti-Nb alloys were prepared from 99.4% pure titanium powder and 99.9% pure niobium powder using a commercial arc-melting vacuum-pressure casting system (LZ5, Luoyang Mingtao Corp. China). The melting chamber was first evacuated and purged with argon. Appropriate amounts of metals were melted in a graphite hearth with a tungsten electrode. The ingots were remelted prior to casting to improve chemical homogeneity.
The specimens were cut from as-cast ingots by electrospark-erosion. The dimension of specimen was d 12 mm×5 mm. The specimens for observing microstructure were sanded on SiC paper(grade from 240 to 1 200), finished by polishing with diamond powder and eroded with 8%HF+15%HNO3+77%H2O. The solidification microstructures were observed by means of OLYMPUS BH2- UMA optical microscope (OM) and transmission electron microscope (TEM) (Philips CM12 TEM). The TEM specimens were produced by electrolytic jet polishing of 3 mm thin disks cut from the casting samples. The Vickers hardness measurements were performed using a HV-5 Vickers tester with a load of 4.9 N for 30 s. Compression testing was conducted at room temperature at a rate of 1 mm/min on INSTRON 5 500 compression instrument. The dimension of specimen was d 3 mm×5 mm.
The dry sliding wear tests were carried out on a CJS111A ball-disk wear instrument, by using Gr15 ball as a counterface material (3 mm in radius and hardness HV750). The specimens for the experiments (disks, 12 mm in diameter and 2 mm in thickness) were cut from the castings. The experimental parameters were estimated as follows: dry condition, normal load 2 N, test-disk rate 100 r/min and test-disk wear radius 3.5 mm. Friction coefficients were automatically recorded as a function of time of cycle. Wear scars were examined by SEM and Nano Indenter XP.
3 Results and discussion
3.1 Microstructure and mechanical properties of Ti-Nb alloys
The microstructures of Ti-Nb alloys are shown in Fig.1. When Nb content is 5%, the acicular α crystal grain is observed (Fig.1(a)). When Nb content is 10%, the coarse equiaxed crystal and the fine, acicular α crystal grain are observed (Fig.1(b)). When Nb content is 15%, only the equiaxed crystal is observed (Fig.1(c)). When the alloy contains 20%Nb, the equiaxed and dendritic α crystal grain is observed (Fig.1(d)).
Fig.2(a) shows a typical bright-field TEM image of Ti-5Nb alloy. The thick lath-type structure is observed. The sizes of the α laths range from 0.5 to 1.5 μm. The α laths appear in different directions. Fig.2(b) shows a typical bright-field image and Fig.2(c) shows SAD pattern taken from α phase of Ti-10Nb alloy. The sizes of the acicular α phase range from 0.15 to 0.3 μm and the acicular α phase appears in different directions.
The main performances of Ti-Nb alloys are shown in Table 1. All the Ti-Nb alloys have much higher Vickers hardness values (HV319-341) than that of CP-Ti (HV160), Ti-6Al-4V (HV294) and Ti-13Nb-13Zr (HV285)[8]. Among all Ti-Nb alloys, Ti-5Nb alloy has the lowest Vickers hardness value (HV319). The Ti-20Nb alloy has the highest hardness (HV341). Crystal grain size and crystal structure/phase can affect the Vickers hardness of the alloy.
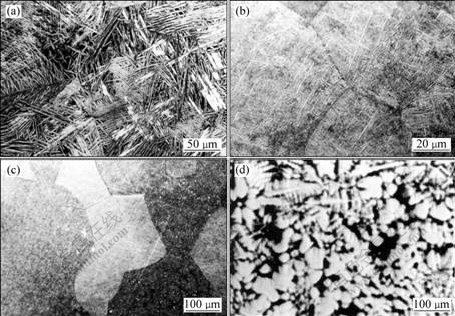
Fig.1 Microstructures of Ti-Nb alloys: (a) Ti-5Nb; (b) Ti-10Nb; (c) Ti-15Nb; (d) Ti-20Nb

 Fig.2 TEM images of Ti-Nb alloy: (a) Ti-5Nb; (b) Ti-10Nb; (c) SAD pattern of α phase in (b)
Table 1 Main performances of Ti-Nb alloys

Like Vickers hardness, the compression strength of Ti-Nb alloys (1 442-1 522 MPa) is much higher than that of Ti-6Al-4V(960 MPa). Among all Ti-Nb alloys, Ti-20Nb alloy has the highest compression strength (1 522 MPa), and Ti-15Nb alloy has the lowest strength (1 401 MPa), while Ti-20Nb alloy has the lowest compression elastic modulus (23.3 GPa), and Ti-5Nb alloy has the highest compression elastic modulus (26.7 GPa). Ti-15Nb alloy has the lowest compression ratio (12.3%) and that of Ti-5Nb alloy is the highest. The crystal grain structure has an effect on the mechanical properties.
3.2 Dry wear properties of Ti-Nb alloys
Variation of friction coefficients of Ti-Nb alloys against Gr15 ball with the lasting test time is shown in Fig.3. When Nb content is 5%, the friction coefficient is not constant but takes a higher value between 0.74 and 0.80 (curve 1) at the final stage after cycling for about 950 s. When Nb content is 10%, the friction coefficient has a sable stage between 0.27 and 0.32 and remains constant between 0.74 and 0.76 (curve 2) after cycling for 950 s. When Nb content is 15%, the friction coefficient is between 0.76 and 0.86 (curve 3) at the final stage after cycling for 950 s. When Nb content is 20%, the friction coefficient is between 0.79 and 0.90 (curve 4) at the final stage after cycling for 950 s.
Under dry condition, at the early stage the alloy structure is slightly pressed. In the second stage, some particles gradually detach at the two edges of contact accompanied by a rapid increase of friction coefficient. Then, more and more particles are detached. The friction coefficient is not constant but takes a higher value at the final stage. The friction coefficient of Ti-10Nb alloy among all of Ti-Nb alloys is the lowest. The friction coefficient reflects the wear resistance at some degree.

Fig.3 Variations of friction coefficients of Ti-Nb alloys against Gr15 ball with cycling time
Fig.4 and Fig.5 show the SEM photographs of worn surfaces and wear particles of Ti-Nb alloys against Gr15 ball, respectively. The worn surface of Ti-10Nb alloy is observed to be much smoother than that of other Ti-Nb alloys (Fig.4(b)) and the wear particles are smaller than those of other Ti-Nb alloys (Fig.5(b)). The sizes of wear particles are 0.5-2.5 μm and a few bigger wear particles are observed. The light furrows are observed on the worn surfaces of Ti-10Nb, Ti-15Nb and Ti-20Nb alloys ((Fig.4(b), Fig.4(c) and Fig.4(d)) and the wear particles of Ti-15Nb and Ti-20Nb alloys are bigger (Fig.5(c) and Fig.5(d)). The average size of wear particles is about 2 μm and the wear particles of Ti-15Nb appear in aggregation (Fig.5(b)).
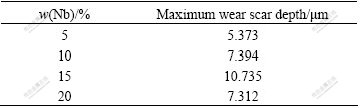
The wear track profiles measured by Nano Indenter XP on the worn specimens are shown in Fig.6. The wear track profile of Ti-15Nb alloy is very smooth. The wear track profiles of Ti-5Nb, Ti-10Nb and Ti-20Nb alloys are not smooth. The wear particles accumulated on the worn surface cause this result. Table 2 shows the maximum wear scar depth of Ti-Nb alloys. For Ti-Nb alloys, Ti-5Nb alloy shows the smallest wear depth and best wear resistance and Ti-15Nb alloy shows the largest wear depth and worst wear resistance.
When the clinical longevity of a restoration is considered, its wear resistance is one of the important characteristics that must be studied. However, wear testing procedures are not standardized, and many types of wear testing have been used[1]. Generally, around or cone-shaped specimen acting as a stylus opposes a flat specimen[12]. In general, metals with low theoretical tensile and shear strengths exhibit higher coefficients of friction than high-strength materials[1]. An association between wear characteristics and hardness was reported: wear value decreases with increasing hardness. When the properties of titanium materials are evaluated by parameters obtained from indentation depth, the depth was found to decrease with increasing content of impurities. The change in depth value is caused by the effect of yield strength and flow stress[13-14]. However, in previous studies on CP titanium and some titanium alloys, OHKUBO C et al did not find any correlations between the amount of wear and the strength data. And they also found that there is no correlation between the bulk hardness and wear[1]. In addition, there are other factors for wear characteristics. Wear particles have an influence by a surface-damage mechanism, and the surface condition is reported to be influential in the wear characteristics of dental amalgam alloys[15-16]. We did not find any correlations between the amount of wear and the strength data of Ti-Nb alloys. Otherwise, it was also found that there is no correlation between the bulk hardness and the wear of Ti-Nb alloys.

Fig.4 SEM photographs of worn surfaces of Ti-Nb alloys against Gr15 ball: (a) Ti-5Nb; (b) Ti-10Nb; (c) Ti-15Nb; (d) Ti-20Nb

Fig.5 SEM photographs of wear particles of Ti-Nb alloys against Gr15 ball: (a) Ti-5Nb; (b) Ti-10Nb; (c) Ti-15Nb; (d) Ti-20Nb

Fig.6 Cross-section profiles of wear tracks for Ti-Nb alloys: (a) Ti-5Nb; (b) Ti-10Nb; (c) Ti-15Nb; (d) Ti-20Nb
Table 2 Maximum wear scar depth of Ti-Nb alloys
4 Conclusions
1) The microstructure and mechanical properties of Ti-Nb alloys was evaluated. For Ti-5Nb alloy, the acicular α crystal grain is observed and the coarse equiaxed crystal and the fine, acicular α crystal grain are observed in Ti-10Nb alloy. For Ti-15Nb alloy, only the equiaxed crystal is observed and the equiaxed and dendritic α crystal grain is observed in Ti-20Nb alloy.
2) The Vickers hardness values of Ti-Nb alloys increase with the increase in the niobium content. The compression modulus decreases with the increase in the niobium content. Among all Ti-Nb alloys, Ti-20Nb alloy has the highest compression strength (1 522 MPa) and Ti-15Nb alloy has the lowest strength (1 401 MPa).
3) Wear characteristics can be partially attributed not only to mechanical properties but also to surface condition and the microstructures of Ti-Nb alloys. For Ti-Nb alloys, Ti-5Nb alloy shows the smallest wear depth and best wear resistance and Ti-15Nb alloy shows the largest wear depth and worst wear resistance.
4) The phenomenon of furrow cut happens and furrows form during wear tests.
References
[1] OHKUBO C, SHIMURA I, AOKI T, HANATANI S, HOSOI T, HATTORI M, ODA Y, OKABE T. Wear resistance of experimental Ti-Cu alloys [J]. Biomaterials, 2003, 24(20): 3377-3381.
[2] ATWOOD R C, LEE P D, CURTIS R V. Modeling the surface contamination of dental titanium investment castings [J]. Dental Materials, 2005, 21(2): 178-186.
[3] LU X, LENG Y. Electrochemical micromachining of titanium surfaces for biomedical applications [J]. Journal of Materials Processing Technology, 2005, 169(2): 173-178.
[4] RACK H J, QAZI J I. Titanium alloys for biomedical applications [J]. Materials Science and Engineering C, 2006, 26(8): 1269-1277.
[5] SILVA H M, SCHNEIDER S G, NETO C M. Study of nontoxic aluminum and vanadium-free titanium alloys for biomedical applications [J]. Materials Science and Engineering C, 2004, 24(5): 679-682.
[6] LEINENBACH C, FLECK C, EOFLER D. The cyclic deformation behaviour and fatigue induced damage of the implant alloy Ti6Al7Nb in simulated physiological [J]. International Journal of Fatigue, 2004, 26(8): 857-864.
[7] CUI W F, JIN Z, GUO A H, ZHOU L. High temperature deformation behavior of α+β-type biomedical titanium alloy Ti-6Al-7Nb [J]. Materials Science and Engineering A, 2009, 499(1/2): 252-256.
[8] HO W F, JU C P, CHERN Lin J H. Structure and properties of cast binary Ti-Mo alloys [J]. Biomaterials, 1999, 20(22): 2115-2122.
[9] LI S J, YANG R, NIINOMI M, HAO Y L, CUI Y Y. Formation and growth of calcium phosphate on the surface of oxidized Ti-29Nb-13Ta-4.6Zr alloy [J]. Biomaterials, 2004, 25(13): 2525- 2532.
[10] KIKUCHI M, TAKADA Y, KIYOSUE S, YODA M, WOLDU M, CAI Z, OKUNO O, OKABE T. Mechanical properties and microstructures of cast Ti-Cu alloys [J]. Dental Materials, 2003, 19(3): 174-181.
[11] CHAI Y W, KIM H Y, HOSODA H, MIYAZAKI S. Self-accommodation in Ti-Nb shape memory alloys [J]. Acta Materialia, 2009, 57(14): 4054-4064.
[12] RAMP M H, RAMP L C, SUZUKI S. Vertical height loss: An investigation of four restorative materials opposing enamel [J]. Journal of Prosthodontics, 1999, 8(4): 252-257.
[13] GIL F J, FERNNDEZ E, MANERO J M, PLANELL J A, SABRI J, CORTADA M, GINER L. A study of the abrasive resistance of metal-allys with applications in dental prosthetic fixators [J]. Bio-medical Materials and Engineering, 1995, 5(3): 161-167.
[14] SUNDARARAJAN G, TIRUPATAIAH Y. The hardness-flow stress correlation in metallic materials [J]. Bulletin of Materials Science, 1994, 17(6): 747-770.
[15] BUCHANAN R A, RIGNEY JR. E D, WILLIAMS J M. Wear-accelerated corrosion of Ti-6Al-4V and nitrogen-ion-implanted Ti-6Al-4V: Mechanisms and influence of fixed-stress magnitude [J]. Journal of Biomedical Materials Research, 1987, 21(3): 367-377.
[16] YAP A, ONG L, TEOH S H, HASTINGS G W. Comparative wear ranking of dental restoratives with the biomat wear simulator [J]. Journal of Oral Rehabilitation, 1999, 26(3): 228-235.
(Edited by CHEN Ai-hua)
Foundation item: Project(20080440850) supported by China Postdoctoral Science Foundation; Project(ZJY0605-02) supported by the Natural Science Foundation of Heilongjiang Province, China
Corresponding author: XU Li-juan; Tel/Fax: +86-451-86418802; E-mail: xljuan@hit.edu.cn

