Trans. Nonferrous Met. Soc. China 25(2015) 960-965
Plotting and application of predominance area diagram of In-S-O system based on topological rules
Fu-chun XIE1,2, Zhou-lan YIN1, Jun TAN1, Chang-qing LIU1, Ping-min ZHANG1
1. Key Laboratory of Resources Chemistry of Nonferrous Metals, Ministry of Education, School of Chemistry and Chemical Engineering, Central South University, Changsha 410083, China;
2. College of Mechanical Engineering, Hunan Institute of Engineering, Xiangtan 411101, China
Received 11 April 2014; accepted 28 July 2014
Abstract: The mathematical topological rule was proposed to plot the predominance area diagram. Based on the phase rules, the components of In-S-O system were analyzed and the coexisting points of three condensed phases were determined. Combined with the topological rules and thermodynamic calculation, four relation diagrams between the coexisting points of three condensed phases, which were denoted as α, β stable plane-topological diagram and unstable plane-topological diagram, were plotted for the In-S-O system. The results show that α stable plane topological diagram is in accordance with the predominance area diagram of In-S-O system plotted by traditional methods, which indicates that the new method is feasible to plot the predominance area diagram of In-S-O system. Meanwhile, β unstable plane-topological diagram can be used to elucidate the indium production with the bath smelting process.
Key words: In-S-O system; predominance area diagram; topological rules; thermodynamic calculation; bath smelting
1 Introduction
Predominance area diagram plays an important role in the bath smelting process. It was first proposed to describe the pyrometallurgy process by KNACKE and NEUMAN [1]. It was successfully used in Pb-S-O system by KELLOGG and BASU [2], so it was also called Kellogg diagram. Until now, CHAKRABOTI and JHA [3], SCHUHMANN et al [4] and ERIC and TIMUCIN [5], had carried out thermodynamic researches in Me-S-O system. However, some problems still remained on plotting the predominance area diagram of Me-S-O. For example, the phase of metallic substance was usually fixed in the area of lower oxygen and sulfur pressure. The actual situation could not be reflected that some metallic substances exist at higher oxygen and sulfur pressure in modern bath smelting furnace, e.g. PbS+O2=Pb+SO2 [6].
It is well known that the predominance area diagram is a special type of the generalized topology iconography because the mathematical topological theory is the basis of the iconography [7]. It was determined by reasoning and logical argument, which was different from exhaust algorithm of YAO et al [8] to build the plane-topological diagram. Therefore, it may be more efficient to plot the predominance area diagram of Me-S-O system based on the topological theory, which would reflect the actual situation in the bath smelting process.
In this work, based on the phase rule and topological theory [9], four plane-topological diagrams were constructed. By combining the plane-topological diagrams with the thermodynamic equilibrium principle, a new approach was applied to plotting the plane- topological diagram of Me-S-O system with In-S-O system as an example.
2 New approach based on phase rule and mathematical topological theory
2.1 Phase rule analysis
It is supposed that there are N components, r independent reactions and r′ constraints in the system, the independent components n can be expressed as n=N-r-r′, and the phase rule can be written as
f=N-r-r′-f+2 (1)
where f is the degree of freedom, f is the number of phases, 2 is the variable of temperature and pressure [10]. Based on the analysis of phase principle in Me-S-O system, there are five coexisting phases (four condensed phases and one gas phase) when the degree of freedom f is zero and the probable four condensed phases are Me, MeS, MeO and Me(SO4).
2.2 Mathematical topological rule analysis
Based on the topological rules, the plane- topological diagram consists of red, yellow, blue and green, where the four colors meet at one point [11]. Without the evolution of image rotating and flipping, there is only one diagram as shown in Fig. 1.

Fig. 1 Plane-topological diagram consisting of red, yellow, blue and green
There are four kinds of combinations when three colors are handpicked freely to construct one combination from the four colors. So, there are four meeting points based on the three coexistence colors: red, yellow and blue (A); yellow, blue and green (B); red, blue and green (C); red, yellow and green (D).
If there are two meeting points based on the above coexisting colors and each color is limited to appear once in each plane area without the evolution of image rotating and flipping, there will be six basic plane-topological diagrams made up of four colors, which are shown in Fig. 2.
In Fig. 2, if (a) is clockwise, it can be seen that (b) is counterclockwise, thus (a) and (b) are mutually conjugated. By contrast, both (c) and (d) are clockwise, they are unconjugated as well as (e) and (f). If the colors of red, yellow, blue and green are replaced by Me, MeS, MeO and Me(SO4) respectively, the plane-topological diagrams (a) and (b) are the best topological embryonic graphs to build the predominance area diagram of Me-S-O system.
2.3 Definition of plane-topological diagram
For the plane-topological diagram Fig. 2(a), if the colors have the evolution of image rotating and flipping, there will be four basic plane-topological diagrams, as shown in Fig. 3.

Fig. 2 Six kinds of basic plane diagrams made up of red, yellow, blue and green
If the logarithmic coordinates of oxygen and sulfur pressure are added into the above four diagrams, the lg pO2 and lg pS2 at the meeting points can be calculated to draw the plane-topological diagrams. However, there are only two diagrams to meet the requirements [12], α stable topology diagram and α unstable topology diagram. Each Me-S-O system fixes only one diagram, which includes four condensed phases of metal, metal sulfides, metal oxides and metal sulfate. The stable topology diagram is usually called the predominance area diagram.
The same principle was applied to the plane-topological diagram Fig. 2(b). Only two diagrams meet the requirements, i.e., β stable topology diagram and β unstable topology diagram.
The corresponding stable and unstable topological diagrams of α and β are shown in Fig. 4.
3 Applications of In-S-O system
3.1 Thermodynamic calculation of In-S-O system
For the α plane-topological diagram, Ai (In, In2S3, In2O3 ) and Bi (In2S3, In2O3, In2(SO4)3) are determined respectively by two simultaneous equilibrium equations in Table 1, where the activity of the ideal condensed phase (α) is 1 [13]. At 700, 800 and 900 K, lg pO2 and lg pS2 at coexisting points Ai and Bi are shown in Table 2. The relevant thermodynamic data are from the thermochemical data of pure substances [14].

Fig. 3 Four basic plane-topological diagrams formed by four colors with evolution of image rotating and flipping

Fig. 4 Stable and unstable topological diagrams of α and β
Table 1 Equilibrium equations of coexisting points in α plane-topological diagram

Table 2 Logarithmic values of oxygen and sulfur pressure of coexisting points in α plane-topological diagram

Similarly, Ci (In, In2S3, In2(SO4)3) and Di (In, In2O3, In2(SO4)3) can be determined respectively, which are shown in Table 3. At 700, 800 and 900 K, the values of lg pO2 and lg pS2 of Ci and Di are shown in Table 4.
All the single direction lines are determined by Eqs. (2)-(5) at constant temperature. Since there is only one gas phase for Reactions (2)-(4), the corresponding monotropic lines are a segment of perpendicular lines. When Reaction (5) reaches its balance, the expression of the single direction line is shown in Eq. (6).
 (6)
(6)
where the relationship between lg pO2 and lg pS2 is linear, lg pS2 can be determined at given lg pO2. That is to say, one point of the plane-topological diagram is defined [15]. When this point is connected with its homologous coexisting point of three phases, the monotropic line of reaction (5) is formed. lg pO2 and lg pS2 for Eq. (6) in Table 5 were calculated at 700, 800 and 900 K, which illustrates the univariant equilibrium line between In2O3 and In2(SO4)3.
3.2 Plane-topological diagram of In-S-O system
The coordinate system is set up with lg pO2 and lg pS2. Ai (In, In2S3, In2O3) and Bi (In2S3, In2O3, In2(SO4)3) are constructed according to Table 2. Ci (In, In2S3, In2(SO4)3) and Di (In, In2O3, In2(SO4)3) are determined as listed in Table 4. Combined with the data listed in Table 5, α and β plane-topological diagrams can be plotted at 700, 800 and 900 K, which are shown in Figs. 5 and 6.
4 Analysis and application of plane- topological diagram
It is obvious that α stable plane-topological diagram of In-S-O system is consistent with the isothermal equilibrium diagram. It can be concluded that α stable plane-topological diagram is the predominance area diagram of In-S-O system. From α stable plane-topological diagram in Fig. 5, based on the perspective of classical thermodynamics, it can be deduced that Ai (In, In2S3, In2O3) and Bi (In2S3, In2O3, In2(SO4)3) are stable at constant temperature, oxygen and sulfur pressure. α stable plane-topological diagram is self-explanatory and the descriptive commentary will be brief. The stable area of indium or In2S3 increases while the stable area of In2O3 or In2(SO4)3 decreases with the increase of the temperature when oxygen or sulfur pressure is constant. So, α stable plane-topological diagram of In-S-O system can be used to guide the pyrometallurgical process of the metallic Indium.
However, Ci (In, In2S3, In2(SO4)3) and Di (In, In2O3, In2(SO4)3) are unstable in β unstable plane-topological diagram of Fig. 6. For example, it contradicts the thermodynamic stability criterion that metallic indium appears unexpectedly in the area where the oxygen and sulfur pressures are both higher. In fact, metallic indium may sometimes exist at higher oxygen and sulfur pressures in the actual bath smelting process. So, β unstable plane-topological diagram of In-S-O system develops a new method to explain the practical phenomenon.
Table 3 Equilibrium equations of coexisting points in β plane-topological diagram

Table 4 Logarithmic values of oxygen and sulfur pressure in β plane-topological diagram
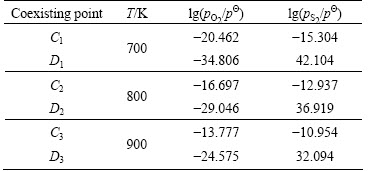
Table 5 lg pO2 and lg pS2 of monotropic equilibrium line between In2O3 and In2(SO4)3


Fig. 5 α stable plane-topological diagram of In-S-O system at 700, 800 and 900 K

Fig. 6 β unstable plane-topological diagram of In-S-O system at 700, 800 and 900 K
5 Conclusions
1) A new method was established to plot the predominance area diagram of In-S-O system by combining the mathematical topological rules with the thermodynamic equilibrium principle. Based on the phase rule and the topological rule, four basic plane-topological diagrams were built to get the predominance area diagram, α stable and α unstable plane-topological diagram, β stable and β unstable plane-topological diagram. α stable plane-topological diagram of In-S-O system is determined to be the predominance area diagram of In-S-O system.
2) Although β unstable plane-topological diagram of In-S-O system is inconsistent with the isothermal equilibrium diagram of Me-S-O system, it develops a new method to explain the practical phenomenon that metallic indium may sometimes exist at higher oxygen and sulfur pressures during the bath smelting process. The new method can overcome the deficiency of traditional predominance area diagram that metal is fixed at lower oxygen pressure and sulfur pressure.
References
[1] KNACKE O, NEUMAN W. The volatilisation of lead from technical zinc oxide [J]. Erzmetall, 1956, 9(1): 261-270.
[2] KELLOGG H H, BASU S K. Thermodynamic properties of the system Pb-S-O to 1100-degrees-K [J]. Transactions of the American Institute of Mining and Metallurgical Engineers, 1960, 218(1): 70-81.
[3] CHAKRABORTI N, JHA P K. Pb-S-O vapor system re-evaluated using genetic algorithms [J]. Journal of Phase Equilibria and Diffusion, 2004, 25(5): 421-426.
[4] SCHUHMANN R, CHEN P C, PALANISAMY P, SARMA D H R. Thermodynamics of converting lead sulfide [J]. Metallurgical Transactions B, 1976, 7(1): 95-101.
[5] ERIC R H, TIMUCIN M. Thermodynamic analysis of the direct converting of lead sulphide [J]. Journal of the South African Institute of Mining and Metallurgy, 1989, 89(2): 33-39.
[6] PENG Rong-qiu. Metallurgy of lead [M]. Changsha: Central South University Press, 2004: 65-66. (in Chinese)
[7] ARMSTRONG M A. Basic topology [M]. SUN Yi-feng, trans. Beijing: People’s Posts and telecommunications Publishing House, 2010: 1-17. (in Chinese)
[8] YAO Teng-meng, TAN Jun, LIU Chang-qing, LI Jie, CHEN Qi-yuan, WANG Hui, LIAO Zhou, ZHANG Ping-min. Plotting and application of predominance area diagram of Pb-S-O system based on topological rules [J]. The Chinese Journal of Nonferrous Metals, 2013, 23(3): 836-842.(in Chinese)
[9] PELTON A D, KOUKKARI P, PAJARRE R, ERIKSSON G. Para-equilibrium phase diagrams [J]. The Journal of Chemical Thermodynamics, 2014, 72(2): 16-22.
[10] CHEN Qi-yuan, LIU Shi-jun. Physical chemistry [M]. Beijing: Science Press, 2011: 124-127. (in Chinese)
[11] MA Jun-hai, WANG Wen-fu, QI Xiang-qian. The theory and technology of modern cartography [M]. Harbin: Harbin Cartographic Publishing House, 2008: 120-128. (in Chinese)
[12] DENISOVA E A, UZDOVSKII V V, KHAINOVSKII V I. Multichannel photocells for image converters with color separation [J]. Semiconductors, 2011, 45(13): 1684-1688.
[13] DING Zhi-ying, CHEN Qi-yuan, YIN Zhou-lan, LIU Kui. Predominance diagrams for Zn(II)-NH3-Cl-H2O system [J]. Transactions of Nonferrous Metals Society of China, 2013, 23(3): 832-840.
[14] BARIN I. Thermochemical data of pure substances [M]. CHENG Nai-liang, et al, transl. Beijing: Science Press, 2008: 846-1428.
[15] JENKINS S. Quantum topology phase diagrams for molecules, clusters, and solids [J]. International Journal of Quantum Chemistry, 2013, 113(11): 1603-1608.
基于拓扑规则In-S-O体系优势区图的绘制与应用
谢富春1,2,尹周澜1,谭 军1,刘常青1,张平民1
1. 中南大学 化学化工学院 有色金属资源化学教育部重点实验室,长沙 410083;
2. 湖南工程学院 机械工程学院,湘潭 411101
摘 要:运用数学拓扑规则绘制优势区图。基于相律分析,确定In-S-O 体系可能存在的三凝聚相点;利用拓扑规则分析和热力学计算,绘制该体系三凝聚相点之间的4种关联图―α型和β型稳定型和不稳定型平面拓扑图。计算结果表明,α型稳定型平面拓扑图与传统In-S-O体系优势区图一致,这说明基于拓扑规则绘制In-S-O体系优势区图是可行的;此外,β不稳定型平面拓扑图可以解释在熔池熔炼过程中铟金属的行为。
关键词:In-S-O系统;优势区图;拓扑规则;热力学计算;熔池熔炼
(Edited by Xiang-qun LI)
Foundation item: Project (2011AA061003) supported by the High-tech Research and Development Program of China
Corresponding author: Zhou-lan YIN; Tel: +86-731-88877364; E-mail: xhli@csu.edu.cn
DOI: 10.1016/S1003-6326(15)63685-8

