Cu-Al-Mn-Zn-Zr��״����Ͻ���NaCl��Һ�еĸ�ʴ��Ϊ
��Դ�ڿ����й���ɫ����ѧ��(Ӣ�İ�)2021���4��
�������ߣ���ī�� ���� Ф�� ��ӽ ����Ƽ ������
����ҳ�룺1012 - 1022
�ؼ��ʣ�ͭ����״����Ͻ𣻸�ʴ��Ϊ����������ɢ�迹
Key words��Cu-based shape memory alloy; corrosion behavior; polarization; diffusion impedance
ժ Ҫ��ͨ����̬��λ�����������绯ѧ�迹�� (EIS) ��X���߹�������� (XPS) �о�ͭ����״����Ͻ�(Cu-Al-Mn-Zn-Zr)��3.5% NaCl(��������)��Һ�еĸ�ʴ��Ϊ����ʴ��ʼʱ����״����Ͻ�����γɵ��������ﲻ�ϸ��ǺϽ���棬���¸�ʴ���ʽ��͡��Ͻ���NaCl��Һ�н���4 d��ʴ������������ɶ�ף����¸�ʴ�������Ͻ����ĸ�ʴ��Ӧ�����ɼ�����������ɢ����ת�䡣��NaCl��Һ�н���6~15 d����������ɢ�迹���������ȵ����Ӷ�������������ʴ�����У��Ͻ�ĸ�ʴ���������ı䣬��ʴ���ܳ�����ߡ���ʴ������ҪΪCuO��ZnO��Al2O3��MnO/Mn2O3��MnO2��Al(OH)3����ʴ�����и�ʴ������Cu2Oת��ΪCuO����Al2O3ת��ΪAl(OH)3��
Abstract: The corrosion behavior of a copper-based shape memory alloy (Cu-Al-Mn-Zn-Zr) in 3.5 wt.% NaCl solution was investigated by means of potentiodynamic polarization measurements, electrochemical impedance spectroscopy (EIS) and X-ray photoelectron spectroscopy (XPS). At the beginning of corrosion, oxidation products formed on the surface of the shape memory alloy and constantly covered the reaction surface, resulting in the decrease of corrosion rate. After 4 d of immersion in NaCl solution, the corrosion product layer became thick and porous, leading to the increase of corrosion rate, and the corrosion reaction mechanism changed from polarization control to diffusion control. The diffusion impedance increased with increasing thickness of the oxide layer for the samples immersed in NaCl solution for 6-15 d. During the whole corrosion process, the reaction mechanism of the alloy changed and the corrosion resistance was improved continuously. The corrosion products mainly contained CuO, ZnO, Al2O3, MnO/Mn2O3, MnO2 and Al(OH)3. Transition of the corrosion products from Cu2O to CuO and Al2O3 to Al(OH)3 occurred during corrosion.
Trans. Nonferrous Met. Soc. China 31(2021) 1012-1022
Mo-yang YIN1, Zhou LI1,2, Zhu XIAO1,3, Yong PANG1, Ya-ping LI1, Zi-yan SHEN1
1. School of Materials Science and Engineering, Central South University, Changsha 410083, China;
2. State Key Laboratory of Powder Metallurgy, Central South University, Changsha 410083, China;
3. Key Laboratory of Non-ferrous Metal Materials Science and Engineering, Ministry of Education, Central South University, Changsha 410083, China
Received 26 March 2020; accepted 2 December 2020
Abstract: The corrosion behavior of a copper-based shape memory alloy (Cu-Al-Mn-Zn-Zr) in 3.5 wt.% NaCl solution was investigated by means of potentiodynamic polarization measurements, electrochemical impedance spectroscopy (EIS) and X-ray photoelectron spectroscopy (XPS). At the beginning of corrosion, oxidation products formed on the surface of the shape memory alloy and constantly covered the reaction surface, resulting in the decrease of corrosion rate. After 4 d of immersion in NaCl solution, the corrosion product layer became thick and porous, leading to the increase of corrosion rate, and the corrosion reaction mechanism changed from polarization control to diffusion control. The diffusion impedance increased with increasing thickness of the oxide layer for the samples immersed in NaCl solution for 6-15 d. During the whole corrosion process, the reaction mechanism of the alloy changed and the corrosion resistance was improved continuously. The corrosion products mainly contained CuO, ZnO, Al2O3, MnO/Mn2O3, MnO2 and Al(OH)3. Transition of the corrosion products from Cu2O to CuO and Al2O3 to Al(OH)3 occurred during corrosion.
Key words: Cu-based shape memory alloy; corrosion behavior; polarization; diffusion impedance
1 Introduction
Copper-based shape memory alloy has some potential applications in the industry due to its low cost, wide hysteresis, superelasticity and good cold working properties [1-3]. When using shape memory alloy pipe joint for pipe connection, first expanding the shape memory pipe joint at low temperature (below its martensite transformation temperature) and connecting two pipes with it, then heating the connector at a relative elevated temperature, the shape memory alloy joint will restore its diameter to original value and hold the two pipes tightly [4]. A connector made by the shape memory alloy with wide hysteresis had a wide range of application temperatures [5]. Especially in marine engineering and petroleum engineering, the shape memory alloy pipe joint with wide hysteresis is an effective component on quickly plugging up the leakage in case of pipeline rupture caused by unexpected events [6].
Cu-Al-Mn shape memory alloy is a new kind of shape memory alloy due to good comprehensive mechanical properties and shape memory performance [7]. The researches on it mainly focused on composition design, plasticity, orderly and disordered transformation, thermoelasticity and stress-induced martensite phase transformation, heat treatment, intelligent application and other aspects [8]. In recent years, breakthroughs in plasticity and superelastic properties have made it develop rapidly in applications [9]. KAINUMA et al [10] developed a ductile Cu-Al-Mn alloy with Al content lower than 18%, which showed excellent cold processing performance; however, the martensite in this alloy after the deformation was extremely easy to be stabilized, leading to the poor reversibility of the alloy. Previous study [10] showed that the designed Cu-Al-Mn-Zn-Zr alloy had wide hysteresis, superelasticity, good martensite stabilization resistance and excellent cold working properties, which could be an ideal candidate for low cost pipe joint. However, the corrosion properties could be evaluated when using in marine engineering industry.
In this work, the corrosion behavior of the wide hysteresis Cu-Al-Mn-Zn-Zr alloy under different annealing temperatures was characterized by potentiodynamic polarization measurements, electrochemical impedance spectroscopy (EIS) and X-ray photoelectron spectroscopy (XPS). The corrosion mechanism of the alloy in 3.5 wt.% NaCl soulution was discussed.
2 Experimental
2.1 Alloy preparation
The alloy ingot was prepared by medium- frequency induction melting and iron mold casting (180 mm �� 85 mm �� 30 mm), with the raw materials of pure copper, aluminum, zinc and electrolytic manganese and Cu-Zr intermediate alloys. The composition of shape memory alloy is shown in Table 1. After removing the surface defects by mechanical milling, the ingot was homogenized at 850 ��C for 2 h, and then hot-rolled 3 times to reduce the thickness from 20 to about 2.5 mm. The hot-rolled plate was then solution- treated at 800 ��C for 20 min.
Table 1 Composition of test sample (wt.%)

2.2 Electrochemical test
For corrosion tests, the samples with dimensions of 10 mm �� 10 mm �� 2 mm were cut from the solution-treated plate by wire cutting machine. The surfaces of all samples were ground using 1200 grit sand paper and polished. The samples were subsequently immersed in 90% ethanol for 5 min to clean the surface, dried in hot air, and then immersed in 3.5 wt.% NaCl solution at room temperature ((25��2) ��C).
The polarization and electrochemical impedance tests of samples immersed in 3.5 wt.% NaCl solution for different time were carried out on an IM6ex electrochemical workstation, using Pt as the auxiliary electrode and the saturated calomel electrode (SCE) as the reference electrode. An area of 1 cm2 on the surface of sample was exposed in NaCl solution, while the other part was sealed with paraffin. All electrochemical measurements were performed after the open circuit potential (OCP) was stabilized. Samples immersed in NaCl solution for 0, 1, 3 and 6 d were tested by potentiodynamic polarization measurement. The scan range is from -0.6 to 0 V and step length is 1 mV/s. The experimental data was analyzed by Origin9. The samples immersed in NaCl solution for 0, 1, 3, 6, 10 and 15 d were tested by impedance spectra, with the AC voltage signal amplitude of 5 mV and the frequency between 10 mHz and 100 kHz. The impedance data were analyzed by Zview software.
2.3 X-ray photoelectron spectroscopy (XPS) analysis
The samples immersed in NaCl solution for 1 and 15 d were used to investigate the corrosion products of the designed alloy during corrosion. The corrosion product layer was measured by K�� 1063 X-ray photoelectron spectroscopy (thermal Fisher science), using a monochromatic Al K�� X-ray source. The spot diameter was 400 ��m. The step length of wide scanning was 1 eV and step length of narrow scanning was 0.05 eV. High- resolution photoelectron spectra of Cu 2p, Al 2p, Zn 2p and Mn 2p were tested.
3 Results
3.1 Potentiodynamic polarization behavior
The polarization curve is widely used to monitor the corrosion rate of alloys. By analyzing the polarization curve, the corrosion current density (Jcorr), corrosion potential (��corr) and polarization slopes (��a and ��c) can be obtained. The corrosion rate and corrosion resistance of the sample can be analyzed by corrosion current density and corrosion potential. Figure 1 shows the polarization curves of samples immersed in NaCl solution for different time. The curve recorded as 0 d indicates that a freshly polished specimen is exposed to newly- prepared NaCl solution.

Fig. 1 Polarization curves of samples immersed in NaCl solution for different time
Since the analysis of the polarization curve must meet the polarization control conditions, the following equation can be used to fit the data within the range of (��corr��0.1) V [11]:
 (1)
(1)
where J and �� are the polarization current density and applied potential in the polarization curve, respectively, Jcorr is the corrosion current density, ��corr is the self-corrosion potential, and ��a and ��c are the anode and cathode Tafel slopes, respectively, which can be expressed as [12]:
 (2)
(2)
Ja and Jc are the anodic and cathodic current densities corrected for any changes in the reactant concentration on the electrode surface with respect to its bulk value, respectively.
Equation (1) shows the relationship between polarization current density and overpotential. The corrosion current density (Jcorr) and Tafel slopes (��a and ��c) can be fitted from the polarization curves. Table 2 shows the fitting results of electrochemical parameters. The Adj. R-square ( ) shows the goodness of fit, and can be computed by [13]
 (3)
(3)
where TSS is the total sum of square, and RSS is the residual sum of square. The values for the equivalent circuits are given in Table 2, which are close to 1.
Table 2 Corrosion current density Jcorr, corrosion potential ��corr, ��a, ��c and  of fitting results

The corrosion current density decreases with the increase of the immersion time, indicating that the reaction rate of the alloy surface decreases continuously in the first 6 days. As the corrosion develops with time, the surface activity increases, leading to a decrease of the corrosion potential in the first 4 days. However, it increases at 6 d. The anodic Tafel slope decreases significantly at 1 d, then keeps stable, and rises again after corrosion for 4 d.
3.2 Impedance spectra
Figure 2 shows the electrochemical impedance spectra of samples immersed in NaCl solution for different time. The Nyquist spectra show a linear pattern in the high frequency zone and a semicircle pattern in the low frequency zone. The impedance spectrum at 0 d is composed of a high frequency capacitive reactance arc and a sloping line with a slope of 1, suggesting that the surface of the sample was smooth without oxidation product. Impedance spectra from 1 to 15 d contain the multiple time constant. With the increase of immersion time, the radius of the semicircle of Nyquist plot increases, suggesting that the charge transfer resistance of the oxide film increases with the immersion time. The width of the peak in the Bode plot in Fig. 2(b) increases with the increase of the immersion time, and two obvious peaks can be found in the Bode plots at the immersion time of 10 and 15 d. The phase angle of the sample exposed for 10 d is higher than that of sample exposed for 15 d in low frequency region.
According to the characteristics of the alloy and its impedance spectrum, three different equivalent circuits were used to fit the impedance data of samples exposed in NaCl solution for different time. Three similar equivalent circuits were selected to describe the corrosion behavior of Cu-Al-Mn-Zn-Zr alloy in this study according to Ref. [14]. Table 3 shows the corresponding equivalent circuits used for fitting the impedance data. Equivalent elements are as follows: Rsol is resistance of the electrolyte; CPE1 and CPE2 are constant phase elements; Rct is charge transfer resistance; Rfilm is resistance of the oxide film formed on the metal surface; Wo is semi-infinite Warburg impedance; Ws is finite Warburg impedance; ��2 is the goodness of fit parameter.
Equivalent circuit I represents a sample with the bare surface of metal under semi-infinite diffusion condition. Equivalent circuits II and III refer to the two forms of Rsol(CPE1(Rfilm(CPE2 Zf))) that is the equivalent circuit of electrode coated with an inert porous layer. Zf is Faraday impedance on the electrode surface, which is the sum of charge transfer resistance and diffusion impedance. Without considering the diffusion impedance, Zf can be replaced by charge transfer resistance, Rct, in Equivalent circuit II. If considering the contribution of diffusion to Faraday impedance, Zf should be replaced by the diffused Warburg impedance (WR) in series with a charge transfer resistance, and the equivalent circuit can be expressed with equivalent circuit III. For the corrosion process of copper alloys, equivalent circuit III was often used to characterize the diffusion impedance of ions inside the surface corrosion product layer [15].
The electric double layer formed on the surface can generally be equivalent to a capacitor. However, due to the influence of dispersion effect, the frequency response characteristics of the electric double layer are different from those of the pure capacitor. Therefore, the CPE is used to represent the electric double layer, and its impedance value (ZCPE) can be given by the following equation [16]:
ZCPE=Q(j��)-n (4)
where 1/Q is the admittance of the electrical double layer capacitance, j is the imaginary number (j2=-1), �� is the angular frequency and n is the CPE exponent. The CPE exponent can be affected by the surface state of the electrical double layer. CPE is equivalent to the pure resistance R for n=0, pure capacitance for n=1, and inductance L for n=-1, respectively.

Fig. 2 Electrochemical impedance spectra of samples immersed in NaCl solution for different time
Table 3 Corresponding equivalent circuits and goodness of fit parameter (��2)

The CPEs in Equivalent circuits I and II are equivalent to the capacitances of electric double layer or compact passive film. Q can be expressed as [17]
 (5)
(5)
where �� is the dielectric constant, ��0 is the permittivity of the free space and d is the thickness of the space charge layer [18].
The diffusion in the corrosion process can be expressed by Warburg impedance. When the thickness of diffusion stagnant layer is limited, Warburg impedance is denoted as Ws, and its impedance value (ZW) can be given by the following equation [19]:
 (6)
(6)
where
 (7)
(7)
 (8)
(8)
where �� is the Nernst diffusion layer thickness, D is the average value of the diffusion coefficients of the species, and �� is the Warburg coefficient defined as
 (9)
(9)
where DM is the diffusion coefficient of the metallic ion, A is the electrode surface area (1 cm2), n1 is the number of transferred electrons, R is the molar gas constant, F is the Faraday constant, T is the thermodynamic temperature, and CM is the bulk concentration of the diffusing species. When the thickness of diffusion stagnant layer �� is much close to ��, Warburg impedance can be expressed by semi-infinite diffusing impedance Wo. The imaginary part of the Wo impedance is equal to the real part. Wo is an oblique line with a slope of 1 in Nyquist plots.
In equivalent circuit III, the Warburg impedance is characterized the diffusion process inside the surface oxide product layer [20], ��, which represents the thickness of the film where the diffusion takes place.
According to the above analysis, impedance spectrum of 0 d sample was fitted by equivalent circuit I, and those of 1-15 d samples were fitted by equivalent circuits II and III, respectively. The Chi-square of the comparison results was calculated to select the best fitting model. The goodness of fit parameter ��2 for each of the three equivalent circuits was calculated by the following equation [21]:
 (10)
(10)
where N is the number of data points, Zi�� and Zi�� are the measured real and imaginary impedances, respectively, Zi��(��i) and Z��(��i) are the calculated real and imaginary impedances from the model, respectively, and ��2 is the variance of the measured data.
According to the data in Table 3, equivalent circuit II could be better to characterize the impedance spectrum of 1 and 2 d samples, while equivalent circuit III could characterize the impedance spectrum of 4, 6, 10 and 15 d samples. The fitting results are shown in Table 4.
Table 4 Elements of equivalent circuit for new alloy after being immersed in salt spray environment for different time
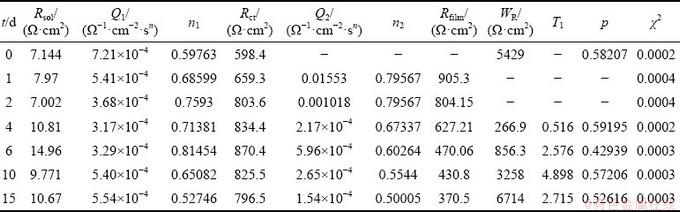
According to the results in Table 4, the corrosion products formed on the surface of the sample have a greater hindrance to corrosion reaction rate with the increase of corrosion time. In the impedance spectra of 0 to 6 d, the charge transfer resistance Rct increases with the increase of the corrosion time. The growth rate of Rct slows down at 4 and 6 d, and decreases slowly at immersion time of 10 and 15 d. There is a significant Warburg impedance in the 4-15 d impedance spectra, where WR and T1 increase with the increase of corrosion time. Although the Rfilm decreases with the increase of the corrosion time, the total impedance of the sample shows an upward trend.
During the corrosion process, oxidation products are constantly formed on the surface of the sample. It is speculated that during 1-2 d corrosion process, the alloy surface has not completely covered by corrosion products. But with the increase of the coverage area, the charge transfer resistance increases.
The results also show that Warburg impedance appears for impedance spectra at 4 and 6 d. WR increases with the increase of corrosion time but is still less than Rct, indicating that the corrosion product layer completely covers the surface of the alloy and influences the diffusion of ion [22]. The decrease of the surface area of the alloy makes the charge transfer resistance continue to increase, while the increase of ion concentrations in the porous oxidation product layer also makes Rfilm continuously decrease. However, with a small T1 value and a thin oxide layer, the corrosion product layer has little influence on the diffusion, and the corrosion rate is still under the polarization- controlled.
In the impedance analysis results of 10-15 d, the charge transfer resistance decreases slowly, and WR and T1 values significantly increase, indicating that the corrosion product layer on the surface of the alloy becomes thicker and thicker according to Eqs. (6)-(8). The barrier for particle diffusion increases, and the control step of corrosion changes from polarization to diffusion. However, under the control of diffusion, the large decrease of Rfilm indicates that the concentration of ions in the surface oxidation layer increases and changes the concentration of reaction, resulting in the change of reaction rate and the slow decrease of Rct.
3.3 XPS spectra
XPS measurement was performed on sample immersed in the 3.5 wt.% NaCl solution for 1 and 15 d. Figure 4 shows the wide XPS spectra of the corrosion product layer of the samples immersed in NaCl solution for 1 and 15 d. The main elements in the passive layer are Cu, Al, Mn, Zn, Cl and O. Zr was not detected due to its low concentration in the alloy.

Fig. 3 Wide XPS spectra of corrosion product layer of samples immersed in NaCl solution for 1 and 15 d
3.3.1 Cu 2p spectra
Figure 4 shows the Cu 2p spectra of the corrosion product layer of sample immersed in NaCl solution for 1 and 15 d. The fitting parameters are given in Table 5. The spectrum of 1 d sample has a weak satellite peak at 943.6 eV and a main peak in Cu 2p1/2 spectrum with small full width. This is a typical characteristic spectrum of Cu2O. The spectrum of 15 d sample has two strong Cu2+ satellite peaks at 943.6 and 963.0 eV, respectively. The peak in Cu 2p1/2 spectrum has wide full width. This is the typical characteristic spectrum of CuO. The peaks of metallic Cu and CuO are difficult to distinguish due to the small difference of binding energy between them. The Cu 2p3/2 spectrum is used to analyze the contents of Cu, Cu2O and CuO quantitatively. The passive layer for 1 d sample contains 48.22% of Cu and 51.78% of Cu2O, while that for 15 d sample contains 82.31% of CuO and 17.69% of Cu2O.
The Cu 2p spectra confirmed from the electrochemical test that the passive film formed at earlier stage of corrosion was mostly Cu2O. With the extension of the immersion time, the content of CuO increased significantly. The transition of the corrosion layer surface principal component from Cu2O to CuO occurred during the 30 d corrosion. The results are in accordance with Ref. [23]. CuCl and Cu2(OH)3Cl, which commonly appear in the corrosive layer [24], were not found in the present study.
3.3.2 Al 2p spectra
Figure 5 shows the Al 2p spectra of the corrosion product layer of sample immersed in NaCl solution for 1 and 15 d. The fitting parameters are given in Table 6. The peak intensity of the Al 2p slightly decreased during the corrosion process.
Al mainly exists in the form of Al2O3 and Al(OH)3. Al2O3 is formed at the early stage of corrosion in the NaCl solution and its molar fraction decreases from 85.37% to 50.94% and the molar fraction of Al(OH)3 increases from 14.63% to 49.06% when the immersion time increases from 1 to 15 d. The spectra also show the Cu 3p spectra caused by Cu and its corrosion products.
3.3.3 Zn 2p spectra
Figure 6 shows the Zn 2p spectra of the corrosion product layer of sample immersed in NaCl solution for 1 and 15 d. The fitting parameters are given in Table 7. The peak at 1021.8 eV belongs to Zn and the other small peak at 1022.1 eV is attributed to ZnO. The peak intensity of Zn 2p decreases significantly and the molar fraction of ZnO in the corrosion product layer increases from 21.20% to 67.44% when the immersion time increases from 1 to 15 d. This suggests that dezincification occurs during the corrosion process.
Table 5 Fitting parameters for Cu 2p spectra

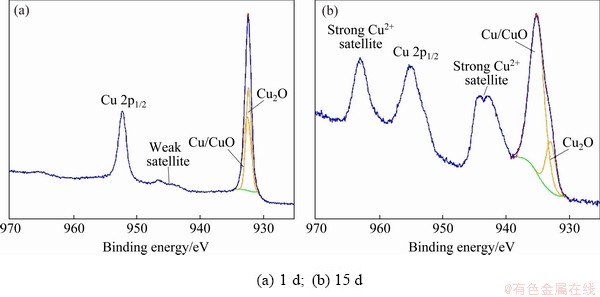
Fig. 4 Cu 2p XPS spectra of corrosion product layer of sample immersed in NaCl solution for different time

Fig. 5 Al 2p XPS spectra of corrosion product layer of samples immersed in NaCl solution for different time
Table 6 Fitting parameters for Al 2p spectra
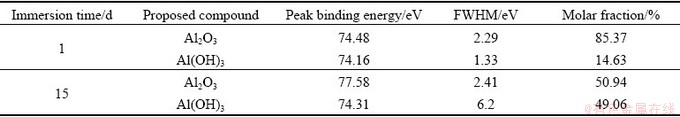
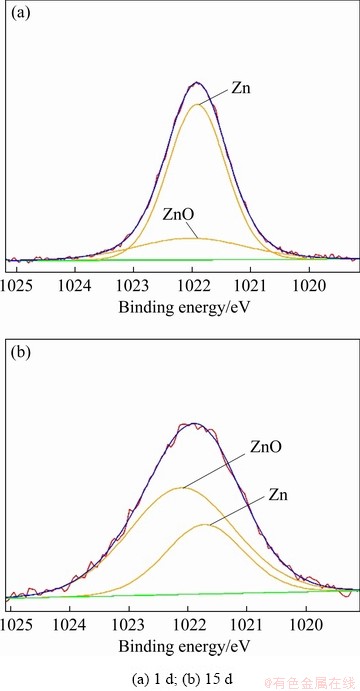
Fig. 6 Zn 2p XPS spectra of corrosion product layer of samples immersed in NaCl solution for different time
3.3.4 Mn 2p spectra
Figure 7 shows the Mn spectra of the corrosion product layer of sample immersed in NaCl solution for 1 and 15 d. The fitting parameters are given in Table 8. The peak intensity of Mn 2p of sample immersed in NaCl solution for 15 d slightly decreases compared with that of sample immersed in NaCl solution for 1 d. Mn exists in the form of Mn, MnO, Mn2O3 and MnO2. The molar fraction of Mn in the corrosion product layer decreases from 14.16% to 9.26%. The molar fraction of MnO/Mn2O3 and MnO2 change little. These suggest that the contents of Mn and its oxides mainly decrease by the dissolution of the corrosion product layer.
4 Discussion
It has been generally accepted that the corrosion of the Cu-based alloys in neutral chloride solutions involves the cathodic reduction of oxygen [25,26]:
O2+2H2O+4e��4OH- (11)
The major anodic reactions of Cu dissolution are as follows [27]:
Cu+2Cl-�� +e (12)
 +H2O��Cu2O+4Cl-+2H+ (13)
Further oxidation of Cu, with the corrosion product of CuO, occurs with a prolonged immersion time under conditions of dissolved oxygen. Cu2O could be oxidized to CuO through a sequence of reaction as follows [28]:
Cu2O+O2+H2O��2CuO+H2O2 (14)
Cu2O+H2O2��2CuO+H2O (15)
In the Zn-containing alloys, dezincification occurs because of the highly negative electrode potential in neutral chloride solutions:
Zn��Zn2++2e (16)
An additional passivation process occurs due to the formation of zinc oxide film during the dezincification process [29]:
Zn+H2O��ZnO+2H++2e (17)
An additional passivation reaction occurs in the chloride solution for alloy with Al addition. A layer of aluminum oxide is formed due to the surface dissolution of aluminum [30]:
Al+4Cl-�� +3e (18)
+3H2O��Al2O3+6H++8Cl- (19)
A dense Al2O3 film can protect the alloy from extensive corrosion but it may be continuously dissolved in chloride solutions according to Ref. [31]:
Al3+(in Al2O3��nH2O crystal lattice)+Cl-+2H2O��
Al(OH)2Cl+2H+ (20)
Al(OH)2Cl+H2O��Al(OH)3+H++Cl- (21)
or
Al3+(in Al2O3��nH2O crystal lattice)+2Cl-+2H2O��
Al(OH)2Cl2-+2H+ (22)
Al(OH)2Cl2-+H2O��Al(OH)3+H++2Cl- (23)
Progression of these reactions causes local acidity, thus accelerating dezincification and dealumination corrosion.
Table 7 Fitting parameters for Zn 2p spectra
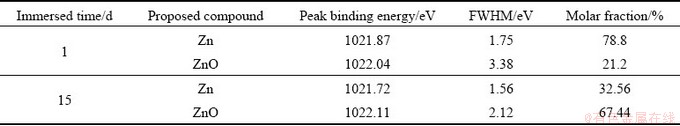
Table 8 Fitting parameters for Mn 2p spectra

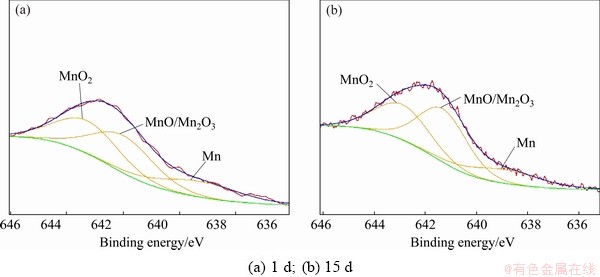
Fig. 7 Mn 2p XPS spectra of corrosion product layer of samples immersed in NaCl solution for different time
According to electrochemical analysis, for 0 d corrosion sample, Reactions (12) and (13) may take place. The oxidation products containing Cu2O and Al2O3 are formed on the alloy surface during the first 4 d corrosion. The absolute value of Tafel slope after corrosion for 1 d is lower than that of 0 d, suggesting that the corrosion reactions in 1 d are much more active. This could be attributed to the generation of Cu2O according to Reactions (14) and (15). According to potential-pH diagram of Cu-Cl--H2O, Reactions (14) and (15) are more likely to occur than Reaction (13).
Although the Tafel slope of 1 to 4 d is almost the same, the polarization current decreases and Rct increases, suggesting that the reactivity of corrosion reaction increases but the total reaction rate gradually decreases, which could be attributed to the decrease of the corrosion reaction surface area. The porous oxide product is continuously formed on the surface of the alloy and completely covers the surface at 4 d corrosion according to the previous analysis of the impedance spectrum.
After 6 d corrosion, the diffusion impedance of porous oxide layer increases. In the porous oxide layer, the concentration of ions increases and pH declines, promoting the consumption of Al2O3 and the generation of Al(OH)3. The reaction rates of Reactions (20)-(23) increase, leading to the decrease of the charge transfer resistance. The generation of Al(OH)3 promotes the formation of porous oxide layer, thus significantly increasing the diffusion impedance and improving the corrosion resistance.
5 Conclusions
(1) With the extension of corrosion time, the corrosion current density measured by the polarization curve decreased, while the total impedance measured by the EIS increased continuously. The corrosion resistance of the Cu-Al-Mn-Zn-Zr shape memory alloy increased with increase of the immersion time in NaCl solution.
(2) EIS results showed that the corrosion reaction was mainly controlled by polarization for samples immersed in NaCl solution at the first four days, and further increasing the immersion time, the reaction was mainly controlled by diffusion.
(3) The corrosion product at the first day of corrosion mainly contained Cu2O, ZnO, Al2O3, MnO/Mn2O3, MnO2 and Al(OH)3. After long time corrosion, a transition of the corrosion product from Cu2O to CuO and Al2O3 to Al(OH)3 occurred.
Acknowledgments
The authors acknowledge the financial support from the National Natural Science Foundation of China (51601227), Natural Science Foundation of Hunan Province, China (2018JJ3650), the Project of Innovation-Driven Plan and the Project of State Key Laboratory of Powder Metallurgy, Central South University, China.
References
[1] OMORI T, KUSAMA T, KAWATA S, OHNUMA I, SUTOU Y, ARAKI Y, ISHIDA K, KAINUMA R. Abnormal grain growth induced by cyclic heat treatment [J]. Science, 2013, 341: 1500-1502.
[2] GOMIDZELOVIC L, POZEGA E, KOSTOV A, VUKOVIC N, KRSTIC V, ZIVKOVIC, BALANOVIC L. Thermo- dynamics and characterization of shape memory Cu-Al-Zn alloys [J]. Transactions of Nonferrous Metals Society of China, 2015, 25(8): 2630-2636.
[3] VRSALOVIC L, IVANIC I, KOZUH S, GUDIC S, KOSEC B, GOJIC M. Effect of heat treatment on corrosion properties of CuAlNi shape memory alloy [J]. Transactions of Nonferrous Metals Society of China, 2018, 28(6): 1149-1156.
[4] MOHD J J, LEARY M, SUBIC A, GIBSON M A. A review of shape memory alloy research, applications and opportunities [J]. Materials & Design, 2014, 56: 1078-1113.
[5] OCHONSKI W. Application of shape memory materials in fluid sealing technology [J]. Industrial Lubrication and Tribology, 2010, 62: 99-110.
[6] DUERIG T W, MELTON K N, STOCKEL D, WAYMAN C Y. Engineering aspects of shape memory alloys [M]. London: Butterworth-Heinemann, 2013.
[7] DRUKER A V, PEROTTI A, ESQUIVEL I, MALARRIA J. A manufacturing process for shaft and pipe couplings of Fe-Mn-Si-Ni-Cr shape memory alloys [J]. Materials & Design, 2014, 56: 878-888.
[8] LIU Ji-li, HUANG Hai-you, XIE Jian-xin. Superelastic anisotropy characteristics of columnar grained Cu-Al-Mn shape memory alloys and its potential applications [J]. Materials & Design, 2015, 85: 211-220.
[9] LI Zhou, WANG Ming-pu, Xu Ying-gen. Material of Cu-based shape memory alloys [M]. Changsha: Central South University Press, 2010. (in Chinese)
[10] KAINUMA R, TAKAHASHI S, ISHIDA K. Thermoelastic martensite and shape memory effect in ductile Cu-Al-Mn alloys [J]. Metallurgical and Materials Transactions A: Physical Metallurgy and Materials Science, 1996, 27(8): 2187-2196.
[11] SAUD S N, HAMZAH E, ABUBAKAR T, BAKHSHESHI- RAD H R, ZAMRI M, TANEMURA M. Effects of Mn additions on the structure, mechanical properties, and corrosion behavior of Cu-Al-Ni shape memory alloy [J]. Journal of Materials Engineering and Performance, 2014, 23(10): 3620-3629.
[12] ZHANG Jian-qing. Electrochemical measurement technology [M]. Beijing: Chemical Industry Press, 2010: 79. (in Chinese)
[13] GUIDELLI R, COMPTON R G, FELIU J M, GILEADI E. Defining the transfer coefficient in electrochemistry: An assessment (IUPAC Technical Report) [R]. Pure and Applied Chemistry, 2014.
[14] KASS R E, BATES D M, WATTS D G, SEBER G A F. Nonlinear regression analysis and its applications [J]. Technometrics, 1988, 32(2): 219-220.
[15] CAO Chu-nan, ZHANG Jan-qing. An introduction to electrochemical impedance spectroscopy [M]. Beijing: Science Press, 2002. (in Chinese)
[16] ORAZEM M E, TRIBOLLET B. The electrochemical society series: Electrochemical impedance spectroscopy [M]. Pennington: John Wiley & Sons, Inc., 2017, 9: 155-162.
[17] ZAKLINA Z T, PETROVIC M M B, RADOVANOVIC M B. Cephradine as corrosion inhibitor for copper in 0.9% NaCl solution [J]. Journal of Molecular Structure, 2018, 1159: 46-54.
[18] BARSOUKOV E, MACDONALD R J. Impedance spectroscopy: Theory, experiment, and applications [M]. New Jersey: John Wiley & Sons, Inc., 2005.
[19] FRERS S E, STEFENEL M M, MAYER C, CHIERCHIE T. AC-Impedance measurements on aluminium in chloride containing solutions and below the pitting potential [J]. Journal of Applied Electrochemistry, 1990, 20(6): 996-999.
[20] MARTIN F J, CHEEK G T, O'GRADY W E, NATISHAN P M. Impedance studies of the passive film on aluminium [J]. Corrosion Science, 2005, 47(12): 3187-3201.
[21] DAISTRICK I D, MACDONALD J R, FRANCESCHETTI D R, MACDONALD J R. Impedance spectroscopy: Emphasizing solid materials and systems [M]. New York: John Wiley & Sons, Inc., 1987.
[22] DAWSON J L, JOHN D G. Diffusion impedance��An extended general analysis [J]. Journal of Electroanalytical Chemistry and Interfacial Electrochemistry, 1980, 110(1-3): 37-47.
[23] CHANG T R, HERTING G, JIN Y, LEYGRAF C, WALINDER I O. The golden alloy Cu5Zn5Al1Sn: Patina evolution in chloride-containing atmospheres [J]. Corrosion Science, 2018, 133: 190-203.
[24] YUAN S J, PEHKONEN S O. Surface characterization and corrosion behavior of 70/30 Cu-Ni alloy in pristine and sulfide-containing simulated seawater [J]. Corrosion Science, 2007, 49(3): 1276-1304.
[25] METIKOS-HUKOVIC M, SKUGOR I, GRUBAC Z, BABIC R. Complexities of corrosion behaviour of copper�C nickel alloys under liquid impingement conditions in saline water [J]. Electrochimica Acta, 2010, 55(9): 3123-3129.
[26] PROCACCINI R, CERE S, VAZQUEZ M. Oxygen reduction on Cu-Zn alloys [J]. Journal of Applied Electrochemistry, 2009, 39(2): 177-184.
[27] KEAR G, BARKER B D, STOKES K, WALSH F C. Flow influenced electrochemical corrosion of nickel aluminium bronze��Part I. Cathodic polarization [J]. Journal of Applied Electrochemistry, 2004, 34(12): 1235-1240.
[28] SANCHEZ S R D, BERLOUIS L E A, SCHIFFRIN D J. Difference reflectance spectroscopy of anodic films on copper and copper base alloys [J]. Journal of Electroanalytical Chemistry, 1991, 307(1-2): 73-86.
[29] CHEN Bang-yi, LIANG Cheng-hao, FU Dao-jun, REN De-ming. Corrosion behavior of Cu and the Cu-Zn-Al shape memory alloy in simulated uterine fluid [J]. Contraception, 2005, 72(3): 221-224.
[30] S��RY P, OSWALD H R. On the corrosion behavior of individual phases present in aluminium bronzes [J]. Corrosion Science, 1972, 12(1): 77-80.
[31] WHARTON J A, BARIK R C, KEAR G, WOOD R J K, STOKES K R, WALSH F C. The corrosion of nickel- aluminium bronze in seawater [J]. Corrosion Science, 2005, 47(12): 3336-3367.
��ī��1���� ��1,2��Ф ��1,3���� ӽ1������Ƽ1��������1
1. ���ϴ�ѧ ���Ͽ�ѧ�빤��ѧԺ����ɳ 410083��
2. ���ϴ�ѧ ��ĩұ������ص�ʵ���ң���ɳ 410083��
3. ���ϴ�ѧ ��ɫ�������Ͽ�ѧ�빤�̽������ص�ʵ���ң���ɳ 410083
ժ Ҫ��ͨ����̬��λ�����������绯ѧ�迹�� (EIS) ��X���߹�������� (XPS) �о�ͭ����״����Ͻ�(Cu-Al-Mn-Zn-Zr)��3.5% NaCl(��������)��Һ�еĸ�ʴ��Ϊ����ʴ��ʼʱ����״����Ͻ�����γɵ��������ﲻ�ϸ��ǺϽ���棬���¸�ʴ���ʽ��͡��Ͻ���NaCl��Һ�н���4 d��ʴ������������ɶ�ף����¸�ʴ�������Ͻ����ĸ�ʴ��Ӧ�����ɼ�����������ɢ����ת�䡣��NaCl��Һ�н���6~15 d����������ɢ�迹���������ȵ����Ӷ�������������ʴ�����У��Ͻ�ĸ�ʴ���������ı䣬��ʴ���ܳ�����ߡ���ʴ������ҪΪCuO��ZnO��Al2O3��MnO/Mn2O3��MnO2��Al(OH)3����ʴ�����и�ʴ������Cu2Oת��ΪCuO����Al2O3ת��ΪAl(OH)3��
�ؼ��ʣ�ͭ����״����Ͻ𣻸�ʴ��Ϊ����������ɢ�迹
(Edited by Wei-ping CHEN)
Corresponding author: Zhou LI, Tel: +86-731-88830264, E-mail: lizhou6931@csu.edu.cn;
Zhu XIAO, Tel: +86-731-88830236, E-mail: xiaozhumse@163.com
DOI: 10.1016/S1003-6326(21)65557-7
1003-6326/ 2021 The Nonferrous Metals Society of China. Published by Elsevier Ltd & Science Press

