矿用注浆材料的宏细观跨尺度孔隙结构特征
来源期刊:中国有色金属学报(英文版)2019年第5期
论文作者:胡建华 任启帆 马少维 蒋权 蒋元建 尚俊龙 罗周全
文章页码:1067 - 1081
关键词:注浆材料;孔隙微观结构;孔隙贯通性;跨尺度研究;核磁共振;薄层断面分析;随机行走孔隙谱维数
Key words:grouting material; pore microstructure; pore interconnectivity; trans-scale study; nuclear magnetic resonance; thin-section analysis; random walk pore spectral dimension
摘 要:采取薄层断面分析和低场核磁共振(NMR)技术对3种矿用注浆材料的微观孔隙结构和孔隙率进行表征,通过图像二值化和随机行走孔隙谱维数(RWPSD)算法研究注浆材料的宏观孔隙特征――孔隙贯通性。实验结果表明:研究所用注浆材料的微观结构由层间孔、胶凝孔、毛细孔、圆形气孔和微裂缝组成。尾矿可以充填在水化产物结构中的孔隙内,使水化产物更加致密。孔隙贯通性与养护时间呈正相关,且与孔隙率之间存在一定规律。随着孔隙率和孔隙贯通性的增加,添加了速凝剂的注浆材料产生不均匀孔隙结构,使材料的凝结时间缩短、后期强度降低。
Abstract: The pore structure and porosity of three kinds of mine grouting materials were characterized based on a thin-section analysis and low-field nuclear magnetic resonance (NMR) technique. The macroscopic pore interconnectivity was investigated using binary images captured from thin sections and a random walk pore spectral dimension (RWPSD) algorithm. The experimental results show that the microstructure of the grouting materials used consisted of interlayer pores, gel pores, capillary pores, circular air holes, and small fractures, and tailings can fill some gaps in the hydration product structure and dense hydration products. There is a positive correlation between pore interconnectivity and curing time. In addition, there is a relationship between pore interconnectivity and porosity. With increasing porosity and pore interconnectivity, a non-uniform pore structure occurs in mine grouting materials with an accelerator and results in reduced setting time and later strength.
Trans. Nonferrous Met. Soc. China 29(2019) 1067-1081
Jian-hua HU1, Qi-fan REN1, Shao-wei MA1, Quan JIANG1, Yuan-jian JIANG1, Jun-long SHANG2, Zhou-quan LUO1
1. School of Resources and Safety Engineering, Central South University, Changsha 410083, China;
2. Nanyang Centre for Underground Space, School of Civil and Environmental Engineering, Nanyang Technological University, Singapore
Received 21 June 2018; accepted 29 December 2018
Abstract: The pore structure and porosity of three kinds of mine grouting materials were characterized based on a thin-section analysis and low-field nuclear magnetic resonance (NMR) technique. The macroscopic pore interconnectivity was investigated using binary images captured from thin sections and a random walk pore spectral dimension (RWPSD) algorithm. The experimental results show that the microstructure of the grouting materials used consisted of interlayer pores, gel pores, capillary pores, circular air holes, and small fractures, and tailings can fill some gaps in the hydration product structure and dense hydration products. There is a positive correlation between pore interconnectivity and curing time. In addition, there is a relationship between pore interconnectivity and porosity. With increasing porosity and pore interconnectivity, a non-uniform pore structure occurs in mine grouting materials with an accelerator and results in reduced setting time and later strength.
Key words: grouting material; pore microstructure; pore interconnectivity; trans-scale study; nuclear magnetic resonance; thin-section analysis; random walk pore spectral dimension
1 Introduction
The development of an environmental friendly, high performance grouting material based on recycling of industrial waste is an important goal in the future [1,2]. The use of tailings in grouting not only allows tailings to be reused but also extends the service life of tailing dams and generates additional economic and environmental benefits. Grouting materials require a short setting time and certain ability to resist differential pressures. The microstructure of grouting materials influences their mechanical properties. Unlike conventional materials, it is the pore structure that controls flow capacity in grouting materials, rather than total porosity [3]. Therefore, precise description and characterization of the pore system are essential for understanding the permeability and performance of grouting materials [4]. The addition of accelerators will shorten the setting time. It is also necessary to understand the effect of accelerators and the pore structure distribution (PSD) on other material properties of grouting materials [5]. In addition, the setting time and strength of grouting materials must be characterized to investigate the relationship among the setting time, strength, and failure mechanism for various curing time and pore systems [6]. However, the pore system and pore connectivity of grouting materials are difficult to characterize because of the great complexity, which is attributed to various pore sizes, complex ingredients, inhomogeneity, and strong heterogeneity [7]. At present, few studies have focused on the characteristics of tailing cement slurry in water environment, and there is still much work to be done.
Many techniques were applied to investigating the pore characteristics of concrete materials in previous studies, such as environmental scanning microscopy [8], X-ray computer tomography scanning [9], nuclear magnetic resonance (NMR) [10], scanning electron microscopy (SEM) [11], and mercury intrusion porosimetry (MIP) [12]. Among these, NMR has become a widely used analytic tool to estimate the physical properties, study the pore structure, and quantify the full-range pore throat structures of rocks without destroying the material as it can provide reliable PSD information [13]. Furthermore, NMR experiments were performed on core plugs in the laboratory to provide guidance for the construction of petrophysical models, showing that the application of NMR for pore structure characterization is useful [14].
Microscopic images can be very useful for examining the pore structure of a grouting material [15]. The field of view in SEM is very small, thus the overall appearance cannot be visually observed, and the definition of a pore in the image is ambiguous. Polarization microscopy (PM) is often used to observe the mineral phase [16], and others have used this technique to examine the pore structure in grouting materials. Using PM to observe a dark area of the grouting material allows examination of the pore structure inside the material, and a wide range of pore structure information can be obtained.
Fractal theory has been considered as an effective method to characterize the complex pore structure in porous materials [17,18]. However, there are only a few studies related to the fractal characteristics of pore interconnectivity in grouting materials using NMR experiments. Random walk pore spectral dimension (RWPSD) is a branch of fractal theory that can be used to quantify complex pore interconnectivity using a pore spectral dimension ds [19,20]. A series of problems remain unsolved, such as the relationship between pore spectral dimension and curing time in different grouting materials, and the influence of cement, accelerators, or tailings on pore interconnectivity. Therefore, determining the pore spectral dimension in PM images can provide a new understanding of the pore network in grouting materials.
In this work, we investigated the microstructure (in terms of pore structure and interconnectivity) and its relationship with mechanical properties (with respect to uniaxial compressive strength (UCS) and setting time) in three types of grouting materials. Firstly, mineral compositions and physical properties were analyzed. Then, the ratio of materials including cement, tailings, and water was determined, and samples were prepared and cured. The relationship among composition, setting time, and UCS was also investigated. NMR and thin- section analyses with PM were used to obtain pore structure characteristics and porosity information on the three types of grouting materials during curing time (in terms of pore structure characteristics and porosity). A macroscopic characteristic of pore interconnectivity within the three grouting materials was quantified using the binary image PM technique and RWPSD algorithm. PSD and porosity in the three types of grouting materials obtained from NMR and image analysis of the thin-section were compared and discussed. UCS (with respect to strength failure mechanism), PSD and setting time (with respect to effects of accelerator) were investigated and the relationship among them was discussed.
2 Experimental
2.1 Sample preparation
Portland cement was provided by the Changsha Pingtang Cement Co., Ltd., China. Industrial water-glass with 40 Be′ Baume degree and 2-2.4 modulus was prepared as an accelerator. In addition, potable municipal water was used to prepare the mixtures.
The tailings appearance used in this study (Fig. 1(a)) were collected from the Dongan Xinlong Mine Tailings Reservoir located in Yongzhou City, Hunan Province, China. Figure 1(b) presents the cumulative grain size distribution curve determined using a Malvern Mastersizer S2000 laser particle size analyzer. From this figure, 80% of tailings are coarse grains (d >75 μm). The chemical composition of the tailings was analyzed using inductively coupled plasma atomic emission spectroscopy (ICP-AES, Optima 3000 DV, Perkin-Elmer) and shown in Table 1. The specific gravity Gs of the tailings was determined to be 2.72 using a helium pycnometer (AccuPyc 1330 from Micrometrics) in accordance with the ASTM C128 standard.

Fig. 1 Tailing appearance (a) and cumulative grain size distribution (b) for Dongan Xinlong Mine (DXM) tailings
Low-field NMR imaging and thin-section analysis were performed on three different sample groups.
(1) Principal paste: Water-solid (w/s) mass ratio of 2 and with a Portland cement content of 100 wt.% (named C100).
(2) Principal paste: Water-solid (w/s) mass ratio of 0.5 and with a Portland cement content of 100 wt.%. The volume ratio of principal paste to water-glass paste was 0.5 (named C100WG).
(3) Principal paste: Water-solid (w/s) mass ratio of 0.5 and with a mixture of 50 wt.% Portland cement and 50 wt.% tailings. The volume ratio of principal paste to water-glass paste was 0.5 (named C50WG).
Table 1 Chemical compositions of Dongan Xinlong Mine tailings (wt.%)

The preparation of C50WG, C100, and C100WG specimens are as follows.
The principal paste was thoroughly stirred, and the principal paste and water-glass paste were injected into the mixer. The mixed paste was poured into cylindrical plastic molds (50.8 mm in diameter and 101.6 mm in height), sealed, and left in a humidity chamber for prescribed curing time (3, 7, 14, and 28 d). The samples were examined using PM and low-field NMR at 23 °C and relative humidity of 90%.
2.2 Experiment process
Figure 2 shows the experiment process, including sample preparation, nuclear magnetic resonance (NMR) experiment, USC test, and polarization microscopy (PM) examination. The setting time of C100, C100WG, and C50WG pastes was investigated.
Three cylindrical samples for each mixture were used to measure UCS after curing time of 3, 7, 14 and 28 d (i.e., five tests for each recipe), according to ASTM D2166M-16. UCS tests were conducted and the setting time was measured under the same experimental conditions and mixture ratio.
Low-field NMR measurements were performed using an AniMR-150 NMR analysis meter. After curing for 3, 7, 14 and 28 d, respectively, four sets of NMR measurements were gathered under 100% water saturated conditions. In this study, the T2 (total NMR relaxation time) distribution curves and parameters such as NMR porosity were determined under water saturated conditions.
Due to the poor strength of the specimens, it was necessary to use plastics before conducting a thin-section analysis. Epoxy resin and triethanolamine (mass ratio of 9:1) were heated on an electric furnace until the mixture began boiling, and the sample was subsequently placed in the mixture and boiled for 3-5 min.
The sample was ground and polished after boiling. Potassium dichromate and chromium oxide (mass ratio of 3:7) with a factor 40 water dilution were used as the polishing agent. A microscope (DM-4500P, Leica) was used to examine and analyze the samples.
2.3 NMR theory
NMR is used to study the interaction between atomic nuclei and a magnetic field. The total NMR relaxation time (T2) is associated with surface relaxation, bulk relaxation of fluid precession, and diffusion relaxation caused by the field gradient. Diffusion relaxation can be ignored when the applied electro- magnetic field is uniform.
Therefore, the relationship between pore size and T2 (ms) can be established using a simple equation:
 (1)
(1)
where ρ is the surface relaxivity strength (μm/ms) and S/V is the surface area to volume ratio (specific surface area) of the pores (μm-1).
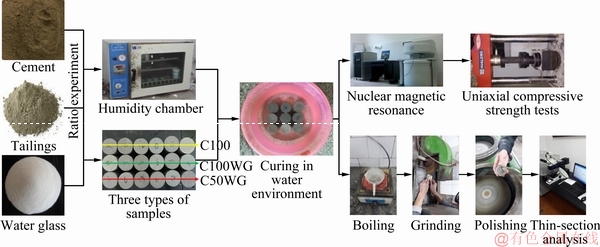
Fig. 2 Experimental process showing sample preparation, NMR experiment, USC test and PM examination
The pore radius is proportional to the pore throat radius, thus Eq. (1) can be transformed into the following equation:
 (2)
(2)
where r is the pore radius (μm), Fs is a geometrical factor (Fs=3 for spherical pores and Fs=2 for columnar pores).
Since smaller pores have small radii, Eq. (2) shows that hydrogen in a smaller pore relaxes faster than in a larger pore [21]. Consequently, the T2 distribution in core samples reflects the PSD. In other words, the T2 distribution can be transformed into the PSD, where the smallest pores have the shortest relaxation time, and vice versa.
2.4 Random walk pore spectral dimension (RWPSD) algorithm
A binary image obtained from PM can be used to clearly observe the pore structure in samples. The water infiltration process in porous media can be regarded as a random walk of water in pores. Particles in a binary image walk randomly in pores to simulate the water infiltration process in the samples. The pore spectral dimension can be determined from the random walk algorithm results and subsequently used to evaluate the pore structure interconnectivity in the samples.
Figure 3 shows a simplified particle random walk model. In order to ensure the walk process close to actual physical transportation, this study made a few reasonable assumptions. Two walk rules were described as follows:
(1) In order to ensure randomness of walking, 5000 particles used to be start points were randomly generated in pores during a random walk. The end points were randomized to be 49 within pores (Fig. 3). The particles walking from start points to end points were recorded as a valid walk within the prescriptive number of steps (10000).
(2) The particles only walked in pores, and the walking direction was randomly selected. In Fig. 3(b), it can be seen that Px+, Px-, Py+ and Py- are the probabilities of walking in four adjacent directions and Px+=Px-=Py+= Py-=0.25. After the particles collided with the matrix, they returned along their original path but in the opposite direction. Particles only walked one node (pixel) at a time. A duplicate node (Fig. 3(c)) in the path was marked as an invalid step. Regardless of the number of steps to the node, only one node was counted, but the number of steps counts.
The relationship between the number of different nodes P (area) that can be accessed and the number of walk steps (n) for 5000 particles in the binary image was as follows:
 (3)
(3)
where ds is the pore spectral dimension.
The definition of the pore spectral dimension objectively reflects the characteristics of pore shape and interconnectivity, and it establishes a bridge between pore structure, water permeation, and migration. It has been acknowledged that the pore spectral dimension in the pore structure can be used to quantitatively describe the complexity of the pore structure and correlates with the permeability of porous materials [22].

Fig. 3 Simplified particle random walk model in pore (a), particle walking direction and probability (b), random walk process (c) and ending point schematic diagram in 7 × 7 matrix (d)
3 Results
3.1 Pore structure distributions obtained from NMR
Three or four peaks were observed in the NMR T2 spectrum from the cement paste sample, where one or two peaks were larger than the remaining peaks (Fig. 4).
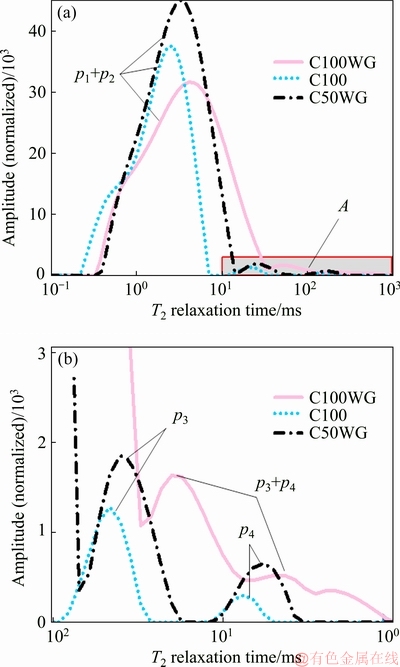
Fig. 4 T2 relaxation time for three types of samples cured for 1 d (a) and enlarged view of area A in (a) (b)
MEHTA and MONTEIRO [23] classified water in hardened cement paste (Fig. 5) as chemically combined water (water that is an integral part of the microstructure of various cement hydration products), interlayer water (water associated with C―S―H structure), adsorbed water (water molecules physically adsorbed onto the solid surface under the influence of attractive forces), capillary water (water present in voids), and free water (water that exists in larger pores or cracks). JEHENG [24] measured the apparent transverse relaxation time of chemically combined water in the backfill to be 12 μs. Reports in literatures [24,25] also mentioned that the value of T2 for chemically combined water is very short, and the CMPG experiment cannot be used to collect a signal from chemically combined water in the sample. Therefore, four peaks in the T2 spectrum correspond to NMR signals of interlayer water, adsorbed water, capillary water, and free water. One can see from Eq. (2) that T2 is proportional to the pore radius. The radius of the pores containing interlayer water, adsorbed water, capillary water, and free water gradually increases. Thus, peaks p1, p2, p3, and p4 in Fig. 4 represent interlayer water, adsorbed water, capillary water, and free water, respectively. Peaks p3 and p4 are obvious in Fig. 4, while peaks p1 and p2 may cross or overlap.
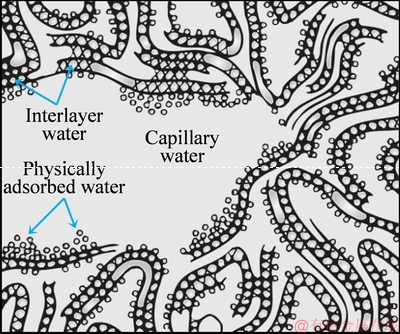
Fig. 5 Schematic diagram of cement material microstructure including interlayer water, physically adsorbed water, and capillary water [23]
The T2 relaxation time spectrum has four typical peaks p1, p2, p3 and p4. The ratio of the areas occupied by peaks p1 and p2 in the T2 spectrum of all samples reached more than 90%, which were the main peaks in the NMR T2 spectrum. This is the main source of relaxation signals. In particular, p2 showed the strongest signal intensity and the largest spectral area. The p2 spectral area in all samples covers p1 to a certain extent, especially in sample C50WG, where the p1 signal is almost completely contained in the p2 signal. Consequently, interlayer water and adsorbed water are the primary signal sources for transverse relaxation and showed the largest proportion for the four water types in all samples.
Peaks p1 and p2 overlapped with each other in all experimental results, which indicated that there were overlaps and crossovers between interlayer water and adsorbed water in the geometric size distribution. Regarding interlayer water (Fig. 5), it has been suggested that a monomolecular water layer between C―S―H layers is strongly anchored by hydrogen bonding. Adsorbed water (Fig. 5) is water that is close to the solid surface. Water molecules were physically adsorbed onto the surface of solids in the hydrated cement paste under the influence of attractive forces. It has been suggested that up to six molecular layers of water can be physically anchored by hydrogen bonding.
Nevertheless, there are not always six molecular layers of water that are physically adsorbed onto the surface of solids. Some perturbation may cause water layers to break away, leaving less than six remaining water layers. There may be only one molecular layer of water. The geometric dimensions between the adsorbed water and the interlayer water appear to be similar, and the definition between different states of water is not rigid at this time. Consequently, overlaps and crossovers between peaks p1 and p2 are present in the NMR T2 spectrum.
The transverse relaxation signal results showed that water existed in the hydrated paste in other two states, which produced a strong relaxation signal in addition to a large amount of water alongside interlayer water and adsorbed water. From the foregoing discussion of water in cement paste, the remaining water was capillary water (p3) and free water (p4) within voids in the hydrated paste. Free water has the longest T2 relaxation time and the most unstable water content. In some tests, no signal is generated, thus there are only three peak signals. In the T2 spectrum of the C100WG sample, the p3 and p4 peaks also combined as a new peak (p3+p4). Peak p3 appeared to left shift, which indicated that the pores in the C50WG sample were larger. This indicates that the pores and fractures have similar geometric dimensions, as represented by intersection of peaks p3 and p4.
In addition to the peak areas, the relaxation time corresponding to the spectrum peak was another important characteristic parameter. The observed peaks are basically symmetric, and the peak maximum is located in the middle of spectrum peak. Accordingly, the relaxation time at the peak position can indicate changes in the pore size.
The NMR T2 spectra for the three paste samples are shown in Fig. 6. There are some similarities among the T2 peak values, peak positions, and peaks shapes for different curing time. It can be concluded by comparing the sample analysis results that the C100WG peak positions (p1+p2, p3 and p4) are at the far right, the C50WG peaks are in the middle, and the C100 peaks are at the far left. The C100WG samples exhibit a higher T2 value, indicating more interlayer water, adsorbed water, capillary water, and free water voids. This reveals that the average pore size in the C100WG sample is larger.
The lowest p3 and p4 values of the C100 sample indicate that capillary water and free water contents are the lowest, thus macropores did not develop and the fracture did not occur. Peak p1 for the C50WG sample is the highest and most similar to that for C100, indicating that interlayer water is present in high proportion, and the distributions of micropores and mesopores are dense. The overlap between peaks p3 and p4 in the C100WG sample indicates that there are cross-scale interconnected channels between the sample pores, which increases permeability to a certain degree.

Fig. 6 T2 relaxation time spectra for three types of samples and local magnification of peaks p3 and p4 at curing time of 7 d (a) and 28 d (b)
3.2 Pore structure description through thin-sections analysis
As previously mentioned, different gray values between pores and mineral phases allow for the separation of porosity from the solid grains by image analysis (IA) in terms of image capture and treatment. It is well known [26] that identifying the IA threshold (i.e., the critical grey level for binary segmentation) is critical in microstructural analysis of cemented materials. This important step is at the base of subsequent processing stages. This is particular case in this investigation, as binary images are used for more than one purpose (i.e., porosity evaluation, PSD and pore interconnectivity) [27]. The C100WG and C50WG samples have a high porosity, often above 40%. Under this condition, it is relatively straightforward to evaluate a threshold value related to porosity in a histogram of grey levels.
Figure 7 shows binary images from two topical samples (C100, 3 d and C100, 7 d). There are two grey level distribution models, bimodal and unimodal in Figs. 7(a) and (b). The x-axis represents the grey level (0-255), and the y-axis represents the number of pixels.
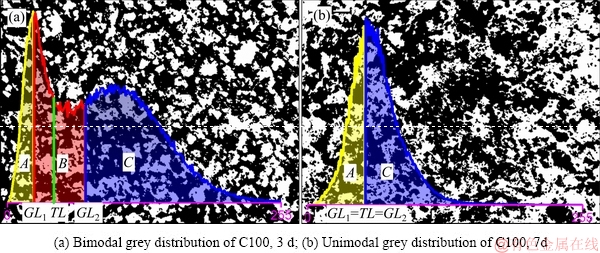
Fig. 7 Binary images obtained from PM image
The A, B and C represent pore zone, transition zone, and solid zone, respectively. GL1 is the grey level at the beginning of zone A, and GL2 is the grey level at the beginning of zone C. The threshold level value (TL) is equal to (GL1+GL2)/2. In Fig. 7(a), the typical grey level curve is bimodal, with zone A related exclusively to the solid phase. Zones A and B partially are related to voids and to solids, respectively. Zone B is seen as a transition zone showing the epoxy containing less or more interlaced solids. Other authors have observed such transition zones in cement pastes [27]. Another type of grey level curve is shown in Fig. 7(b), which is unimodal. In this case, the threshold level (TL) is equal to GL1 and GL2 (defined below), which means that there is no transition zone B in the sample, and only pore zone A and solid zone C are presented.
Implementation of an unambiguous, objective, and repeatable procedure to evaluate the threshold value is a key aspect in order to recognize and compare the evolution of the pore structure parameters over time for different sample types. In the present study, the threshold was determined as the average between the darker grey values occupying the highest proportion of the image (GL1 value in Fig. 7) and the lowest value of the valley which is between the two main family peaks (GL2 value).
Clear thin-section images of the grouting samples were obtained using PM. Images for different curing time (3, 7, 14 and 28 d) are shown in Fig. 8. Thin-section analysis of porous materials is primarily based on distinguishing grey levels in PM images with image processing software. In the PM images, the grey level is directly proportional to the backscatter coefficient, which is related to the atomic number of the chemical elements. The mineral phases presenting the highest average atomic numbers are the brightest in the image with 256 grey levels. Because the epoxy resin used as a pore filling and stabilizing material mostly contains carbon (Z=6), the backscatter coefficient of the pores is low and the pixels representing the voids in the PM images are dark. Thus, various pores and fracture structures can be clearly observed.
A, B, C, D and E in Fig. 8 indicate pores, pore throats, hydration products, air holes and cracks and tailing particles. The three types of samples formed a grid-like structure on the sample slice surface. The hydration reaction did not occur instantaneously in the paste. Firstly, particulate matter aggregates in the paste to form particles with a certain size distribution. As the hydration reaction progresses, the hydration products nucleates and particles grow on the surface, which promotes the formation of a porous structure resembling a neuron.
The C100 structure was the most compact (Fig. 8, C100). The C100WG hydrated product particles were connected to each other up to a size of 100 μm (Fig. 8(b), C100WG, 3 d), which constituted the coarser network structure and porous structure of the quick-setting paste. When the curing time reached 28 d, the C100WG compactness did not improve significantly (Fig. 8(k), C100WG, 28 d). Gaps in the structure were not significantly supplemented, nor were they strengthened by the hydration reaction process.
The structure of the C50WG sample is similar to the C100 and C100WG samples. The grid structure sizes in the C50WG sample is between the other two samples. Some of the tailings particles were completely encapsulated in hydration products and were distributed on the connection structure between the hydration products (Fig. 8(c), C50WG, 3 d), and the hydration products crystallized on the surface of the tailings particles. As the hydration reaction proceeded, many similarly rounded tailings particles were filled in the network structure of the C50WG sample (Fig. 8(l), C50WG, 28 d), which indicates that the tailings can fill gaps in a portion of the hydration product structure. This shows that tailings not only provide conditions for early hydration reactions, but they also improve the late hardening paste compactness.
There are a large number of pores in the skeletal grid of the hardening pastes, where the largest pore size reaches about 100 μm, while the smaller pore sizes are dozens of microns or even several microns. This occurs due to the hydration reaction. There are also some circular air holes with diameters of several hundred microns, which are the air bubbles resulting from the trapped air during the stirring process. In addition, there are crack structures in the C100WG and C50WG samples with unequal lengths and widths within dozens of microns. The air holes and cracks are large in size, and water can flow freely and damage the structure of these materials.
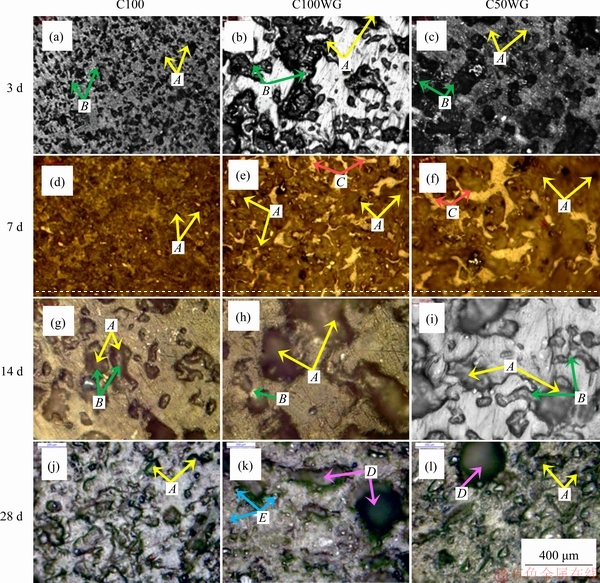
Fig. 8 Polarizing microscope images of samples
3.3 Setting time and UCS
The initial setting time, final setting time, and UCS are shown in Fig. 9. The initial time and final setting time of the pastes obviously increase with the presence of tailings. The initial and final setting time for C50 reached 7.43 and 29.58 min, respectively (Fig. 9(a)). For C50 and C50WG, i.e., in the pastes with tailings, the double-paste (main principal paste and water-glass paste) exhibits significantly reduced setting time. The double- paste has a slight effect on setting time in the C100 and C100WG pastes without tailings. The effect of the water-solid ratio of the pastes on the setting time is well known. In the C100WG sample, the water-glass paste can accelerate condensation, while it dilutes the pastes and retards time required for active particles in the cement to aggregate as solid structure. In the pastes with inert particles like tailings, the double-paste accelerates condensation more effectively, whereas the dilution effect is not obvious. Thus, the double-paste has a significant effect on the C50WG samples.
As shown in Fig. 9(b), the early strength increased significantly with the accelerator in the C100WG samples, but the development of later strength was reduced. The strength increased by only 0.06 MPa over the 7 d to 28 d curing time. However, the strength of the C50WG samples with tailings grew steadily during the curing period. The strength of the C100 sample was larger than that of the other two samples, and the strength increased steadily and rapidly with curing time.
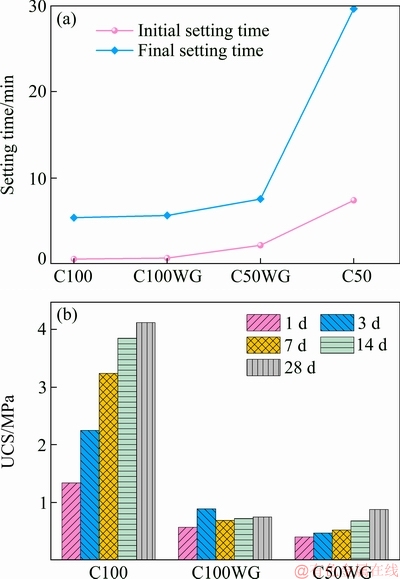
Fig. 9 Initial and final setting time (C50 samples are C50WG pastes without water-glass paste) (a) and UCS (b) for different samples

Fig. 10 Destruction patterns for uniaxial compressive tests in C100WG (a) and C50WG (b) samples
In the UCS tests, there are two primary failure modes that occur in grouting materials. One is the overall splitting and failure of the specimen (Fig. 10(a)), the other is the local failure at both ends (Fig. 10(b)). According to the quick setting mechanism, one can infer that the effect of the accelerator is to transition from a local quick set process to the overall set process during quick setting. It also changes the chemical composition, and the preferential cement will consume calcium in the cement slurry. Therefore, the strength of the C100WG sample reached its maximum after curing for 7 d, and the strength dropped from 7 to 14 d. The C100WG and C50WG samples formed an uneven material distribution internally. It shows a local failure mode when the weak belt is distributed at both ends (Fig. 10).
Observed from the fracture surface, although the section is smooth, there are many pores of different sizes in the cemented body (Figs. 10(a) and (b)). Deterioration of internal pore distribution is an important reason for the decreased UCS. The reason for its formation may be the air enclosed inside the test piece during casting. It may also be due to the natural development of gelation caused by the added accelerator.
The accelerator causes the bubbles in the pastes to be discharged when the test piece is poured, resulting in a non-uniform pore distribution and poor strength. However, the original quick-setting effect is slowed, the setting time is increased, the internal bubbles are discharged, and the internal pore distribution is improved due to the addition of tailings (Figs. 8 and 9). On the other hand, the accelerator will change the entire cementation process and hydration products, which will also have a certain impact on PSD. In summary, the accelerator would modify the hydration process and products, generate non-uniform pore structure, and increase porosity and interconnectivity of pores, resulting in reduced setting time and reduced strength during the later curing stage.
4 Discussion
4.1 Porosity
Figure 11 shows binary images from all samples and the corresponding grey level curves presented in Fig. 8. The IA porosity obtained from binary IA and NMR porosity are shown in Fig. 12.
In the study of porous media such as rocks, the volume of water in porous media is often regarded as the effective porosity according to Eq. (1). The NMR porosity of C100WG sample is largest, and the C100 sample NMR porosity is the smallest. The NMR porosity results are consistent with pore size and number obtained from the NMR T2 spectra. The NMR porosity results for all three samples have negative correlations with curing time, as shown in Fig. 12. The NMR porosities of the C100, C50WG, and C100WG samples decreased from 33.7% to 24.9%, 49.0% to 42.5%, and 51.1% to 45.0%, respectively. The decreased amplitudes indicate that the former voids occupied by evaporable water are gradually occupied by CH crystals, AFt crystals, and other substances produced by cement hydration. As a result, the total volume of all pores is reduced, and macropores gradually transform into micropores. At the same time, evaporable water is transferred to chemically combined water that exceeds the NMR detection range for the instrument used in this study.
The decreased proportion of evaporable water reveals the later hydration activity of the paste. The C100 pastes exhibited the highest reaction activity during the experimental observation period. However, the late-phase reaction activity of the paste samples must take into account conversion of evaporable water into chemically combined water and the physical conversion capacity among evaporable water states (interlayer water, adsorbed water, capillary water, and free water).
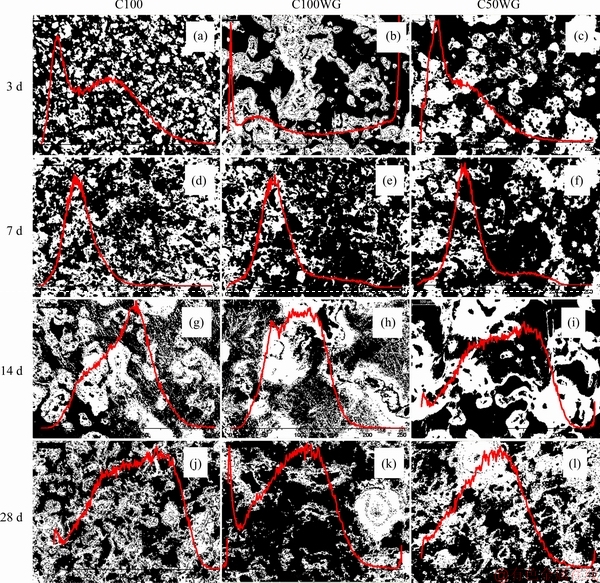
Fig. 11 Binary images and tonal curves for images shown in Fig. 8
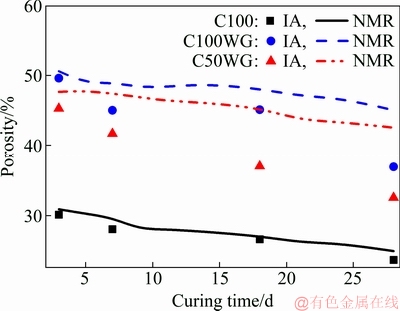
Fig. 12 Relationship between curing time and porosity (IA is the porosity calculated through image analysis, and NMR is the porosity obtained from NMR tests)
IA porosity has a negative correlation with curing time, which corresponds to the variation in NMR porosity. Nevertheless, the IA porosities obtained from IA are less than the NMR porosities for the same curing time. This occurs because distinguishability in PM is limited, and only the major pores with a certain size can be observed and distinguished. However, NMR can measure full-scale pores, including interlayer pores, gel pores, capillary pores, and fracture.
Previous studies [28-30] found that the porosity for backfilling materials was less than 10%, in contrast with the results presented in this study. This is probably due to different curing environments after the samples were removed from the humidity chamber. A water environment increases water content in the samples and destroys the pore structure, thus changing the hydration reaction. This is detrimental for grouting materials to have a large porosity. In this condition, grouting materials will not play a role in plugging water. Fortunately, the inner pores are closed and do not interconnect with each other or external water environment. The pore spectral dimension and pore interconnectivity are used to verify our conclusion and quantify the pore interconnectivity in the next section.
4.2 Pore spectral dimension and pore inter-connectivity
The pore shapes and interconnectivity in the hardened pastes can be objectively determined from the pore spectral dimension (ds). The differential nodes P (area) corresponding to the same number of walk steps (n) would be averaged. After calculating the logarithm of the number of walk steps and differential nodes P, a series of plots are used to show the relationship between the number of walk steps and different nodes in all samples, as shown in Fig. 13.
Equation (3) is used to fit a series of plots in Fig. 13 to obtain the pore spectral dimension (ds) with correlation coefficients greater than 0.697, which verifies that the pore channel in porous media has fractal features.
In Fig. 13, R2 is correlation coefficient; k is equation slope. Previous studies have found that the pore spectral dimension in a porous structure is negatively correlated to the complexity of pore distribution structure and is positively correlated with pore interconnectivity. The pore spectral dimension value in the three kinds of samples follows the order C100WG > C50WG > C100 for the same curing time. These quantitative results show that additional accelerators improve pore interconnectivity and mitigate complexity, which increases the rate of water penetration. The pore spectral dimension values for a given sample are positively correlated with curing time, indicating that pore interconnectivity increases and complexity decreases, while sample porosity also decreases (Figs. 12 and 13) as the hydration reaction proceeds. There seems to be some contradictions. In fact, the hydration reaction will increase the content of small and mesopores, and reduce the number of macropores, which will increase the interconnectivity. Nevertheless, the pore spectral dimension and interconnectivity do not have obvious correlation with setting time.
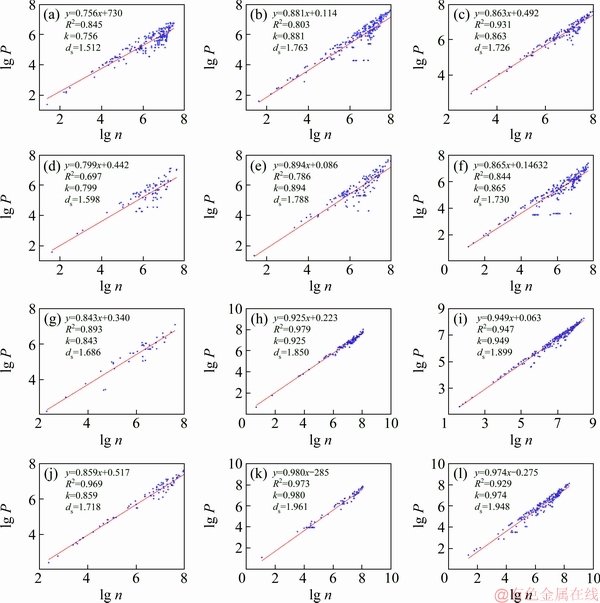
Fig. 13 RWPSD at curing time of 3 d (a, b, c), 7 d (d, e, f), 14 (g, h, i) and 28 d (j, k, l) for samples C100 (a, d, g, j), C100WG (b, e, h, k) and C50WG (c, f, i, l)
As can be seen from Fig. 14, pore interconnectivity and NMR porosity are negatively correlated for a given sample, i.e., a larger pore porosity results in smaller pore interconnectivity. However, the relationship among the NMR porosity and pore interconnectivity of C100, C100WG, and C50WG exhibits the opposite rule, i.e., large NMR porosity corresponds to macropore interconnectivity.

Fig. 14 Relationship between NMR porosity and pore interconnectivity
By combining with the pore structure analysis (Fig. 8), it can be deduced that the hydration reaction products gradually filled the macropores, which generated small pores and increased pore inter- connectivity. The samples produced different pore structures due to the addition of accelerators, resulting in a large number of micropores and high porosity. At this point, a large porosity value became a major factor affecting pore interconnectivity.
When calculating pore connectivity, a starting point is set at the left boundary and an ending point is set at the right boundary. After conducting 10 tests with 1000 particles per test at the starting point, we found that none of the particles reached the ending point. This result indicates that pore interconnectivity is very poor in these materials, and water molecules cannot easily migrate through the pore structure, even for materials with high porosity.
4.3 Comparison of pore structure distribution (PSD) characteristics by NMR and IA
The T2 signal from the NMR data is generated by resonance of H atoms in bound and free water. In other words, the T2 signal can be regarded as the signal from water in the backfill. The pores within backfill are space that is not filled with solid phase. Electron microscope images show that voids in the hydrated cement paste appear to be empty. Within the water-saturated backfill body, many forms of water existed in the backfill corresponding to pores with different sizes. Some reports in literatures [23,31,32] suggested that the hydrated cement paste contains several types of voids which have an important influence on its properties. Interlayer pores form in the C―S―H structure, which is considered to be part of the solids in the hydrated cement paste. The width of interlayer pores varies from 0.5 to 2.5 nm. Gel pores form during polymerization of aluminosilicate gel, which are defined to range from 0.005 to 0.01 μm based on the results from the PC concrete research. Capillary pores contain the space not filled by solid components of the hydrated cement paste, which are defined to range from 0.01 to 5 μm. Air holes contain a small amount of air trapped in the cement paste during concrete mixing, the shape of which is generally spherical.
It can be seen from our contextual declaration that the four spectral peaks represent interlayer water, adsorbed water, capillary water, and free water. A given T2 distribution corresponds to a given PSD, where each relaxation time corresponds to a pore size. A larger pore corresponds to a longer relaxation time, and vice versa for smaller pores. According to Ref. [21] and Eq. (2), the relationship between relaxation time and pore radius can be obtained. The radius derived from the relaxation time in this study generally matches the range described above for four types of pores. Therefore, the four spectral peaks correspond to interlayer pores, gel pores, capillary pores, and fractures. The peak area and peak position of the T2 relaxation time distribution (Figs. 4 and 6) statistics of p1+p2, p3, and p4 are shown in Fig. 15.
After curing for 3 d, the T2 time of every peak position among C100, C50WG, and C100WG samples increased, which revealed that the pore size can be ordered as C100WG > C50WG > C100.
It can be seen from Fig. 15 that after curing for 28 d, denser structures in the three samples continued to develop. These structures were different among the three samples, and each formed its unique pore structure (Fig. 8).
The primary pore evolution characteristics are as follows: (1) pores became smaller and denser over time in all three samples. Difference in the pore sizes among the three samples increased as curing age increased. The C100 sample exhibited the fastest transformation rate of macropores and mesopores into micropores, followed by C50WG and C100WG. (2) Interlayer pore and gel pore content continuously increased, and capillary pore contents decreased, as indicated by changes in the peak area during the curing process.
There are some differences in coagulation evolution mechanism among the three samples due to composition differences. This is an important process for improving the pore structure in a grouting material, requiring a conversion from capillary water to interlayer water and adsorbed water. The NMR results show that capillary water slowly and continuously converted into interlayer water and adsorbed water in the C100 samples. Meanwhile, the ratio of interlayer pores to gel pores in the C100WG sample was basically the same. We speculate that the incorporation of a quick-setting coagulant inhibits the original hydration process and blocks the transformation of capillary water into interlayer water and adsorbed water. This reveals that the C100WG sample basically completed its entire hydration reaction during the early stage, after which the hydration reaction was very weak.

Fig. 15 Peak area proportion and peak position for C100 (a), C100WG (b) and C50WG (c) (The values shown in the histograms are the peak positions corresponding to the T2 relaxation time)
The interlayer water and adsorbed water contents in the C50WG sample show an increasing trend with the increase of curing time. The transition from capillary water to interlayer water and adsorbed water is evident. Although the incorporation of tailings in pastes would retard the setting time and inhibit early activity to a certain extent, the active components in tailings play an important role in the later hydration reaction stage.
Grouting materials eventually formed porous media with different sizes as a main matrix. In terms of pore size, the samples can be ordered as C100WG > C50WG > C100.
5 Conclusions
(1) The experimental results showed that the microstructure of the grouting materials used in this study consisted of interlayer pores, gel pores, capillary pores, circular air holes, and fractures. The T2 spectra obtained from NMR analysis reflected four pore size distributions. However, the spatial size of the interlayer pores and gel pores was similar and only showed three distinct signal peaks. Capillary water could be converted to adsorbed water and interlayer water as curing time increased during sample preparation, and the ratio of gel pores to interlayer pores increased accordingly.
(2) Pore interconnectivity and curing time exhibited a positive correlation. For a given curing time, pore interconnectivity can be ordered as C100WG > C50WG > C100. Pore interconnectivity and NMR porosity are negatively correlated for a given sample. However, the relationship among C100, C100WG,and C50WG showed the opposite rule, namely that large NMR porosity corresponded to macropores interconnectivity.
(3) An accelerator would change the hydration process and products, generate a non-uniform pore structure, and increase porosity and pore interconnectivity, resulting reduced setting time and poor later strength.
(4) Tailings could fill gaps in a portion of the hydration product structure and densify the hydration products, thus overcoming any defects in a quick-setting slurry and reducing strength loss. This demonstrates that it is completely feasible to add tailings to the quick-setting slurry. Meanwhile, the grouting materials with added tailings allow tailings to be reused.
References
[1] WU Ai-xiang, LIU Chao, YIN Sheng-hua, XUE Zhen-lin, CHEN Xun. Pore structure and liquid flow velocity distribution in water-saturated porous media probed by MRI [J]. Transactions of Nonferrous Metals Society of China, 2016, 26(5): 1403-1409.
[2] LI Gong-yu, ZHOU Wan-fang. Impact of karst water on coal mining in North China [J]. Environmental Geology, 2006, 49(3): 449-457.
[3] SAKHAEE-POUR A, BRYANT S L. Effect of pore structure on the producibility of tight-gas sandstones [J]. AAPG Bulletin, 2014, 98(4): 663-694.
[4] FOURMENTIN M, FAURE P, RODTS S, PETER U, LESUEUR D, DAVILLER D, COUSSOT P. NMR observation of water transfer between a cement paste and a porous medium [J]. Cement and Concrete Research, 2017, 95: 56-64.
[5] ZUNINO F, BENTZ D P, CASTRO J. Reducing setting time of blended cement paste containing high-SO3 fly ash (HSFA) using chemical/physical accelerators and by fly ash pre-washing [J]. Cement and Concrete Composition, 2018, 90: 14-26.
[6] MALTESE C, PISTOLESI C, BRAVO A, CELLA F, CERULLI T, SALVIONI D. A case history: Effect of moisture on the setting behaviour of a Portland cement reacting with an alkali-free accelerator [J]. Cement and Concrete Research, 2007, 37(6): 856-865.
[7] HIGGS K E, ZWINGMANN H, REYES A G, FUNNELL R H. Diagenesis, porosity evolution, and petroleum emplacement in tight gas reservoirs, Taranaki Basin, New Zealand [J]. Journal of Sedimentary Research, 2007, 77(12): 1003-1025.
[8] WANG Xiao-hua, LI Jin-shan, HU Rui, KOU Hong-chao. Mechanical properties and pore structure deformation behaviour of biomedical porous titanium [J]. Transactions of Nonferrous Metals Society of China, 2014, 24(3): 833-838.
[9] YANG Bao-hua, WU Ai-xiang, MIAO Xiu-xiu, LIU Jin-zhi. 3D characterization and analysis of pore structure of packed ore particle beds based on computed tomography images [J]. Transactions of Nonferrous Metals Society of China, 2015, 25(5): 1543-1550.
[10] SHANG Jun-long, HU Jian-hua, ZHOU Ke-ping, LUO Xian-wei, ALIYU M. Porosity increment and strength degradation of low-porosity sedimentary rocks under different loading conditions [J]. International Journal of Rock Mechanics and Mining Sciences, 2015, 75: 216-223.
[11] SUN Xiao, ZHANG Bin, DAI Qing-li, YU Xiong. Investigation of internal curing effects on microstructure and permeability of interface transition zones in cement mortar with SEM imaging, transport simulation and hydration modeling techniques [J]. Construction and Building Materials, 2015, 76: 366-379.
[12] FAVVAS E P, SAPALIDIS A A, STEFANOPOULOS K L, ROMANOS G E, KANELLOPOULOS N K, KARGIOT IS E K, MITROPOULOS A C. Characterization of carbonate rocks by combination of scattering, porosimetry and permeability techniques [J]. Microporous and Mesoporous Materials, 2009, 120(1): 109-114.
[13] HU Jian-hua, REN Qi-fan, JIANG Quan, GAO Ru-gao, ZHANG Long, LUO Zhou-quan. Strength characteristics and the reaction mechanism of stone powder cement tailings backfill [J]. Advances in Materials Science and Engineering, 2018, 2018: 1-14.
[14] YAO Yan-Bin, LIU Da-Meng. Comparison of low-field NMR and mercury intrusion porosimetry in characterizing pore size distributions of coals [J]. Fuel, 2012, 95: 152-158.
[15] YANG Bao-hua, WU Ai-xiang, WANG Chun-lai, NIU Wen-xin, LIU Jin-zhi. Three-dimensional simulation of pore scale fluid flow in granular ore media with realistic geometry [J]. Transactions of Nonferrous Metals Society of China, 2012, 22(12): 3081-3086.
[16] MIZUSAWA K. Polarizing microscope observations of pottery from the Yashiro sites, Nagano Prefecture, Central Japan [J]. Quaternary International, 2016, 397: 495-503.
[17] ZHOU San-dong, LIU Da-meng, CAI Yi-dong, YAO Yan-bin. Fractal characterization of pore-fracture in low-rank coals using a low-field NMR relaxation method [J]. Fuel, 2016, 181: 218-226.
[18] YAO Yan-bin, LIU Da-meng, CHE Yao, TANG Da-zhen, TANG Shu-heng, HUANG Wen-hui. Petrophysical characterrization of coals by low-field nuclear magnetic resonance (NMR) [J]. Fuel, 2010, 89: 1371-1380.
[19] XU You-wei. Application of directional random walk algorithm based on fractal method in the research of heat transfer in porous media [D]. Yangzhou: Yangzhou University, 2014. (in Chinese)
[20] CHEN Yong-ping, SHI Ming-heng. Determination of permeability for porous media using fractal theory [J]. Journal of Tsinghua University, 2000, 40(12): 94-97.
[21] LI Jie-lin, LIU Han-wen, AI Kai-ming, ZHU Long-yin. An NMR-based experimental study on the pore structure of the hydration process of mine filling slurry [J]. Advances in Civil Engineering, 2018, 2018: 1-12.
[22] JI Yan-liang, SUN Zhen-ping, JIANG Xiao-xing, LIU Yi, SHUI Liang-liang, CHEN Chao. Fractal characterization on pore structure and analysis of fluidity and bleeding of fresh cement paste based on 1 H low-field NMR [J]. Construction and Building Materials, 2017, 140: 445-453.
[23] MEHTA P K, MONTEIRO P J M. Concrete: microstructure, properties, and materials [M]. 2nd ed. New York: McGraw-Hill, 1993.
[24] JEHNG J. Microstructure of wet cement pastes: A nuclear magnetic resonance study [D]. Evanston: Northwestern University, USA, 1995.
[25] DAVY C A, ADLER P M. Three-scale analysis of the permeability of a natural shale [J]. Physical Review, 2017, 96: 1-12.
[26] OUELLET S, BUSSIERE B, AUBERTIN M, BENZAAZOUA M. Microstructural evolution of cemented paste backfill: Mercury intrusion porosimetry test results [J]. Cement and Concrete Research, 2007, 37(12): 1654-1665.
[27] OUELLET S, BUSSIERE B, AUBERTIN M, BENZAAZOUA M. Characterization of cemented paste backfill pore structure using SEM and IA analysis [J]. Bulletin of Engineering Geology and the Environment, 2008, 67(2): 139-152.
[28] GAO Ru-gao, ZHOU Ke-ping, LI Jie-lin. Research of the mechanisms of backfill formation and damage [J]. Materiali in Tehnologije, 2017, 52(2): 163-169.
[29] ZHOU Ke-ping, GAO Ru-gao, GAO Feng. Particle flow characteristics and transportation optimization of superfine unclassified backfilling [J]. Mineral, 2017, 7(1): 6-27.
[30] QI Chong-chong, FOURIE A, CHEN Qiu-song, TANG Xiao-lin, ZHANG Qin-li, GAO Ru-gao. Data-driven modelling of the flocculation process on mineral processing tailings treatment [J]. Journal of Cleaner Production, 2018, 196: 505-516.
[31] MANGAT P S, OJEDOKUN O O. Influence of curing on pore properties and strength of alkali activated mortars [J]. Construction and Building Materials, 2018, 188: 337-348.
[32] SANTOS A R, VEIGA M D, SILVA A S, DE BRITO J, ALVAREZ J I. Evolution of the microstructure of lime based mortars and influence on the mechanical behaviour: The role of the aggregates [J]. Construction and Building materials, 2018, 187: 907-922.
胡建华1,任启帆1,马少维1,蒋 权1,蒋元建1,尚俊龙2,罗周全1
1. 中南大学 资源与安全工程学院,长沙 410083;
2. Nanyang Centre for Underground Space, School of Civil and Environmental Engineering, Nanyang Technological University, Singapore
摘 要:采取薄层断面分析和低场核磁共振(NMR)技术对3种矿用注浆材料的微观孔隙结构和孔隙率进行表征,通过图像二值化和随机行走孔隙谱维数(RWPSD)算法研究注浆材料的宏观孔隙特征――孔隙贯通性。实验结果表明:研究所用注浆材料的微观结构由层间孔、胶凝孔、毛细孔、圆形气孔和微裂缝组成。尾矿可以充填在水化产物结构中的孔隙内,使水化产物更加致密。孔隙贯通性与养护时间呈正相关,且与孔隙率之间存在一定规律。随着孔隙率和孔隙贯通性的增加,添加了速凝剂的注浆材料产生不均匀孔隙结构,使材料的凝结时间缩短、后期强度降低。
关键词:注浆材料;孔隙微观结构;孔隙贯通性;跨尺度研究;核磁共振;薄层断面分析;随机行走孔隙谱维数
(Edited by Wei-ping CHEN)
Foundation item: Project (41672298) supported by the National Natural Science Foundation of China; Project (2017YFC0602901) supported by the National Key Research and Development Program of China
Corresponding author: Shao-wei MA; Tel: +86-18535810016; E-mail: mashaowei@csu.edu.cn
DOI: 10.1016/S1003-6326(19)65015-6

