2024铝合金板搅拌摩擦焊接塑性材料流动的可视化检测与数值模拟
来源期刊:中国有色金属学报(英文版)2012年第6期
论文作者:武传松 张文斌 石磊 陈茂爱
文章页码:1445 - 1451
关键词:2024铝合金;数值模拟;可视化;搅拌摩擦焊;材料流动;传热过程
Key words:2024 aluminium alloy; numerical simulation; visualization; friction stir welding; material flow; heat transfer
摘 要:将薄铜片作为标示材料镶嵌于2024铝合金板中,经搅拌摩擦焊接焊后,用金相法观察其最终位置。参考材料流动的可视化实验结果,建立搅拌摩擦焊传热与材料流动的三维数值分析模型。搅拌针附近塑性材料流动速度分布模式的计算结果与可视化实验结果基本一致。当焊接速度一定时,随搅拌针旋转速度的提高,搅拌针附近塑性材料流动加剧。焊核区形状与尺寸的计算结果与实测数据吻合。
Abstract: Thin copper sheets as marker material were embedded into weld path of 2024 aluminium alloy plates and their final position after friction stir welding was examined by metallographic techniques. Referring to the visualized material flow patterns, a three-dimensional model was developed to conduct the numerical simulation of the temperature profile and plastic material flow in friction stir welding. The calculated velocity contour of plastic flow in close proximity of the tool is generally consistent with the visualized results. As the tool rotation speed increases at a constant tool travel speed, the material flow near the pin gets stronger. The predicted shape and size of the weld nugget zone match with the experimentally measured ones.

![]()

Trans. Nonferrous Met. Soc. China 22(2012) 1445-1451
WU Chuan-song, ZHANG Wen-bin, SHI Lei, CHEN Mao-ai
Key Laboratory for Liquid-Solid Structure Evolution and Processing of Materials of Ministry of Education,
Shandong University, Ji’nan 250061, China
Received 17 June 2011; accepted 05 September 2011
Abstract: Thin copper sheets as marker material were embedded into weld path of 2024 aluminium alloy plates and their final position after friction stir welding was examined by metallographic techniques. Referring to the visualized material flow patterns, a three-dimensional model was developed to conduct the numerical simulation of the temperature profile and plastic material flow in friction stir welding. The calculated velocity contour of plastic flow in close proximity of the tool is generally consistent with the visualized results. As the tool rotation speed increases at a constant tool travel speed, the material flow near the pin gets stronger. The predicted shape and size of the weld nugget zone match with the experimentally measured ones.
Key words: 2024 aluminium alloy; numerical simulation; visualization; friction stir welding; material flow; heat transfer
1 Introduction
High performance Al alloys are more and more widely used in manufacturing aerospace structures, aircrafts, lightweight automobiles and high-speed trains in order to decrease energy consumption. But high strength Al alloys of 2xxx series are hard to weld because of their low melting point, large thermal conductivity and high thermal expansion coefficient. When such Al alloys are welded by employing conventional fusion welding processes, quite a few defects and problems occur, e.g., porosity and solidification cracking in the fusion zone, large residual stress and thermal distortion of the welded structures [1]. These factors make the joining of Al alloys by conventional processes unattractive. Friction stir welding (FSW) was invented at TWI and was initially applied to Al alloys [2,3].
To obtain defect free, structurally sound and reliable welds, the quantitative understanding of the underlying principles of the FSW process is essential. Since its invention in 1991, FSW has been widely analyzed both experimentally and using mathematical models [4-7]. However, most of these models concerned with the thermal conduction phenomenon in FSW, and only a few considered the plastic material flow near the tool [8]. SEIDEL and REYNOLDS [9] experimentally examined the material flow in friction stir welds using a marker insert technique and provided a semi-quantitative view of the material transport in the weld zone. Some investigators modeled the two-dimensional flow around the tool pin [10-12]. COLEGROVE and SHERCLIFF [13] used commercial CFD code, FLUENT, to model the 3D metal flow around a threaded tool. Though the model captured many of the real process characteristics, but it over-predicted the temperature and size of the deformation zone. NANDAN et al [8,14] developed models for 3D visco-plastic metal flow in the friction stir welding of Al alloy 6061-T6 and 304 stainless steel, and calculated non-Newtonian viscosity for the metal flow considering strain rate, temperature and temperature- dependent material properties. Their model was based on a tool pin with cylindrical geometry. Material flow is influenced significantly by the tool design [4,15]. Generally, threaded conical pins are used to alter material flow, mixing and reduce process load [4]. In this study, friction stir welding process with a conical pin was numerically simulated to analyze three dimensional material flows, and FSW experiments of 2024 Al alloy were conducted to visualize the material flow using marker inserted method. The computed results were compared with the experimentally measured values.
2 Flow visualization experiments
The material flow during FSW depends on the tool geometry, process parameters and material to be welded. It is of practical importance to understand the material flow characteristics for optimal tool design and obtain high quality welds. Experimental observations are first attempted to obtain some information regarding the material flow during FSW, which would lay foundation for developing a mathematical model to understand the basic physics of the material flow occurred during FSW.
One method of tracking the material flow in a friction stir weld is to use a marker material as a tracer that is different from the material being welded [9]. In this study, six copper sheets were embedded into the weld path of Al alloy 2024 plates as markers to visualize the material flow in the friction stir welds. As shown in Fig. 1, the markers of copper sheets with dimensions of 10 mm×0.85 mm×2 mm were inserted transversally and longitudinally to the weld line. Such markers were embedded on both the advancing and the retreating sides at three different planes, corresponding to top, middle, and bottom of the plate thickness. Inserts were placed along the weld line in a staggered way to eliminate the possibility of the mixing of markers from different positions. The marker length of 10 mm ensured that some of the markers, far away from the weld line, extended outside of the shoulder (radius of 7.5 mm) and were not deformed by the welding process. After welding, the test plates were sectioned by employing a wire cutting machine. The surfaces of the samples were polished and etched, and then metallographic analyses were performed for each sample to elucidate the flow pattern.
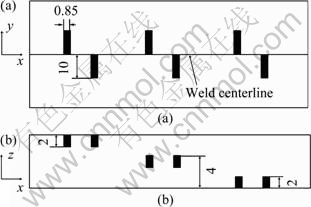
Fig. 1 Schematic diagrams of marker insert locations: (a) Top view; (b) Side view (unit: mm)
The experimental material is high strength 2024 Al alloy. Its chemical composition is presented in Table 1. The FSW equipment, model FSW-3LM-3012, was used to conduct the tests. The test pieces are in dimensions of 150 mm×75 mm×6 mm. Butt joints consisting of two test pieces were friction stir welded. The FSW tool consists of a cylindrical shoulder and a conic threaded pin. The tool geometry is defined in Table 2. Table 3 lists the ranges of the process parameters. For a test case, the following specific process parameters were used: ω= 850 r/min, ν=65 mm/min, Δz=0.1 mm. Figure 2 shows the morphology of the friction stir weld under the aforementioned conditions.
Table 1 Chemical composition of 2024 Al alloy (mass fraction, %)
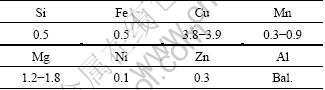
Table 2 Dimensions of FSW tool
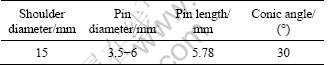
Table 3 Process parameters for FSW experiment
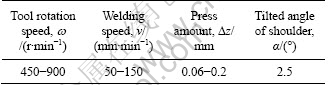
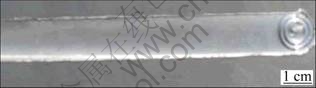
Fig. 2 Photo of friction stir weld
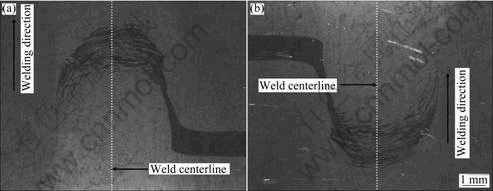
Figure 3 shows the images of the etched marker at a plane very near the top surface of the work-piece. The marker material flow locus is able to be seen. Under the action of rotating tool, a substantial amount of marker material is transported forward its original position (in the direction of welding). At the advancing side, some marker material has moved across the weld line to the retreating side around the tool pin, and then is separated from it. At the retreating side, a large amount of marker material is driven to the rear part behind the pin, and some has moved with the pin to the advancing side again.
Figure 4 shows the images of the etched marker at the middle height of the weld (z=0 mm). Due to the little effect of the shoulder at this location, the marker material does not produce a crescent-like transportation in large scale, compared to the section near the top surface (Fig. 3). At the advancing side, the rotating pin brings some marker material forward, and some part crosses the weld line. At the retreating side, most of the deformed marker material is transported backward, and only a small part crosses the weld line.
Figure 5 shows the images of the etched marker material at a plane 0.5 mm from the bottom surface of the work-piece. At this lower level in the weld, where the influence of the shoulder is diminished, there is only the rotation action of the pin tip, so that there is no larger scale migration of the marker material here. Under the extrusion of the pin, the marker material moves forward at the advancing side, but the migrating scale is less and no marker material crosses the weld line.
In summary, the flow patterns on the advancing and retreating sides are different, and the flow fields differ at different elevations (i.e., z-coordinate) along the thickness direction. Near the top surface, the effect of shoulder and the viscous momentum transfer is fairly pronounced, resulting in strong flowing velocity. Since the momentum decays rapidly in the thickness-direction away from the shoulder, the effect of rapid rotation of the shoulder does not reach the lower elevations near the bottom of the workpiece, where a weaker velocity field exists within a much smaller domain.
![]()
Fig. 3 OM images of marker material at plane z=2.99 mm (near top surface): (a) Advancing side; (b) Retreating side

Fig. 4 OM images of marker material at plane z=0 mm (mid-thick plane): (a) Advancing side; (b) Retreating side
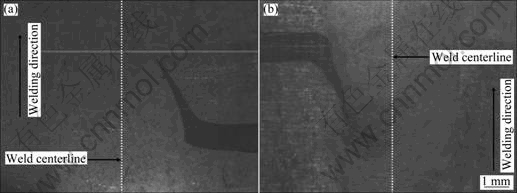
Fig. 5 OM images of marker material at plane z=-2.5 mm (0.5 mm from bottom surface): (a) Advancing side; (b) Retreating side
3 Mathematical modeling
The marker inserting technique does not directly provide detailed information on the actual flow field of the material because it shows only the final position of the markers in the weld. Mathematical modeling is a powerful tool to quantitatively describe the heat transfer and material flow during FSW.
During FSW process, the heating from the friction between the tool and the workpiece and plastic deformation soften the material around the pin. Except the beginning and end of welding, the FSW process is represented as a quasi-steady state, and the material flow past a rotating pin is taken as laminar, incompressible, non-Newtonian and visco-plastic. The elastic deformation in the vicinity of the tool is neglected since it is much smaller than the visco-plastic deformation. As shown in Fig. 6, the x-, y- and z-coordinates denote the welding direction, the transverse direction and the plate height, respectively. The origin of the coordinate system is at the mid-thickness plane of the workpiece.
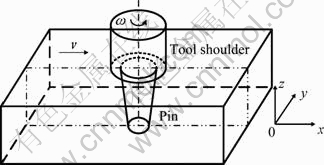
Fig. 6 Schematic diagram of friction stir welding system
The temperature and strain rate dependent dynamic viscosity μ can be calculated from flow stress and effective strain rate as [16]:
![]() (1)
(1)
where ![]() is the effective strain rate; σ is the flow stress and T is the temperature.
is the effective strain rate; σ is the flow stress and T is the temperature.
The flow stress is determined by Zenner-Hollomon equation as [17,18]:
 (2)
(2)
where A, β and n are the material constants, and Z is the Zener-Hollomon parameter which represents the temperature compensated effective strain rate, and is calculated according to
![]() (3)
(3)
where Q is the temperature-independent activation energy and R is the gas constant.
Combining Eqs. (1), (2) and (3) together, the viscosity can be expressed as:
 (4)
(4)
The effective strain rate is given as [7]:

 (5)
(5)
where ux, uy and uz are the flow velocity components in x, y and z directions, respectively.
The material flow should meet the following conservation equations:
![]() (6)
(6)
![]() (7)
(7)
![]() (8)
(8)
where u is the velocity vector; r is the density of metal; cp is the specific heat capacity; λ is the thermal conductivity; p is the static pressure and Qvd is the internal heat source term.
As shown schematically in Fig. 7, the tool consists of a cylindrical shoulder and a conic pin. The friction between the shoulder and workpiece results in the biggest component of heating. Assuming the downward force is uniformly exerted on the interface between the shoulder and the workpiece, the heat generated within the shoulder area may be written as:
![]() (9)
(9)
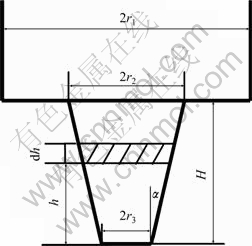
Fig. 7 Schematic sketch of tool pin
The heat flux at the shoulder matrix interface yields
![]() (10)
(10)
where q1 is the surface heat flux (W/m2); τf is the coefficient of friction; Pz is the downward force (N); ω is the tool rotation speed (r/min); r1 and r2 are the radii of the shoulder and the pin, respectively.
Similarly, the heat generated at the bottom surface of the pin is
![]() (11)
(11)
Along the side surface of the pin, some amount of heat is also generated due to the full sticking condition at the pin interface. The maximum shear stress τb for yielding is assumed to be
![]() (12)
(12)
where the yield stress σs is based on the distortion energy theory for plane stress. The heat caused by the rotating pin may be expressed as:
![]()
![]() (13)
(13)
where H is the pin height, h is the height variable shown in Fig. 7 and α is the conic angle.
The energy source term Qvd in Eq. (8) is then written as:
![]() (14)
(14)
where Vp is the volume of the pin that is defined as:
![]() (15)
(15)
The boundary condition for heat flux at the interface between the shoulder and the work-piece is given as:
![]() (16)
(16)
The boundary condition for heat exchange between the top surface of the workpiece and the surroundings beyond the shoulder is written as:
![]() (17)
(17)
where ht is the heat loss coefficient at the top surface and Ta is the ambient temperature.
At the bottom surface of the workpiece,
![]() (18)
(18)
where hb is the heat loss coefficient at the bottom surface.
The model assumes that the material sticks to the tool surface, so the material velocity equals the rotation speed multiplied by the radius. The translation is prescribed by allowing the material to flow past the tool. Therefore, the material enters the model at a velocity equal to the welding speed and at ambient temperature, as shown in Fig. 8. The tool pin surface is assumed as an adiabatic rotating wall. The top and bottom of the flow domain are modeled as moving walls with convective heat transfer to the surroundings. Both walls are moving at the welding speed. The advancing and the retreating sides are set as moving walls and the moving speed is equal to the welding speed. The velocity at the tool pin periphery is defined in terms of the tool pin angular velocity as:
![]() (19)
(19)
![]() (20)
(20)
where the angle θ is calculated by
 (21)
(21)
Similarly, at the shoulder contact, velocity condition may be written as:
![]() (22)
(22)
At all other surfaces, the velocities and temperatures are set to zero and at ambient temperature, respectively.

Fig. 8 Schematic sketch of boundary conditions
4 Simulation results
The workpiece material is 2024 Al alloy. The dimensions of the workpiece are 200 mm×50 mm×6 mm. Two pieces of such test plates are welded together. The governing equations and boundary conditions are discretized and solved numerically. The commercial software FLUENT is used to conduct the numerical simulation. The data related to the material properties used in the calculation are selected from Refs. [17-20] and listed in Tables 4 and 5. Except special specification, the study case is with a press amount of Δz=0.1 mm. Other parameters are listed in Tables 2 and 3.
Table 4 Specific heat capacity and thermal conductivity
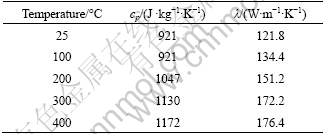
Table 5 Other parameters used in simulation
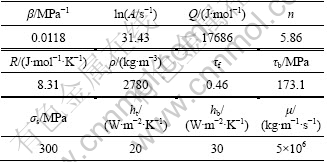
To study the influence of the tool rotation speed on the material flow, numeircal simulation is conducted under different levels of rotation speed but costant welding speed (80 mm/min). Other conditions are the same as listed in Tables 2 and 3. Figure 9 shows the flow vecolity contour at the mid-thickness plane (z=0). It illustrates the influence of rotation speed on the material flow when the welding speed keeps constant. For this mid-thickness plane, the friction and rotation action of the shoulder is lower, and its flow pattern can describe the material flow situation during the friction stir welding of the aluminium alloys. It is evident that the material flow near the pin gets stronger as the rotation speed increases. A higher rotation speed results in more heat generation, so that the material gets softening more easily. The maximum flow velocity at this plane rises with increasing tool rotation speed from 450 to 1250 r/min.
Figure 10 compares the calculated and measured nugget zone of 6 mm thickness 2014 Al alloy. The predicted nugget zone is determined according to the temperature. It shows that the calculated transverse cross-section of friction stir weld matches generally with the experimentally measured one. The calculated temperature ranges in the nugget zone, thermo- mechanical affected zone and heat affected zone are 468-519 ℃, 418-468 ℃ and 267-418 ℃, respectively.
Fig. 9 Velocity contour under different level of rotation speed: (a) ω= 450 r/min; (b) ω= 850 r/min; (c) ω=1250 r/min
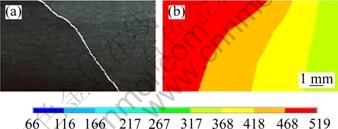
Fig. 10 Comparison of measured (a) and calculated (b) transverse section of friction stir weld (65 mm/min, 850 r/min)
It should be pointed out that the model is far from perfect because the material flow and heat generation phenomena in FSW are very complicated.Further deep investigation needs to be carried out for completely understanding the basic physics and complex interactions between a variety of simultaneous thermo-mechanical processes.
5 Conclusions
1) Using thin copper sheet as marker material, the general aspect of the material flow during friction stir welding of 2024 aluminium alloy plates is examined and evaluated in metallographic ways.
2) A three-dimensional model is developed for numerical simulation of the temperature field and plastic material flow in friction stir welding of 2024 aluminium alloy. The equations of conservation of mass, momentum and energy are numerically solved to quantitatively describe the thermal field and the visco-plastic flow of the material during the friction stir welding with a tool consisting of a cylindrical shoulder and conic pin.
3) The simulated results show that strong plastic flow takes place in the shear layer near the tool, and the tool rotation speed has significant effect on the flowing velocity field. The calculated overall mode of material flow is consistent with the visualized results by marker inserting technique. The predicted shape and size of the weld nugget zone generally match with the experimentally measured ones.
References
[1] LUAN Gou-hong. Friction stir welding promoting the development of aeronautical and astronautical industry [J]. Aeronautical Manufacturing Technology, 2006, (5): 1-3. (in Chinese)
[2] THOMAS W M, NICHOLAS E D, NEEDHAM J C, MURCH M G, TEMPLESMITH P, DAWES C J. Friction stir butt welding: UK, G. B. 9125978.8 [P].1991.
[3] DAWES C, THOMAS W M. Friction stir process welds aluminium alloys [J]. Welding Journal, 1996, 75(3): 41-45.
[4] MISHRA R S, MA Z Y. Friction stir welding and processing [J]. Materials Science and Engineering R, 2005, 50: 1-78.
[5] NANDAN R, DEBROY T, BHADESHIA H K D H. Recent advances in friction-stir welding-process, weldment structure and properties [J]. Progress in Materials Science, 2008, 53: 980-1023.
[6] YAN D Y, SHI Q Y, WU A P, SILVANUS J, ZHANG Z L. Developmental thermal-mechanical coupled analysis model for friction stir welding [J]. Journal of Mechanical Engineering, 2010, 46(16): 106-112.
[7] SONG M, KOVACEVIC R. Numerical and experimental study of the heat transfer process in friction stir welding [J]. Journal of Engineering Manufacture, 2003, 217: 73-85.
[8] NANDAN R, ROY G G, DEBROY T. Numerical simulation of three-dimensional heat transfer and plastic flow during friction stir welding [J]. Metallurgical and Material Transactions A, 2006, 37: 1247-1259.
[9] SEIDEL T U, REYNOLDS A P. Visualization of the material flow in AA2195 friction-stir welds using a marker insert technique [J]. Metallurgical and Material Transactions A, 2001, 32: 2879-2884.
[10] SEIDEL T U, REYNOLDS A P. Two-dimensional friction stir welding process model based on fluid mechanics [J]. Science and Technology of Welding and Joining, 2003, 8: 175-183.
[11] COLEGROVE P A, SHERCLIFF H R. Development of Trivex friction stir welding tool Part 2-three-dimensional flow modeling [J]. Science and Technology of Welding and Joining, 2004, 9: 483-492.
[12] SCHMIDT H, HATTEL J. Modeling heat flow around tool probe in friction stir welding [J]. Science and Technology of Welding and Joining, 2005, 10: 176-186.
[13] COLEGROVE P A, SHERCLOFF H R. 3-D CFD modeling of flow round a threaded friction stir welding tool profile [J]. Journal of Material Processing Technology, 2005, 169: 320-327.
[14] NANDAN R, ROY G G, LIENERT T J, DEBROY T. Numerical modelling of 3D plastic flow and heat transfer during friction stir welding of stainless steel [J]. Science and Technology of Welding and Joining, 2006, 11: 526-537.
[15] COLEGROVE P A, SHERCLIFF H R. CFD modeling of friction stir welding of thick plate 7449 aluminium alloy [J]. Science and Technology of Welding and Joining, 2006, 11: 429-441.
[16] THOMAS W M, JOHNSON K I, WEISNER C S. Friction stir welding―Recent developments in tool and process technologies [J]. Advanced Engineering Materials, 2003, 5: 485-490.
[17] SHEPPARD T, JACKSON A. Constitutive equations for use in prediction of flow stress during extrusion of aluminium alloys [J]. Material Science and Technology, 1997, 13: 203-209.
[18] SHEPPARD T, WRIGHT D S. Determination of flow-stress. Part 1: Constitutive equation for aluminium-alloys at elevated temperature [J] Metals Technology, 1979, 6: 215-223.
[19] ZHANG Wen-bin. Friction stir welding of aluminium alloy 2024 [D]. Ji’nan: Shandong University, 2010: 35-50. (in Chinese)
[20] SCHMIDI H B, HATTEL J. Material flow in friction stir welding-investigation of the shear layer [C]//Cerjak H. Mathematical modelling of weld phenomena 8. Graz: TU Graz Press, 2007: 725-739.
可视化检测与数值模拟
武传松,张文斌,石 磊,陈茂爱
山东大学 材料液固结构演变与加工教育部重点实验室,济南250061
摘 要:将薄铜片作为标示材料镶嵌于2024铝合金板中,经搅拌摩擦焊接焊后,用金相法观察其最终位置。参考材料流动的可视化实验结果,建立搅拌摩擦焊传热与材料流动的三维数值分析模型。搅拌针附近塑性材料流动速度分布模式的计算结果与可视化实验结果基本一致。当焊接速度一定时,随搅拌针旋转速度的提高,搅拌针附近塑性材料流动加剧。焊核区形状与尺寸的计算结果与实测数据吻合。
关键词:2024铝合金;数值模拟;可视化;搅拌摩擦焊;材料流动;传热过程
(Edited by FANG Jing-hua)
Foundation item: Project (GZ583) supported by the Sino-German Center for Science Promotion
Corresponding author: WU Chuan-song; E-mail: wucs@sdu.edu.cn
DOI: 10.1016/S1003-6326(11)61339-3

