J. Cent. South Univ. (2017) 24: 1197-1206
DOI: 10.1007/s11771-017-3523-8

Micromorphological characterization and random reconstruction of 3D particles based on spherical harmonic analysis
SHI Chong(КЇіз)1, 2, SHEN Jun-liang(ЙтїЎБј)1, 2, XU Wei-ya(РмОАСЗ)1, 2,
WANG Ru-bin(НхИз±ц)1, 2, WANG Wei(НхО°)1, 2
1. Key Laboratory of Ministry of Education for Geomechanics and Embankment Engineering,
Hohai University, Nanjing 210098, China;
2. Institute of Geotechnical Research, Hohai University, Nanjing 210098, China
 Central South University Press and Springer-Verlag Berlin Heidelberg 2017
Abstract: The microscopic characteristics of skeletal particles in rock and soil media have important effects on macroscopic mechanical properties. A mathematical procedure called spherical harmonic function analysis was here developed to characterize micromorphology of particles and determine the meso effects in a discrete manner. This method has strong mathematical properties with respect to orthogonality and rotating invariance. It was used here to characterize and reconstruct particle micromorphology in three-dimensional space. The applicability and accuracy of the method were assessed through comparison of basic geometric properties such as volume and surface area. The results show that the micromorphological characteristics of reproduced particles become more and more readily distinguishable as the reproduced order number of spherical harmonic function increases, and the error can be brought below 5% when the order number reaches 10. This level of precision is sharp enough to distinguish the characteristics of real particles. Reconstructed particles of the same size but different reconstructed orders were used to form cylindrical samples, and the stress-strain curves of these samples filled with different-order particles which have their mutual morphological features were compared using PFC3D. Results show that the higher the spherical harmonic order of reconstructed particles, the lower the initial compression modulus and the larger the strain at peak intensity. However, peak strength shows only a random relationship to spherical harmonic order. Microstructure reconstruction was here shown to be an efficient means of numerically simulating of multi-scale rock and soil media and studying the mechanical properties of soil samples.
Key words: meso particle; three-dimensional micromorphology; spherical harmonic function; random reconstruction; multi-scale
1 Introduction
Natural rocks and soil are composed of particles of different sizes cemented to each other. For instance, soil-rock-mixtures are a common and unstable medium in civil engineering. It consists of both small soil particles and large rock particles. When the larger particles make up a large proportion of the medium, they act as skeleton, supporting the soil-rock-mixture [1]. Micromorphological characteristics such as the size, gradation, outer contour and roughness of particles have an important effect on the macro mechanical properties of the soil-rock-mixture, especially on shear strength, expansibility, and pressure resistance [2]. The conventional approach to analysis of the deformation and strength characteristics of rock and soil media is to investigate the correlation between size and distribution of the large particles that exert a skeleton-like supportive effect on the soil through experimentation. The irregular shapes and surface texture of the particles allow them to create quasi-static shearing stresses, such as interlocking forces and frictional forces when there is relative movement between particles [3]. CUNDALL et al [4] created a numerical simulation of sandy soil. Their simulation produced good results when the micromechanical mechanisms of particle micromorphology are taken into consideration during analyses of the particlesЎЇ mechanical properties using the discrete element method (DEM). Multi-scale methods have been developed rapidly in recent years, and the consideration of particlesЎЇ geometric shapes has become a hot spot. With the aid of discrete element method, analyzing the mechanical properties of soil-rock-mixtures in this way has become a trend in the study of both micro- and macro-mechanical behaviors [5].
However, it is difficult to characterize the micromorphology of 3D particles due to the large amount of primary data involved. Traditional meso-characteristic analyses have primarily focused on 2D cases. These have involved defining some basic geometric properties such as measuring mesoscopic characteristic such as area, mean curvature, roundness, and ratio of convex to concave area [6, 7]. Some engineers measure the morphological parameters of particles (e.g., sphericity and roundness) by comparing the microscopic view to the standard chart provided by KRUMBEIN and SLOSS [8]. BOWMAN et al [9] were the first to use mathematical Fourier descriptors to characterize the outer contour of particles in 2D space. They also implemented random reconstruction of particles in randomly similar shapes based on the Fourier transform. However, real particlesЎЇ micromorphology is far more complex than the outer contour of 2D particles. In order to study the mechanical behavior of particles of rock and soil media, it is necessary to determine the outer contour features of particles in 3D space. With the development of 3D scanning technologies, such as laser scanning and CT scanning, the determination of particlesЎЇ outer contours has become more and more convenient. Some scholars have begun to investigate how to describe particlesЎЇ micromorphology in 3D terms. MOLLON and ZHAO [10] extended 2D Fourier descriptors to 3D micromorphological characterization of particles. The method directly reduces the difficulty of the 3D micromorphological characterization by adopting parameters in 2D space to characterize micromorphology in 3D space. However, the method can involve the loss of local information due to the artificial choice of three orthogonal cross-sections of the original surface profile, which leads to the inconsistency between the reconstructed particle and the original one, especially for highly irregular particles.
In this work, the basic framework of spherical harmonic analysis is introduced firstly. Then, it is made suitable for the characterization and reconstruction of particle micromorphology. Spherical harmonic functions were here used to validate the applicability and accuracy of this mathematical approach by calculating basic particle properties (i.e., volume and surface area). Finally, based on the spherical harmonic descriptors obtained by statistical calculation of a limit number of sample particles, four kinds particles of different spherical harmonic orders were randomly reconstructed and evaluated using compression stress-strain curves to determine the optimal spherical harmonic order in practical engineering applications.
2 Methodology of spherical harmonic function
The morphologies of rock and soil particles are random, multiple, and changeable in nature. Particles that experience the same geological loading history may have approximately the same statistical geological characteristics. Circular spheres are traditionally used to represent complex particles directly according to discrete element method, and the randomness and complexity of the micromorphology of particles are neglected [11].
Information concerning particlesЎЇ outer contours can be captured using 3D particle scanning, and 3D images can be produced. To begin with the image segmentation and binarization based on de-noising (eliminating the non-connected points and non-line) with recognition of the boundaries and spherical parameterization, a set of 3D matrices was produced using the coordinates of each pixel. Then, the Delaunay triangular mesh method of the outer contours of particles was used. This type of processing can be realized with the help of some auxiliary software programs, so these programs are not discussed here.
2.1 Description of particle morphology with spherical harmonic function
For an arbitrary 3D particle, the centroid is supposed to be at the origin of coordinate. Points on the outer contour of particle can be obtained by spherical coordinates as shown in Fig. 1. The distance between the centroid and a surface point can be described as r(¦И, ¦Х), associated with the corresponding spherical coordinates (¦И, ¦Х), where 0ЎЬ¦ИЎЬ¦Р, 0ЎЬ¦ХЎЬ2¦Р. All points on the surface of the spherical coordinates can be transformed into Cartesian coordinates using Eq. (1).
 (1)
(1)
The premise of successful transformation is surface non-convexity, which means that there are no overhangs or bubbles in the shape [12]. If there are overhangs or bubbles, each set of (¦И, ¦Х) would correspond to two or more values of polar radius, which renders the result non-unique. In this way, the outer contour points of a particle can be identified only if it lacks overhangs and bubbles. Then, the full coordinate function of any point on surface of the particle can be expressed as an expansion of the following spherical harmonic series:
 (2)
(2)
where r(¦И, ¦Х) is a set of polar radius points for (¦И, ¦Х);  is a spherical harmonic function that can be presented as Eq. (3); and
  is the corresponding spherical harmonic coefficient whose value should be found.
 (3)
(3)
Combining Eq. (2) with Eq. (3) produces the following equation:
 (4)
(4)
where  is the associated Legendre function; n is an integer that may range from anywhere between 0 and positive infinity; m is an integer between 0 and n; the different order of
  can be obtained iteratively from Eq. (5) to Eq. (6), shown as below:
When m=0, n>1:
 (5)
(5)
When m=0, n>1:
 (6)
(6)
where x=cos ¦И. When m=-M<0 or M>0, the equation can be transformed as follows:
 (7)
(7)
Taking the parameterized surface points r(¦И, ¦Х) as the input on the left-hand side of Eq. (2), this equation can be extended to a matrix shown as
 (8)
(8)
where n is the order used in the spherical harmonic functions; the row vector  is a spherical harmonic sequence of the point i. The column vector of coefficient
  has (n+1)2 unknown coefficients in all if n is known. The column vector of coefficient can be calculated by solving the i linear equations. So, the contour points i must be larger than (n+1)2. Then, Eq. (8) can be used to reach the optimal solution. can be used as the characteristic descriptor for the reconstruction of the particle micromorphology based on Eq. (2). In this work, the least square method was used to solve these contradictory equations.
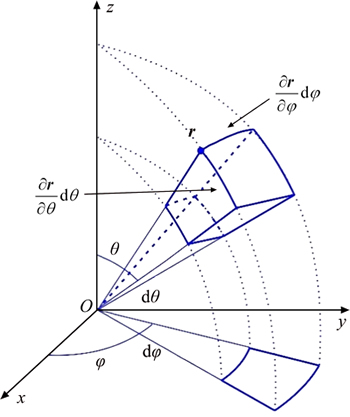
Fig. 1 Illustrative diagram of infinitesimal rectangular pyramid in spherical coordinate system
2.2 Parameters of characterization
As illustrated in Fig. 1, the particle can be segmented into several rectangular pyramids with the points known on the surface. Taking a rectangular pyramid randomly, the position vector of the element can be expressed as r(¦И, ¦Х), then the edge vectors of the rectangular pyramid can then be determined easily. In this way, the area and volume of rectangular pyramid can be expressed as shown in Eqs. (9) and (10):
 (9)
(9)
 (10)
(10)
where  can be expressed as
 (11)
(11)
where the partial derivative of can be expressed as follows:

 (12)
(12)
Combining Eq. (11) with Eq. (12), Eq. (11) can be modified as

 (13)
(13)
Similarly, the partial derivative of r(¦И, ¦Х) can be expressed as follows:

 (14)
(14)
The volume can be integrated using all surface points of the outer contour as shown in Eq. (15).
 (15)
(15)
In the same way, the total area of the particle can be expressed as the sum of several rectangular areas.
 (16)
(16)
Using the volume and total area of all particles, the sphericity index (SI) and the average angularity index (AI) can be calculated to characterize the micromorphology of particles directly (ASTM D5821 2006), in which SI is defined as follows.
 (17)
(17)
where SI is the total area and V is the volume of the particle. Another important parameter, AI, can be defined as
 (18)
(18)
where t is the iteration of the detection process, according to the precision needed, and t is set 0.01¦Р in this work; rp is the polar radius with the spherical coordinate (¦И, ¦Х), and rEE is the polar radius of the equivalent ellipsoid with the spherical coordinate (¦И, ¦Х). The equivalent ellipsoid can be easily obtained using the first order expansion of the spherical harmonic series. The sphericity index (SI) and the average angularity index (AI) can be used to evaluate the micromorphological characteristics of particles. The sphericity index (SI) can be used to assess the symmetry of particles, and the average angularity index (AI) can be used to assess the texture of the particle surface, and both symmetry and texture can be used in comparative study for micromorphology of randomly reconstructed particles.
3 Accuracy of spherical descriptor characterization analysis
As shown in Table 1, the validation of the spherical harmonic analysis was made by comparing the mathematical predictions to the theoretical or image-based results of one standard cube, one cylinder, and one real sample particle. This comparison showed that the smoothness of reconstructed particles on the surface varies with the spherical harmonic order n. It is a sphere that has the same volume as the real particle when n=0. The micromorphological features of particles are indicated more and more clearly as the spherical harmonic order n increases. The time required for calculation increases correspondingly. In order to analyze the relationship between the precision with which micromorphological features can be detected and the spherical harmonic order n, n=2, 5, 10, and 15 were chosen for comparisons of the characterization parameters, which included surface area and volume. Results showed the outer contours of the reconstructed particles become nearer to the theoretical value as the spherical harmonic order increased. The surface appeared smooth at low reconstruction order numbers. For example, it appeared as a sphere at n=0 and an ellipsoid at n=1. As the order number of spherical harmonic reconstruction increased, the details on the surfaces of the particles gradually became discernable. When the spherical harmonic order n reached 10, the relative errors of area and volume decreased below 5%, as indicated by comparison of the detected value to the theoretical value, which indicated that the values were very similar.
The volume and the surface area of the standard cube and the particle as a function of the spherical harmonic order n were examined in detail, and results are shown in Fig. 2 where the solid line is the theoretical value. From the trend of volume of the cube and the real sample particle presented in Fig. 2(a), the results show that the particle volume converged rapidly to a stable value that matched the results of image processing after the order number n exceeded 10 for the cube and the sample particle. When the spherical harmonic order n was below 5, the value first grew relatively quickly and then changed gradually and stabilized. As shown in Fig. 2(b), surface area showed a trend similar to that observed for volume: As the degree n increased, the predicted value gradually approached the theoretical value. The difference between the reconstructed value and the theoretical value of the surface of the real sample particle was mainly attributed to the fact that the real sample particleЎЇs surface was likely to be rougher than that of a standard cube. In this way, the influence of the roughness of the surface area of particles on surface area was greater than its influence on volume.
The results given above indicate that the particle analysis of spherical harmonic function is the process by which the reconstructed value approaches the theoretical
value gradually as the maximum order number n of expansion spherical harmonic coefficient increased. The basic shape and surface texture of particles can be characterized through this process, the precision of which depends on the precision of the outer contour scanner used on the particles and the selected maximum reconstruction order number of expansion spherical harmonic coefficient. When the maximum order number n of expansion spherical harmonic coefficient is 10, the outer contour of reconstructed particles or the geometric parameters (e.g. surface area and volume) approaches that of the theoretical particles, which is sufficiently precise and the calculation is reasonable for general engineering applications.
Table 1 SH reconstructions of particle micromorphology with different SH degrees n
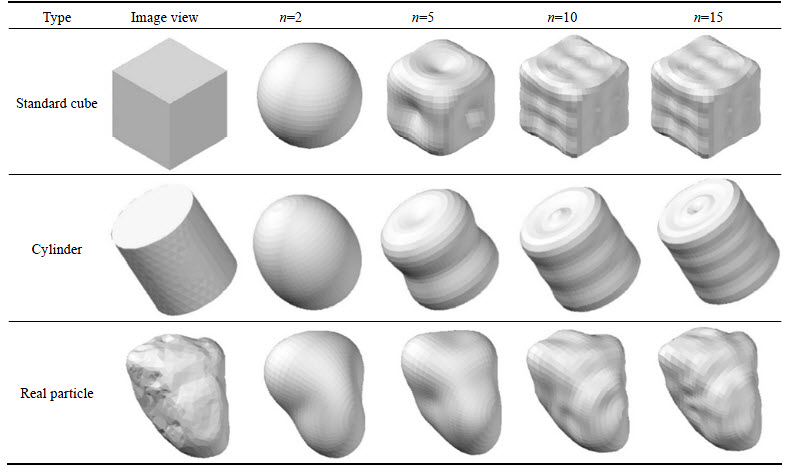
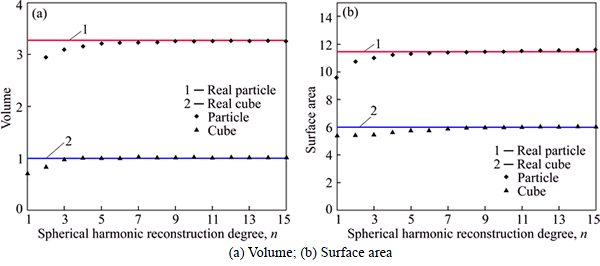
Fig. 2 Comparison of volume and surface area of particle and a 1 cm3 cube as a function of the number of spherical harmonic functions n used in the expansion:
4 Generation of randomly reconstructed particles
4.1 Statistics related to random particles
It is impossible to acquire the data covering all information of debris particles, and the finite number of scanned particles also cannot provide all of the information required for such a one-to-one mapping in discrete element numerical simulations, which is also very difficult on a practical level. In this way, it is significant to use statistical method of spherical harmonic analysis with real particles instead of scanning particles one by one in discrete element numerical simulations. Then, a large number of reconstructed particles can be obtained from a limited number of scanned sample particles using statistic spherical harmonic descriptors.
In order to solve the problem, the normal distribution can be applied to the spherical harmonic descriptors to derive the principal statistical variables for the morphological reconstruction. Figure 3(a) shows a sample particle, with its outer contour meshed using the Delaunay method and placed in coordinates randomly. In order to improve statistical analysis of the surfaces of the particles, each centroid was shifted to the origin of the spherical coordinates, and the original surface vertices must be rotated until they match the principal directions (solid line) determined by the ellipsoid obtained by its first-order reconstruction. The particle shown in Fig. 3(b) is rotated to parallel to the global coordinate axes and shown in rotated form in Fig. 3(c). In consequence of the similarity of particles, the particle radius cannot be changed. This process is called particle standardization. Finally, the spherical harmonic coefficients of standardized particles can be calculated after the standardized procession based on spherical harmonic function analysis is repeated.
The mean and standard deviation variance of spherical harmonic coefficients can be statistically analyzed based on spherical harmonic descriptors of a limited number of scanned sample particles. Standardized spherical harmonic coefficients can produce a variety of randomly reconstruction particles considering a related coefficient, and the randomly reconstruction particles generated have the same features as standardized particles. Mutated spherical harmonic coefficient can be expressed as follows:
 (19)
(19)
where is expectation of spherical harmonic coefficients of standardized particles;
  is standard deviation mentioned above, and
  is the variation coefficient meeting the needs of normal distribution. The randomly reconstructed particles can be generated by controlling the change in ¦О, which leads to the appearance of reconstruction particles generated with relevant characteristics. In the process of random delivery, generating the random particles in different angles as the spindle randomly only requires that the variables
  and
and  can be introduced.
As shown in Fig. 4, 25 random particles are generated randomly based on the rule mentioned above. The characteristics of the randomly reconstructed particles have the same major morphological features as those indicated by the original statistical data but they differed in the smaller details. The correlation between the sphericity and angularity of the reconstructed particles and statistical sample particles is shown in Fig. 5. The statistics of original particles and randomly reconstructed particles showed a similar relationship in SI and AI, which showed the outer contours of 100 particles to be very similar. These can be used as parameters in numerical because they can be expected to be similar in physical and mechanical applications. The method addresses problems faced by simulations involving a large number of random irregular particles,instead of only using spheres.
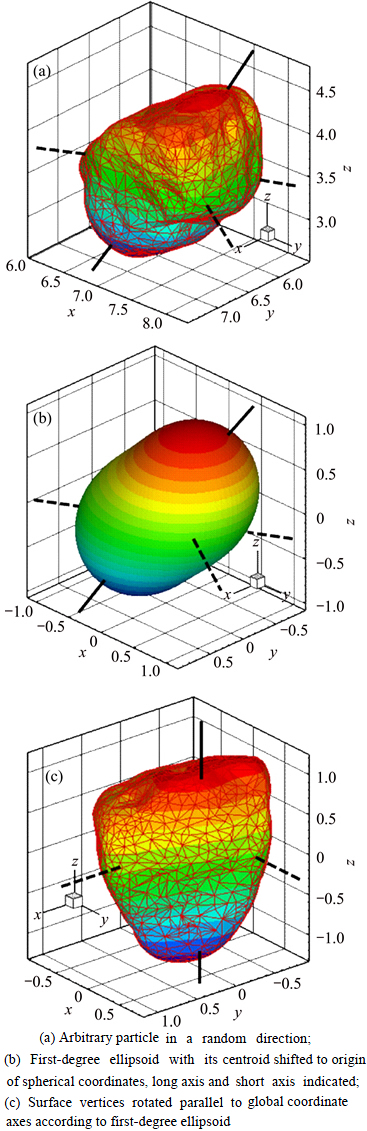
Fig. 3 Process of particles standardization:

Fig. 4 Generated assembly with randomly shaped particles with angles randomly distribution based on mean and standard deviation of particles

Fig. 5 Correlation between SI and AI of reconstruction particles and original statistical particles, where blue points for statistical particles, red for randomly reconstructed particles
4.2 Numerical simulation of randomly reconstructed particles
In order to analyze the influence on macroscopic mechanical properties of different spherical harmonic orders of reconstruction particles, the information regarding the sample particlesЎЇ outer contours should be assessed using a laser or CT scanner (Fig. 6). Then, these particles should be placed in a standard direction, and the particleЎЇs position should be analyzed by spherical harmonic. Finally, the reconstructed particles generated by spherical harmonic coefficient of standardized particles should be randomly put into the cylinder of 6 cm in radius and 12 cm in height shown in Fig. 7.
With regard to the micromorphology characterization of particles, according to the overlapping discrete element cluster method (ODEC) developed by DAS et al [13], each particle should be filled with a different number of spheres if particle flow code is used. In this work, the reconstructed particle assemblies of n=0, 1, 5, and 10 have been generated in Fig. 7. Each particle is made up of 1, 5-7, 140-150, and 200ЁC220 spheres, and these particles can be used in numerical simulations of PFC3D using the CLUMP cluster method (Itasca Consulting Group) [14]. Before the numerical simulation, the samples should be compacted by loading the planar, which can move along the axial direction of the cylinder. Compacting until the ratio of height and diameter reaches approximately 2:1. The wall of the cylinder can be controlled by using ItascaЎЇs built-in servo-controlled fish functions to reach a specified target confining stress in loading process. Due to the strong resistance during compression, the confining pressure 10 MPa is used in the servo process in this work. At the same time normal stiffness kn=1ЎБ109 is used for walls, and normal stiffness kn=1ЎБ107, shear stiffness ks=1ЎБ107, friction coefficient f=1.0 are adopted for clumps.
As shown in Fig. 8, results indicate that the micromorphological characterization of particles plays a
significant role in the curve of stress vs strain with the numerical simulation of four models with 10 MPa confining pressure. It mainly shows that the peak strength of samples is affected by the sphericity of sample particles. As shown in the figure, the peak strength of n=5, 10 was visibly higher than that of n=0, 1. It can be supposed that the peak strength increased as the spherical harmonic reconstructed order increased under the same confining pressure. However, the peak strength at n=5 is rarely higher than that at n=10 against the assumption given above. One reasonable explanation is that the elastic modulus decreases as the spherical harmonic reconstructed degree increases because the roughness of the particles renders the medium less compact. Another explanation is that the randomness of mechanical properties of particles become clearer as the spherical harmonic order increases, which indicates that the complexity of the soil-rock-mixture has a strong impact on the distribution of mechanical parameters. In Fig. 9, five random curves of the approximately meso characteristics are shown under axial compression and confining stress 10 MPa. There is about 8 MPa difference between the lowest peak strength and the highest one. Apparently, it shows that the randomness exists even the particles reconstructed by sphere harmonic n=1. The stronger difference is shown in Fig. 10. The highest peak strength almost reached double of the lowest one, but all the peak strengths of five curves are higher than lower reconstruction degree shown in Fig. 9. As the randomness of soil-rock-mixture particles in reality is uncertain and diversiform, it is necessary to research the distribution of mechanical parameters further. The method described here is an improvement upon traditional methods that use spheres for the numerical simulation of particles. Spheres are often similar enough to actual particles to indicate the complexity and the randomness of the soil-rock-mixture.

Fig. 6 Stages of clumping based on 3D laser scanner:

Fig. 7 Three-dimensional triaxial compression test simulations performed on particles, each a single sphere:

Fig. 8 Line chart of axial strain and deviatoric stress with different SH particles
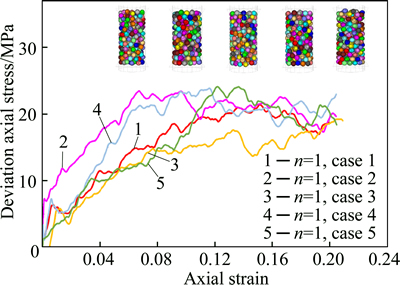
Fig. 9 Line chart of axial strain and deviatoric stress with 5 samples of randomly reconstructed particles by SH n=1 in same conditions
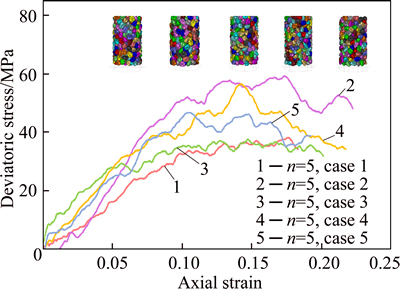
Fig. 10 Line chart of axial strain and deviatoric stress with 5 samples of randomly reconstructed particles by SH n=5 in the same conditions
5 Discussion
According to some studies, mechanical properties like the peak strength, splitting strength, damage strength, elastic modulus, and Poisson ratio have a strong correlation with sphericity [13-15]. SHI et al [16] used particles filled with the clumps of spheres in 2D particle making up the defect of the particles filled with only one ball. However, this method cannot characterize the actual particlesЎЇ outer contours. The 3D particlesЎЇ outer contour is characterized precisely based on spherical harmonic function, addressing problems that can occur in the handling of the micromorphological characterization and reconstruction of particles. The reconstructed particles were reconstructed in 3D space by three orthogonal cross-sections by MOLLON and ZHAO [10]. This method has disadvantages in the characterization of 3D particles, especially in the characterization of asymmetrical and irregular particles.
By generating highly similar reconstructed particles after scanning particles and homogenization, these reconstructed particles of different order numbers can be filled with spheres based on ODEC and put into the cylinders. Comparing the results of different spherical harmonic order samples based on numerical simulation, it shows that the results of the high spherical harmonic order of generated sample particles are similar to the theoretical mechanical parameters. The approach used in this study has far better accuracy with respect to the outer contour of particles than traditional methods. It has shown considerable precision and considerable consistency with theoretical values. The precision of the spherical harmonic reconstruction relies strongly on the scanner resolution and the maximum spherical harmonic degree used. Because of the advantages of the characterization and the similarity of generating reconstructed particles based on spherical harmonic function, to indicate the micro-mechanical properties of quasi-static shear between particles and better understand the changes that take place in the physical and mechanical properties of natural particles under external load and geological weathering. This process can be widely applied to general engineering analysis.
Compared with the analysis of 3D Fourier descriptors, spherical harmonic order is the extension of Fourier series. It is a method of curve fitting that involves producing a mathematical continuous surface contour with the spherical harmonic order increased until the predicted contours are similar to those of the real 3D particles. So, the function coefficient should be determined by discrete points on the outer contour, the precision of which is related to point number and the surface roughness, usually it should keep in thousand or tens of thousands, the more points certainly can depict more refined meso characteristic but cost more computation time. Due to the intrinsic limitations of spherical harmonic functions, it is difficult to catch and reconstruct the details, such as the shapes of edges. This is because the continuous spherical harmonic function cannot mesh discontinuous characteristics very well, and it also cannot characterize the overhangs or bubbles in the particles.In this work, it shows that the higher the degree of spherical harmonic function is, the more accurate the reconstructed particles are. It still cannot be widely adopted in general engineering geological problems involving analysis with high-precision spherical harmonic function. It is very expensive to solve problems with high-precision calculation and analysis if those problems involve large numbers of geotechnical particles. There may be errors in the measurements because of inaccurate processing of adjacent particles boundaries.
6 Conclusions
1) When the discrete points are transformed into a continuous contour in 3D space, the appropriate spherical harmonic order depends on the level of precision required, and the outer contours of particles can be analyzed based on spherical harmonic function. In this way, the fine details of the outer contours of geotechnical particles can be realized effectively.
2) The randomness of spherical harmonic coefficients can be verified statistically. Then random generation of reconstructed particles is realized based on a limited number of particles through supposed normal distribution. These reconstructed particles with similar major morphology features can be used to evaluate the role of the skeleton-support provided by larger particles in mixed multi-scale rock and soil media.
3) The compression stress-strain curve varied considerably with different levels of spherical harmonic order. Under conditions of high spherical harmonic order, the microscopic features of the reconstructed particles had a profound effect on the mechanical parameters of the sample. The compression stress-strain of samples with the same spherical harmonic order is also compared to demonstrate the randomness of the reconstructed particles in the same conditions. This method can be used to determine the microscopic characteristics of particles, such as their outer contour and roughness, facilitating the prediction of macro- and micro- mechanics fields.
References
[1] PETERS J F, MUTHUSWAMY M, WIBOWO J, TORDESILLAS A. Characterization of force chains in granular material [J]. Physical Review E, 2005, 72(4Pt1): 041307.
[2] FITYUS S G, GIACOMINI A, BUZZI O. The significance of geology for the morphology of potentially unstable rocks [J]. Engineering Geology, 2013, 162: 43-52.
[3] ZHOU B, HUANG R, WANG H, WANG J. DEM investigation of particle anti-rotation effects on the micromechanical response of granular materials [J]. Granular Matter, 2013, 15(3): 315-326.
[4] CUNDALL P A, STRACK O D L, CUNDALL P A. Discussion: A discrete numerical model for granular assemblies [J]. GЁ¦otechnique, 1980, 30: 1-10.
[5] FERELLEC J, McDOWELL G. Modelling realistic shape and particle inertia in DEM [J]. GЁ¦otechnique, 2010, 60: 227-232.
[6] TAYLOR M A, GARBOCZI E J, ERDOGAN S T, FOWLER D W. Some properties of irregular 3-D particles [J]. Powder Technology, 2006, 162(1): 1-15.
[7] KONG Liang, PENG Ren. Particle flow simulation of influence of particle shape on mechanical properties of quasi-sands [J]. Chinese Journal of Rock Mechanics\s&\sengineering, 2011, 30(10): 2112- 2119.
[8] KRUMBEIN W C, SLOSS L L. Stratigraphy and sedimentation [J]. Soil Science, 1951, 71(5): 401.
[9] BOWMAN E T, SOGA K, MMOND W. Particle shape characterisation using Fourier descriptor analysis [J]. GЁ¦otechnique, 2001, 51(6): 545-554.
[10] MOLLON G, ZHAO J. Generating realistic 3D sand particles using Fourier descriptors [J]. Granular Matter, 2013, 15(1): 95-108.
[11] SHI D D, ZHOU J, JIA M C, YAN D X. Numerical simulations of particle breakage property of sand under high pressure 1D compression condition by use of particle flow code [J]. Chinese Journal of Geotechnical Engineering, 2007, 29(5): 736-742.
[12] GARBOCZI E J. Three-dimensional mathematical analysis of particle shape using X-ray tomography and spherical harmonics: Application to aggregates used in concrete [J]. Cement & Concrete Research, 2002, 32(10): 1621-1638.
[13] DAS G, GIORDANO P, BARROT D, MANDAYAM S, SUKUMARAN B, ASHMAWY A K. Discrete element modeling and shape characterization of realistic granular shapes [C]// Proceedings of the Eighteenth. E. Fontaine, K. Uchida, J. S. Chung and H. Moshagen, 2008. 525-532.
[14] Itasca Consulting Group Inc. PFC3D userЎЇs manual [R]. Minneapolis, USAЈєItasca Consulting Group, 2006.
[15] LIU Guang, RONG Guan, PENG Jun, HOU D, ZHOU C B. Mechanical behaviors of rock affected by mineral particle shapes [J]. Chinese Journal of Geotechnical Engineering, 2013, 35(3): 540-550. (in Chinese)
[16] SHI D D, ZHOU J, LIU W B, JIA M C. Numerical simulation for behaviors of sand with non-circular particles under monotonic shear loading [J]. Chinese Journal of Geotechnical Engineering, 2008, 30(9): 1361-1366. (in Chinese)
(Edited by DENG LЁ№-xiang)
Cite this article as: SHI Chong, SHEN Jun-liang, XU Wei-ya, WANG Ru-bin, WANG Wei. Micromorphological characterization and random reconstruction of 3D particles based on spherical harmonic analysis [J]. Journal of Central South University, 2017, 24(5): 1197-1206. DOI: 10.1007/s11771-017-3523-8.
Foundation item: Project(2015CB057903) supported by the National Basic Research Program of China; Projects(51679071, 51309089) supported by the National Natural Science Foundation of China; Project(BK20130846) supported by the Natural Science Foundation of Jiangsu Province, China; Project(2013BAB06B00) supported by the National Key Technology R&D Program, China; Project(2015B06014) supported by the Fundamental Research Funds for the Central Universities, China
Received date: 2015-08-27; Accepted date: 2015-12-27
Corresponding author: SHI Chong, PhD, Associate Professor; Tel: +86-13770773434; E-mail: scvictory@hhu.edu.cn

