J. Cent. South Univ. Technol. (2009) 16: 0994-1000
DOI: 10.1007/s11771-009-0165-5

A case study of seismic response of earth embankment foundation on liquefiable soils
HUANG Yu(黄 雨)1, 2, YASHIMA A3, SAWADA K3, ZHANG Feng(张 锋)4
(1. Department of Geotechnical Engineering, Tongji University, Shanghai 200092, China;
2. Key Laboratory of Geotechnical and Underground Engineering, Ministry of Education,
Tongji University, Shanghai 200092, China;
3. Department of Civil Engineering, Gifu University, Gifu 501-1193, Japan;
4. Department of Civil Engineering, Nagoya Institute of Technology, Nagoya 466-8555, Japan)
Abstract: A case study of seismic response of an earth embankment foundation on liquefiable soils in Kansai area, western Japan was presented. Based on a calibrated cyclic elasto-plastic constitutive model for liquefiable sand and Biot dynamic coupled theory, the seismic analysis was carried out by using a dynamic effective stress finite element method under plane strain condition. A recent design study was illustrated in detail for a river earth embankment subjected to seismic excitation on the saturated deposits with liquefiable sands. Simulated results of the embankment foundation during liquefaction were obtained for acceleration, displacement, and excess pore water pressures, which were considered to yield useful results for earthquake geotechnical design. The results show that the foundation soil reaches a fully liquefied state with high excess pore pressure ratios approaching to 1.0 due to the earthquake shaking. At the end of the earthquake, the extensive liquefaction causes about 1.0 m lateral spreading at the toe and 60 cm settlement at the crest of the earth embankment.
Key words: earth embankment; earthquake liquefaction; cyclic plasticity; finite element method; case study
1 Introduction
Liquefaction is the most important cause of instability of earth embankments during earthquakes and may cause large deformation, loss of capacities and even complete failures. A significant number of earth embankments of river dikes, road embankments, and earth dams suffered heavy damages in past earthquake case histories, such as Hyogoken-Nambu earthquake in 1995[1-2]. In accordance with field case histories, the results of experimental tests have confirmed that liquefaction plays a major role in the process of damage to earth embankments[3-4]. Hence, it is necessary to develop an appropriate method for the numerical modeling of liquefaction in embankment foundations. As far as the framework of the earthquake geotechnical modeling, there are two general approaches: total stress method and effective stress method. For the total stress method, it is difficult to consider the liquefaction caused by the pore pressure in saturated sandy deposits. Therefore, theoretically, the behavior of soil liquefaction can only be achieved through effective stress analysis that considers the interaction between soil skeleton and pore fluid. At present, a classical form of finite element solution proposed by ZIENKIEWICZ and TAYLOR[5] for effective stress analysis has been applied to the corresponding numerical computation, and there have been several numerical investigations of liquefaction in earth embankment foundations[6-10]. According to these studies, seismic behavior of earth embankments on liquefiable soils can be properly simulated through dynamic soil-water coupled analysis and cyclic elasto-plastic constitutive relationship of soils.
The objective of this work was to develop an efficient numerical method for modeling earthquake liquefaction of earth embankments in geotechnical earthquake resistant analysis. Based on a soil constitutive model for sand liquefaction[11] and Biot dynamic consolidation theory, a finite element analysis of a recent case study was performed.
2 Methods of analysis
2.1 Numerical method
Based on Biot dynamic equations for two-phase porous media, the dynamic interaction of pore water with solid soil skeleton under fully saturated conditions was concerned. This two-phase behavior belongs to class II coupled problems[5]. The coupling occurs through the governing differential equations of both solid mechanics and transient seepage. Class II coupled problems can be solved numerically under imposed boundary and initial conditions by the finite element method. Specifically for low frequency problems like earthquakes, the most general formulation, u-p formation is performed, where the final matrix equations are defined in terms of two sets of independent variables: solid displacement (u) and pore pressure (p). In order to satisfy numerical stability criteria, the mixed formulation requires non-uniform interpolation of displacement and pore pressure variables in most numerical solutions. So, in this work, an FE-FD hybrid scheme was used [12]. In this method, the displacements were discretized in terms of the nodal values by the finite element method, whereas the pore pressures were constants within an element and spatially discretized by the finite difference method.
2.2 Constitutive model for liquefiable sand
Obviously, it is an important problem to select a suitable constitutive model for modeling the behavior of liquefiable sand. A lot of constitutive models have been proposed until now, from the relatively simple hysteretic nonlinear models to complex elastic-kinematic hardening plastic models. Here, based on the previous work of OKA et al[11], liquefiable saturated sand was represented by a cyclic elasto-plastic constitutive model, which was mainly composed of overconsolidation boundary surface, Armstrong-Frederick type nonlinear kinematic hardening rule and non-associated flow rule. Under seismic loading, it was proved that the constitutive law could well describe the responses of such features as cyclic mobility, liquefaction strength, effective stress path, and stress―strain relationship[13-16].
2.2.1 Overconsolidation boundary surface
The overconsolidation boundary surface fb is used to describe the stress history of soils. When fb≥0, soils will be located in the normalized consolidated state. Whereas when fb<0, soils will be in the overconsolidated state. Similar to other boundary models, the purpose of the overconsolidation boundary surface is to describe the plastic deformation on the yield surface under cyclic loading, which is defined as follows:
 (1)
(1)
 (2)
(2)
 (3)
(3)
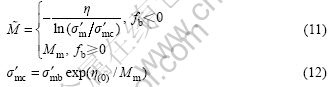
where ηij is the stress ratio, 
 is the mean effective stress,
  and δij is the Kronecker sign;
  is the effective stress; sij is the deviatoric stress,
  ; ηij(0) is the initial value of ηij; Mm is the phase transformation stress ratio; and
  is the value of at the intersection of ηij(0) line and overconsolidation boundary surface.
 (4)
(4)
where  is the initial value of
  ; e is the void ratio; λ is the compression index; κ is the swell index; and
  is the plastic volumetric strain.
2.2.2 Yield surface
The yield surface is composed of two functions, fy1 and fy2. Function fy1 reflects the change of stress ratio. While fy2 describes the change of mean effective stress. fy1 is defined as follows:
 (5)
(5)
where χij is the kinematic hardening parameter, known as back stress parameter; k is a numerical parameter that controls the size of the elastic region. Regarding the translation of the yield surface, in the classical plasticity, it is common to use linear kinematic hardening rules, like the models of Prager and Ziegler. Here, for more accurate prediction of the multiaxial Bauschinger effect, a modified Armstrong and Frederick nonlinear kinematic hardening rule is adopted as follows[17]:
 (6)
(6)
 (7)
(7)
 (8)
(8)
where Mf is the failure ratio;  is the deviatoric plastic strain increment; dγp is the second invariant of ;
  is accumulated value of γp between two sequential stress reversal points in previous cycle; B0, B1 and Cf are material parameters. Therefore, this rule generalizes the Prager linear hardening rule by adding an evanescent strain-memory term (dynamic recovery term) to overcome the shortcoming of linear proportion between dcij and in Prager model. This shows an excellent correlation with the experimental results for monotonic and cyclic loading.
The other yield function fy2 is defined as:
 (9)
(9)
where ym is the scalar kinematic hardening parameter;  is the unit value of the mean effective stress; and Rd is the scalar parameter. As the effective stress in soils decreases gradually during the process of liquefaction in earthquakes, the yield state of fy2 cannot be reached in this research.
2.2.3 Plastic potential function
Using the non-associated flow rule, the plastic potential function g is defined as
 (10)
(10)
where  is a constant; and
  is calculated by the following equation:
Incorporating the above analysis method, a verified computer program named LIQCA (coupled analysis of LIQuefaction) was employed in this work. This program was developed by members of the LIQCA Research Group in 1990’s in Japan and was first released publicly in 2002. The program allowed simultaneous pore pressure build-up and dissipation to be simulated, which is suitable for liquefaction analysis.
3 Project description
The presented project was a plane strain seismic analysis of part of a new river dike in Kansai area, western Japan. As severe earthquakes occur regularly in Japan, it is necessary to verify the stability of the earth embankment under strong seismic design motions. The configuration of earth embankment analyzed here is shown in Fig.1. The soil at the site consisted of about 9 m of mixed hydraulic sand fill overlying about 17 m of alternating bands of clays and sands. The groundwater table was at about 1.2 m under the ground surface. Therefore, most of the soil deposits were fully saturated under the ground surface. This character of saturation obviously influenced the earthquake response of soil layers related to liquefaction and softening. The finite element model consisted of 2 848 nodes, and 2 732 four-node quadrilateral elements.

Fig.1 Configuration of earth embankment (Unit: m)
The following constitutive models were used for plane strain elements in the analysis.
(1) Shallow sand layers, B, S1a and S1b, were modeled by aforementioned elasto-plastic constitutive law for sand. These sand layers were present at the upper portions of the site and consisted of recent fill and alluvia soils with a thickness of about 9 m, which were susceptible to liquefaction as proved by Hyogoken- Nambu earthquake in 1995, Japan. The filling material of embankment also consisted of sand B.
(2) Below the shallow sand layers, alluvial clays, C1 and C2 were encountered, which were more homogeneous and modeled by a similar cyclic elasto-viscoplastic constitutive law for clay[18]. The clay model had the same frame as the sand model, but with the additional consideration for the viscous effect of clays.
(3) The lower underlying geology of the site was composed of over 6 m of dense sand layers, S2 and S3. They were viewed as stable bearing layers during earthquakes and then modeled by Ramberg-Osgood model.
Material parameters used in the analysis are listed in Tables 1 and 2. Fig.2 shows the simulated liquefaction strength curves of liquefiable sand layers (B, S1a and S1b) with 5% double-amplitude of axial strain in triaxial test. All these soil parameters were defined by taking into account typical experimental values for liquefiable sand based on the results of geotechnical investigations. The procedures for parameter selection for soils can be found in Ref.[11].
A horizontal earthquake time history with the maximum acceleration of 1.5 m/s2 was used as excitation in the analysis, which is shown in Fig.3 and an extreme
Table 1 Parameters used for sands and clays (elasto-plastic model)
Note: N denotes blow count of SPT; ρ denotes density of soil; k denotes coefficient of permeability; e0 denotes initial void ratio; υ denotes Poisson ratio; λ denotes compression index; κ denotes swelling index; OCR* denotes quasi-overconsolidation ratio; G0/σ′m denotes initial shear modulus ratio; M*m denotes phase transformation stress ratio; M*f denotes failure stress ratio; B*0 and B*1 denote hardening parameters;  and
and  denote reference strain parameters; Cd denotes disappearance of anisotropy; D*0 and n denote dilatancy parameters; m′0, C01 and C02 denote viscoplastic parameters for clay elasto-plastic model.
Table 2 Parameters used for sands (Ramberg-Osgood model)
Note: a and b stand for shear modulus parameters of sand; C denotes cohesion of sand; α and r stand for Ramberg-Osgood parameters.
earthquake corresponding to the ultimate limit state of collapse event specified for the river embankment is represented. The input motion for 70 s was applied synchronously across the base of the model.
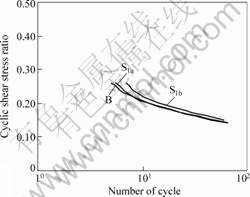
Fig.2 Simulation of liquefaction strength of liquefiable sand layers
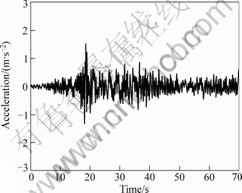
Fig.3 Input earthquake wave with maximum acceleration of 1.5 m/s2
4 Results and analysis
4.1 Acceleration
The predicted accelerations at points from A to D (see Fig.1) are shown in Fig.4, respectively. The results reveal the damping effect of soils. The soil deposits act as a damper when the bedrock earthquake acceleration is transmitted through soil. Due to liquefaction of shallow sand deposits, the frequency content of soil ground acceleration has a tremendous difference in comparison with that of the bedrock acceleration. The soil deposit attenuates a significant portion of the high frequency content of the bedrock acceleration. The isolation effect and damping effect of liquefied soil on earthquake acceleration response of embankment are proved.
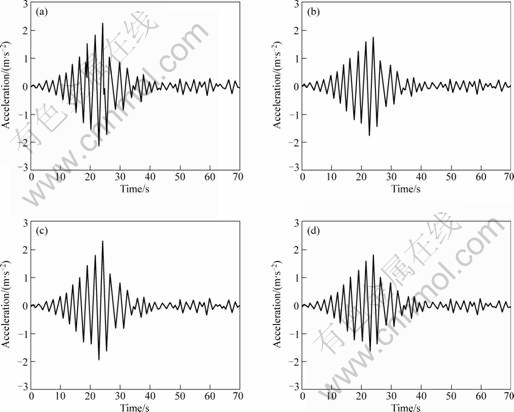
Fig.4 Accelerations at different points: (a) Point A; (b) Point B; (c) Point C; (d) Point D
Both points A and C are located above the ground water table, in which the soils do not experience tremendous stiffness reduction and degradation during the earthquake. Therefore, compared with the underlying liquefied saturated soil, they show similar acceleration responses as a quasi-rigid body.
4.2 Displacement
The predicted displacements at points from A to D are shown in Fig.5, respectively. Fig.6 shows the
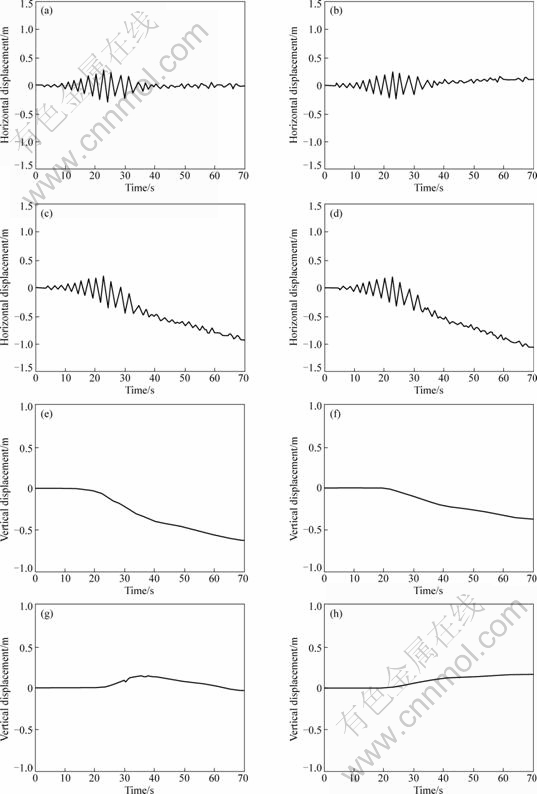
Fig.5 Displacements at different points: (a) Horizontal displacement at point A; (b) Horizontal displacement at point B; (c) Horizontal displacement at point C; (d) Horizontal displacement at point D; (e) Vertical displacement at point A; (f) Vertical displacement at point B; (g) Vertical displacement at point C; (h) Vertical displacement at point D
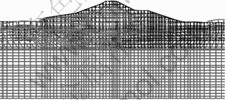
Fig.6 Configuration of earth embankment at end of earthquake
configuration of the earth embankment at the end of the earthquake, where the displacements were magnified by three times for easy comparison.
From this result, it is found that liquefaction occurs in the free field, which causes the large deformation of the embankment by lateral flow of the base ground. There is about 1.0 m lateral spreading of the foundation soil towards the free field at the toe. The upper soils have larger displacements compared with the lower soils during excitation. Moreover, the seismic displacements of embankment soils are much larger than those of the free field soils. The crest undergoes a large settlement over 60 cm due to the combined action of the migration of the underlying foundation soil and the deformation of the embankment itself, which adequately agrees with the observed conclusions from earthquake case histories. It should also be noted that the total deformation increases continuously until the full dissipation of excess pore water pressure.
4.3 Pore water pressure
The time histories of excess pore water pressure ratios (ηEPWPR) at points B and D are shown in Fig. 7. The
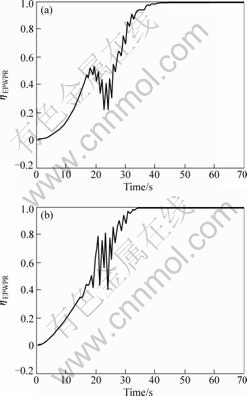
Fig.7 Time histories of excess pore water pressure ratios (ηEPWPR) at different points: (a) Point B; (b) Point D
final distribution of excess pore water pressure ratios in the earth embankment is shown in Fig.8. During the earthquake, in the shallow sand layers, excess pore pressure ratio approaches 1.0 after about 30 s and remains high thereafter. The maximum ηEPWPR is equal to or close to 1.0 at the end of earthquake. Whereas, in the portion beneath the embankment, due to the initial stress state, the seismic pore water pressure ratios are less than those of the free field at the same depths.
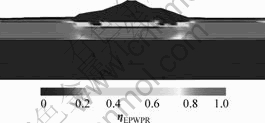
Fig.8 Excess pore water pressure ratio of earth embankment at end of earthquake
5 Conclusions
(1) Earth embankments on liquefiable saturated loose sandy ground are easily damaged during earthquake shaking. Pore water pressure rapidly increases due to the dilative response of liquefiable soils induced by earthquake shaking, which leads to consequent decrease of effective stress. According to the principal effective stress, the soil may undergo progressive degradation of strength and stiffness. While the soil is in a fully liquefied state, a significant soil strength may take place, resulting in large permanent deformation and even complete failure of earth embankments. Therefore, analysis and design of earth embankments require an assessment of probabilities of seismic liquefaction and determination of the consequences of the event.
(2) A finite element approach of dynamic coupled analysis in the fluid-saturated porous solid is performed in the case study for the liquefaction simulation of the earth embankment. With the proposed analysis theory and a specific FE program LIQCA, an illustrative project case is carried out in order to check the validity of the proposed approach.
(3) In the case, the seismic loading induces a typical pattern of liquefaction response of the foundation soil with excess pore pressure ratios approaching to 1.0 after about 30 s and remains high thereafter. The extensive liquefaction causes a typical lateral spreading of the foundation soil towards the free field. The crest undergoes large settlement due to the combined action of the migration of the underlying foundation soil and the deformation of the embankment itself.
(4) The numerical simulation can capture the fundamental aspects of the liquefaction of earth embankment, and can produce useful results for seismic design and verification.
References
[1] MATSUO O. Damage to river dikes[J]. Soils Foundations, 1996, 36(1): 235-240.
[2] TANI S. Damage to earth dams[J]. Soils Foundations, 1996, 36(1): 263-272.
[3] KOGA Y, MATSUO O. Shaking table tests of embankments resting on liquefiable sandy ground[J]. Soils and Foundations, 1990, 30(4): 162-74.
[4] ADALIER K, ELGAMAL A W, MARTIN G R. Foundation liquefaction countermeasures for earth embankments[J]. Journal of Geotechnical and Geoenvironmental Engineering, 1998, 123(6): 500-517.
[5] ZIENKIEWICZ O C, TAYLOR R L. The finite element method[M]. Oxford: Butterworth-Heinemann, 2000.
[6] AYDINGUN O, ADALIER K. Numerical analysis of seismically induced liquefaction in earth embankment foundations: Part I[J]. Canadian Geotechnical Journal, 2003, 40(4): 753-765.
[7] ADALIER K, AYDINGUN O. Numerical analysis of seismically induced liquefaction in earth embankment foundations: Part II[J]. Canadian Geotechnical Journal, 2003, 40(4): 766-779.
[8] ELGAMAL A, PARRA E, YANG Z, ADALIER K. Numerical analysis of embankment foundation liquefaction countermeasures[J]. Journal of Earthquake Engineering, 2002, 6(4): 447-471.
[9] LIU Hou-xiang, LI Ning, LIAO Xue. Effective stress analysis method of seismic response for high tailings dam[J]. Journal of Central South University of Technology, 2007, 14(1): 129-134.
[10] YANG Z, ELGAMAL A, ADALIER K, SHARP M K. Earth dam on liquefiable foundation and remediation: Numerical simulation of centrifuge experiments[J]. Journal of Engineering Mechanics, 2004, 130(10): 1168-1176.
[11] OKA F, YASHIMA A, TATEISHI A, YAMASHITA S. A cyclic elasto-plastic constitutive model for sand considering a plain-strain dependence of the shear modulus[J]. Geotechnique, 1999, 49(5): 661-680.
[12] OKA F, YASHIMA A, SHIBATA T, KATO M, UZUOKA R. FEM-FDM coupled liquefaction analysis of a porous soil using an elasto-plastic model[J]. Applied Scientific Research, 1994, 52(3): 209-245.
[13] SUGITO M, OKA F, YASHIMA A, FURUMOTO Y, YAMADA K. Time-dependent ground motion amplification characteristics at reclaimed land after the 1995 Hyogoken Nambu Earthquake[J]. Engineering Geology, 2000, 56(1/2): 137-150.
[14] HUANG Y, ZHANG F, YASHIMA A. Three-dimensional numerical simulation of pile-soil seismic interaction in saturated deposits with liquefiable sand and soft clay[C]//Proceedings (CD-ROM) of the Sixth World Congress on Computational Mechanics in conjunction with the Second Asian-Pacific Congress on Computational Mechanics. Beijing: Tsinghua University Press, 2004.
[15] HUANG Y, YASHIMA A, ZHANG F. Finite element analysis of pile-soil-structure dynamic interaction in liquefiable site[J]. Chinese Journal of Geotechnical Engineering, 2005, 27(6): 646-651. (in Chinese)
[16] HUANG Y, YASHIMA A, ZHANG F, YE W M. Numerical simulation of mitigation for liquefaction-induced soil deformations in a sandy ground improved by cement grouting[J]. Environmental Geology, 2008, 55(6):1247-1252.
[17] LEMAITRE J, CHABOCHE J L. Mechanics of solid materials[M]. Cambridge: Cambridge University Press, 1990.
[18] OKA F, KODAKA T, KIM Y S. A cyclic viscoelastic-viscoplastic constitutive model for clay and liquefaction analysis of multi-layered ground[J]. International Journal for Numerical and Analytical Methods in Geomechanics, 2004, 28(2): 131-179.
(Edited by CHEN Wei-ping)
Foundation item: Projects (40802070, 40841014) supported by the National Natural Science Foundation of China; Project (B308) supported by Shanghai Leading Academic Discipline Project, China
Received date: 2009-03-26; Accepted date: 2009-06-11
Corresponding author: HUANG Yu, Professor; Tel: +86-21-65982384; E-mail: yhuang@tongji.edu.cn

