Trans. Nonferrous Met. Soc. China 22(2012) s323-s328
Ultrasonic thickness measurement for aluminum alloy irregular surface parts based on spectral analysis
CONG Sen, GANG Tie
State Key Laboratory of Advanced Welding and Joining, Harbin Institute of Technology, Harbin 150001, China
Received 28 August 2012; accepted 25 October 2012
Abstract: Ultrasonic methods of measuring the thin thickness in a non-parallel irregular surface sample require quite a high time resolution of the detection device. Ultrasonic resonance method based on spectral analysis was used for accurate thickness measurement of this kind irregular aluminum alloy sample. Aiming at performing successive measurement of the thicknesses of different positions of one sample, non-contact detection mode was selected by using 20 MHz water immersion ultrasonic focused transducer and ultrasonic PAC testing system with 3D location device. Multiple resonant thickness algorithm was set up, so that the thickness value can be calculated by multiple resonant frequencies. In order to obtain the precise multiple resonant frequencies, in spectral analysis, surface wave in time domain signal needs to be removed and the appropriate window of time domain signal was selected. A high measurement accuracy of ±15 μm can be achieved using this method. In addition, the effect of the transducer location error was investigated and the allowed transducer offset ±500 μm was determined.
Key words: aluminum alloy; spectral analysis; ultrasonic resonance; thickness measurement; irregular surface
1 Introduction
Nondestructive detection technology is widely used in aviation, aerospace, industry and medical science [1-3]. Ultrasonic inspection and measurement have a great development, as an important nondestructive evaluation method, especially in nonlinear ultrasonic testing [4,5], ultrasonic phased array [6], and signal and image processing [7]. Ultrasonic measurement methods of thickness, distance and velocity have been studied for metals, composite materials and medical treatment of body structure [8-10], due to the advantages of low cost, flexible operation, simple device and high safety. Ultrasonic nondestructive thickness measurement includes primarily pulse-echo method, resonance method and lamb wave method [11,12]. In recent years, a variety of signal and image processing techniques for time and frequency domain have been applied for enhancing the accuracy of thickness measurement.
A wavelet-based processing method has been used for material thickness measurement [13]. The thickness of sample can be calculated simultaneously, requiring only a single acquisition in pure transmission mode to measure the time-of-flight of the wave propagation. Spectral analysis has been used for extracting the resonance frequency in a single thickness resonance mode [14], which obtains the thickness of electro- chemical hydrogen meter thimbles. There are also lots of studies on the thickness measurement of surface coating material in China [15-17].
However, the thickness measurement of the aluminum alloy curved surface parts is difficult to achieve by pulse-echo method, which is most popular for measuring regular parts based on the algorithm of time domain signal. When the thickness of parts is less than 1 mm, the time interval between pulse echoes is very short, especially for the aluminum alloy parts, because the acoustic velocity of aluminum alloy is relatively high. In this case, determining precisely the time interval of pulse echoes in time domain signal requires quite a high time resolution of transducer and relevant device due to the overlap of successive bottom echoes. Therefore, it is very difficult to perform the thickness measurement of thin-wall parts using this method, taking into account the available device.
Ultrasonic resonance method based on spectral analysis overcomes the difficulty of distinguishing the bottom echoes in time domain, which calculate the thickness value in terms of resonant frequencies. In spectral analysis, surface echo has very high amplitude comparing with bottom echoes because of the energy attenuation in acoustic wave propagation, so that the resonant information from deep regions of specimen in frequency domain is minimized. Therefore, in this work the suitable window of time domain signal was selected in signal processing, in order to obtain the accurate resonant frequencies.
An accuracy of ±15 μm was achieved for thickness measuring of the non-parallel curved surface specimen with the thickness less than 1 mm using this method. Moreover, concerning the transducer offset generated by mechanical vibration in actual application, the influence of transducer location error on measuring results was also presented.
2 Thickness measurement theory of ultrasonic resonance method
Ultrasonic resonance method is usually used to measure thin wall specimens. In the actual testing, the minimum thickness which can be measured depends on the biggest detection frequency that can be reached. For instance, under the condition of 25 MHz frequency, the resonance method can be used for testing the thickness small to 0.127 mm of steel or aluminum.
Measuring principle of the ultrasonic resonance is making the incident acoustic beam vertical to sheet. Ultrasonic wave in the sheet will reflect repeatedly between the two surfaces. Changing ultrasonic wave frequency, when the sheet thickness d is equal to integer times of half-wavelength of ultrasonic wave (d=nλ/2, n is integer, λ is the wavelength of ultrasonic wave in specimen), standing wave and resonance will occur in the direction of thickness in sheet. The resonance frequency fn can be expressed as  , where cl is the velocity of ultrasonic wave. So,
  can be obtained. When n=1, fn=f1 is referred to as fundamental frequency, and
  .
.
By above equations, we can obtain:
 (1)
(1)
Thus, when the two adjacent resonance frequencies are determined, the thickness value can be calculated according to the following equation:
 (2)
(2)
In experiment, the A-scan signal which carries the corresponding resonance information is extracted by digitization ultrasonic detection system. By appropriate signal processing for it, the resonant frequencies can be obtained from frequency domain. They are f1, …, fn, …, fm correlated with multiple resonance peaks as shown in Fig. 1.
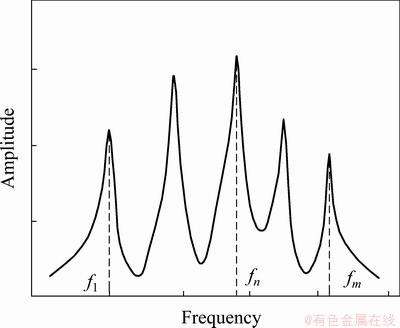
Fig. 1 Schematic representation of frequency spectrum of ultrasonic resonance thickness measurement
In this work, the frequency spectrum was obtained by fast Fourier transform (FFT) for time domain waveform. For improving the measurement accuracy, generally, the mean difference of multiple resonant frequencies is substituted into Eq. (2), so the thickness d can be expressed as
 (3)
(3)
where △f is the frequency mean difference.
3 Experimental
3.1 Specimens and detecting system
This experiment tested two aluminum alloy samples with different shapes. Figure 2 shows the part drawing of the two specimens. The first one is generally tiered plate structure, and the actual thickness values of three areas are 0.47, 0.77, 0.97 mm, respectively. In experiment, the thickness of three parts was tested separately so as to determine the measurement accuracy of ultrasonic resonance method for plates. The second one is non- uniform thickness curved surface specimens, with the thickness of 0.45 mm on one side and 0.65 mm on the other side of arc curved surface lowest point. Especially, the thickness on the arc region of specimen increases linearly from one side to the other side along axis y. In testing, several points of specimen were selected to measure successively. The three coordinate axis directions of the specimen are shown in Fig. 2(b).
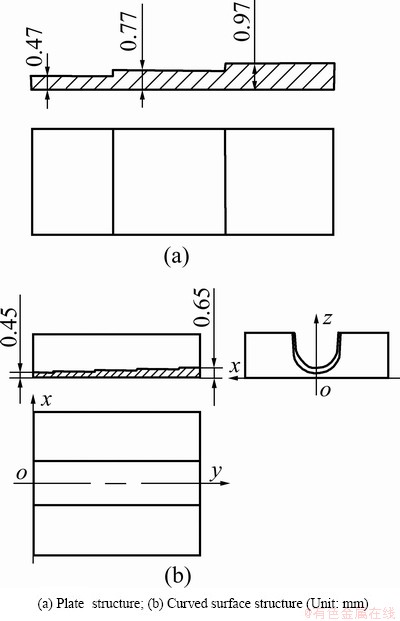
Fig. 2 Schematic representation of specimen structure

Fig. 3 Schematic representation of ultrasonic thickness measurement system
Figure 3 shows the ultrasonic thickness measurement system. This system consists primarily of ultrasonic testing instrument and stepping device. The testing instrument is physical acoustics C-scan (PAC) automatic detection system. The ultrasonic immersion point focused transducer was selected with the center frequency of 20 MHz and the focal length of 38.1 mm, using water as a couple medium. The digitization sampling frequency was 100 MHz. In order to reach the resonance in thickness direction of the specimen, the ultrasonic incident wave was perpendicular to the water/sample interface, in the case where the sample was fixed in water tank. The vertical incidence can make the ultrasonic wave energy in material high enough to generate the multiple reflections between the top and bottom surfaces of specimen. Aiming at successive detection, the 3D stepping device can carry the transducer scanning linearly in a specified direction and locating at measuring points. The signal processing was implemented on a personal computer.
3.2 Experiment procedure
1) For the aluminum alloy tiered plate, three different thickness regions were detected with the system gain 30 dB, and three points at least in each region were selected to measure in order to enhance the reliability of experiment. The window width of the acquired time domain signal was 2 μs, corresponding to every measuring point.
2) For arc curved surface sample, the measuring points of interest spread on the centre line of curved surface along axis y, and the corresponding positions are shown in Fig. 4. The three coordinate axis directions of specimen are defined as axes x, y and z.
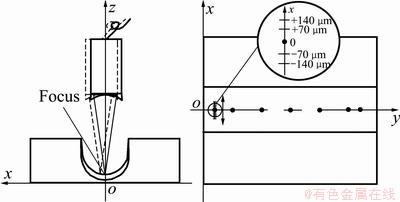
Fig. 4 Schematic representation of measuring position of curved surface specimen
In experiment, the linear scanning and accurate location were carried out using the focused transducer which was fixed in 3D stepping system. The transducer was removed along axis y, focusing on the center line of curved surface of specimen, in order to test the points along axis y. The water path was 38 mm in terms of the transducer focal length. In the following section, other than scanning along axis y, the transducer was also moved towards both sides of centre point along axis x in a step length of 70 μm, so as to determine measuring values under the different transducer offsets. The aim of this procedure is to analyze the influence of transducer location error on measuring result, thus providing some parameter guidance for practical measuring. The A-scan signal corresponding to each measuring point in Fig. 4 needed to be acquired for signal processing. At last, the thickness values were calculated in terms of resonant algorithm.
4 Results and discussion
4.1 Window selection of time domain
Through above experiments, the typical A-scan signal of testing point for spectral analysis is shown in Fig. 5(a). The A-scan signal is composed of the top surface echo and multiple backwall echoes. It can be clearly seen that the amplitude of surface echo is higher than that of the backwall echoes, owing to the energy attenuation of ultrasonic wave propagation in material. Moreover, because the thickness of specimen is so small and the acoustic velocity in aluminum is so fast that the time internal between pulse echoes is very short, the top surface echo overlaps with the backwall echoes. Further, the resonance occurs between the top and bottom surfaces of specimen in the processing of multiple reflection. The multiple resonant harmonic waves and multiple backwall echoes overlap together. Consequently, the top surface echo has significant influence on the frequency spectrum, as shown in Fig. 5(b) corresponding to the whole time domain waveform in Fig. 5(a). In Fig. 5(b), the resonance peak frequencies cannot be identified distinctly. Obviously, the top surface echo needs to be removed in signal processing, for the purpose of obtaining the pure resonance frequency spectrum.
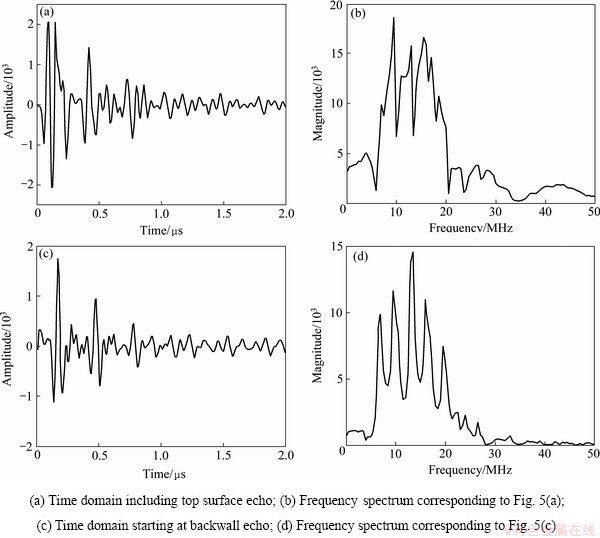
Fig. 5 Influence of time domain signal on resonance frequency spectrum
In this work, removing the top surface echo was performed by A-scan signal extraction program. The data carrying the surface echo information was cut off in signal processing. The window of time domain for FFT began with the first backwall echo as shown in Fig. 5(c). In this case, the accurate multiple resonance frequencies can be extracted by above processing. Five resonance frequencies (f1, f2, …, f5) can be clearly read from the amplitude spectrum in Fig. 5(d). According to Eq. (3), the multiple resonance frequencies were substituted into it, the relevant thickness value can be acquired:
 (4)
(4)
4.2 Results of thickness measurement
Table 1 shows the actual values and the calculation values of thickness. Measuring points 1-3 are corresponding to the three different thickness areas of tiered plate in Fig. 2, respectively. The thickness value of aluminum alloy sheet was calculated by above methods including spectral analysis and resonant algorithm. In Table 1, the calculation value corresponding to each measuring point was obtained through repeatedly measuring. It is obvious that the calculated thickness values are coincident with the actual values well, with the accuracy of ±5 μm, the relative error of less than 1%.
Hence, the ultrasonic resonance thickness measurement method can determine precisely the thickness of metal sheet. Sheet measurement provided a good guidance for further measuring the curved surface specimen.
Table 1 Measuring value and actual value of aluminum alloy sheet

Based on the above sheet measuring, the thickness of the aluminum alloy curved surface specimen was measured, in order to estimate the availability of ultrasonic resonant method based on spectral analysis for measuring successively non-parallel parts. For this purpose, in experiment, a linear scanning was carried out along axis y with the centre line of curved surface shown in Fig. 4. Those A-scan signals were collected simultaneously correlated with each testing point along axis y. The resonant peaks were very clear so that the relevant resonance frequencies were read precisely in spectral analysis. Substituting the resonant frequencies into Eq. (4), each thickness value calculated can be obtained. Figure 6 shows the comparison between the actual value and the measured value.

Fig. 6 Comparison of measured thickness value and actual value of curved surface specimen
It can be clearly seen that the measured values are very close to the actual values with a measuring accuracy of less than ±15 μm for the thin thickness curved surface specimen. The results validate that ultrasonic resonance method based on spectral analysis can effectively measure the thickness of non-parallel surface parts. Simultaneously, high frequency immersion focusing transducer is also very suitable for measurement of this kind with irregular surface which is difficult to be performed using contact detection method.
4.3 Effect of transducer lateral displacement
In actual application, the non-contact ultrasonic immersion detection method has a high requirement for detecting equipment. The transducer fixed in 3D stepping device easily shakes during linear scanning due to the device vibration and artificial operation error. Therefore, concerning the transducer offset, a certain location error arises to some extent. The location error has an influencing on measuring results. However, it is an important influence factor for non-contact detection to locate accurately at measuring region of specimen in experiment. On the one hand, the echo signal amplitude from the centre line of curved surface is the highest in comparison with the other positions. The incidence acoustic beam is perpendicular to the water/sample interface, when the transducer focuses on centre line of curved surface. Otherwise, the incidence acoustic beam will be in a certain slant angle with the surface of sample and thus lead to serious energy attenuation, because of the deflection and scattering of incidence acoustic beam. It is serious effect on the generation of multiple resonances in specimen. On the other hand, the signal amplitude can be judged by visualization detecting equipment accurately. The transducer moving is controlled by 3D stepping device in a very small step length. So, precise positioning can be achieved by above methods.
For the purpose of determining the effects of transducer location error on measuring result, in experiment, the transducer was moved in a step 70 μm along axis x on both sides of measuring point as shown in Fig. 4. During scanning along axis x, the echo signal amplitude read in computer was very low when the offset exceeded ±500 μm. The transducer offsets were controlled in the range of ±840 μm. Then, the thickness values under different transducer offsets were obtained by resonance method. Figure 7 shows the influence of transducer offset on the measuring results.
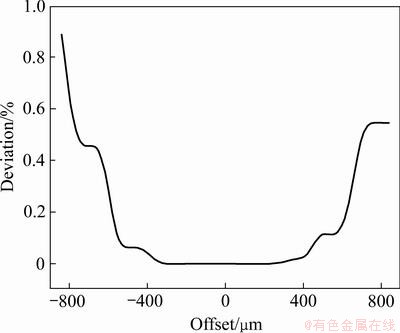
Fig. 7 Comparison of deviation in transducer offset
The horizontal axis in Fig. 7 indicates the transducer displacement along axis x, and the vertical axis stands for the deviation of skewing point compared with the measuring value of centre point. It indicates that the deviation value is lower than 0.1% when the offset is between ±500 μm, and the measurement value nearly coincides with the one in central point when the offset is between ±300 μm. There is quite a big deviation value in the case of the offset more than ±500 μm.
Consequently, through above analysis, the allowed location error of device can be determined in actual application according to the actual accuracy requirement offered.
5 Conclusions
1) The ultrasonic resonance method based on spectral analysis has successfully achieved thickness measurement of the arc curved surface specimen. In spectral analysis, resonant frequencies can be obtained by removing surface echo.
2) The thickness value can be calculated accurately by resonant algorithm based on spectral analysis. An accuracy of ±15 μm can be obtained.
3) The transducer location error influence on measuring results has been analyzed. The measuring deviation is small in the case of the transducer offset between ±500 μm. In actual application, the location error allowed can be ascertained according to specific requirement based on above analysis.
References
[1] VERTESY G, TOMAS I, UCHIMOIO T, TAKAGI T. Nondestructive investigation of wall thinning in layered ferromagnetic material by magnetic adaptive testing [J]. NDT & E International, 2012, 47(4): 51-55.
[2] KEENAN S T, ROMANS E J. Compensated high temperature SQUID gradiometer for mobile NDE in magnetically noisy environments [J]. NDT & E International, 2012, 47(4): 1-6.
[3] XIONG Er-gang, WANG She-liang, ZHANG Jun-feng, ZHANG Qian. Experimental study on magnetomechanical coupling effect of Q235 steel tubular member specimens [J]. Transactions of Nonferrous Metals Society of China, 2009, 19(s3): s616-s621
[4] GAO Gui-li, LI Da-yong, SHI De-quan, DONG Jin-wei. Identification of fatigue cracks in aluminum alloy plates based on nonlinear ultrasonic modulation spectrum [J]. Transactions of Nonferrous Metals Society of China, 2011, 21(4): 727-732.
[5] JHANG K Y. Nonlinear ultrasonic techniques for nondestructive assessment of micro damage in material: A review [J]. International Journal of Precision Engineering and Manufacture, 2009, 10(1): 123-135.
[6] WANG Fu-xi, ZHOU Xiao-feng, E Nan, LI Bin. Application of phased array ultrasonic testing technology on inspection of titanium thick welds [J]. The Chinese Journal of Nonferrous Metals, 2010, 20(s1): s964-s966.
[7] LOOSVELT M, LASAYGUES P. A wavelet-based processing method for simultaneously determining ultrasonic velocity and material thickness [J]. Ultrasonics, 2011, 51(3): 325-339.
[8] TRAN D H, DERIBLE S, FRANKLIN H, BANAMAR A, WANG H. Ultrasonic measurements of particle retention by a porous medium [J]. Ultrasonics, 2012, 52(1): 62-68.
[9] LI Ji-cheng, LIN Li, LI Xi-meng. Ultrasonic characterization of modified Cr2O3 coatings by reflection coefficient spectroscopy [J]. Transactions of Nonferrous Metals Society of China, 2010, 20(3): 418-424.
[10] TRETBAR S H, PLINKERT P K, FEDERSPIL P A. Accuracy of ultrasound measurements for skull bone thickness using coded signals [J]. IEEE Transactions on Biomedical Engineering, 2009, 56(3): 733-739.
[11] DIXON S, EDWARDS C, PALMER S B. High accuracy non-contact ultrasonic thickness gauging of aluminum sheet using electromagnetic acoustic transducers [J]. Ultrasonics, 2001, 39(6): 445-453.
[12] JIANG G X, KATO H, YOSHIDA Y J, KOMAI T. Optimization of ultrasonic measurement of remelted zone thickness using backscattered waves [J]. NDT & E International, 2002, 35(4): 221-225.
[13] LOOSVELT M, LASAYGUES P. A wavelet-based processing method for simultaneously determining ultrasonic velocity and material thickness [J]. Ultrasonics, 2011, 51(3): 325-339.
[14] SHARMA G K, KUMAR A, RAJKUMAR K V. Ultrasonic spectral analysis methodology for thickness mapping of electrochemical hydrogen meter thimbles [J]. Materials Evaluation, 2007, 65(4): 417-422.
[15] ZHAO Y, LIN L, LI X M, LEI M K. Simultaneous determination of the coating thickness and its longitudinal velocity by ultrasonic nondestructive method [J]. NDT&E International, 2010, 43(7): 579-585.
[16] LI Xi-meng, LIN Li, XU Zhi-hui, LI Ming-kai. Thickness measurement approach for plasma sprayed coatings using ultrasonic testing [J]. Transactions of Nonferrous Metals Society of China, 2004, 43(7): 579-585.
[17] MAO Jie, WANG Xiao-min, KANG Guo-xuan, LI Ming-xuan. Analysis of the ultrasonic resonance test for a plate with a thin layer [J]. Acta Acustica, 2005, 30(2): 151-154.
基于超声频谱分析的铝合金曲面零件厚度测量
丛 森,刚 铁
哈尔滨工业大学 先进焊接与连接国家重点实验室,哈尔滨 150001
摘 要:由于超声方法测量低厚度非平行不规则表面试样时要求检测设备具有非常高的时间分辨力,因此,采用基于频谱分析的超声共振法来测量这种不规则的铝合金试样的厚度。为了实现连续测量,采用非接触检测模式,使用20 MHz水浸聚焦探头和带有定位装置的超声PAC检测系统,建立超声共振法的多次共振厚度算法表达式,通过多次共振频率计算出厚度值。为了得到准确的多次共振频率,在频谱分析中,需要去除时域信号中的表面回波,并且选择合适的窗口宽度。采用该方法可实现高达±15 μm的测量精度。除连续厚度测量外,还研究了探头定位误差对测量精度的影响,确定允许的探头偏移量为±500 μm。
关键词:铝合金;频谱分析;超声共振;厚度测量;不规则表面
(Edited by DENG Lü-xiang)
Foundation item: Projects (51175113, 51105033, 2007DFR70070) supported by the National Natural Science Foundation of China
Corresponding author: GANG Tie; Tel: +86-451-86413952; E-mail: gangt@hit.edu.cn
DOI: 10.1016/S1003-6326(12)61726-9

