显微组织对AA2050-T84铝锂合金拉伸性能的影响
来源期刊:中国有色金属学报(英文版)2021年第5期
论文作者:陆丁丁 李劲风 宁红 马鹏程 陈永来 张绪虎 张恺 李建梅 张瑞丰
文章页码:1189 - 1204
关键词:2050铝锂合金;拉伸性能;各向异性;析出相;织构
Key words:2050 Al-Li alloy; tensile properties; anisotropy; precipitate; texture
摘 要:从显微角度研究80 mm厚(t)2050铝锂合金板材在150 °C时效后显微组织对其拉伸性能的影响。采用扫描电子显微镜、光学显微镜、透射电子显微镜和X射线衍射仪对合金表层(t/6)、中间层(t/3)和中心层(t/2)进行观察。结果表明,合金晶界第二相、析出相和织构随厚度位置的变化而出现差异。在欠时效到峰时效过程中,该合金沿轧制方向的析出相强化效果高于沿垂直轧制方向,但对合金各向异性影响不显著。β织构导致的较高泰勒因子值以及晶间第二相是合金在t/2层沿轧制方向获得最高强度的主要原因。合金沿垂直轧制方向的泰勒因子值差别较小,这导致合金在不同厚度层有相同抗拉强度。
Abstract: The effect of microstructure evolution on the tensile properties of 2050 Al-Li alloy thick plate aged at 150 °C with 80 mm in thickness (t) was studied from a microstructural perspective. Scanning electron microscope, optical microscope, transmission electron microscope and X-ray diffractometer were used to explore the surface (t/6), interlayer (t/3) and center (t/2) thickness layer of this alloy. Results show that the secondary phases on grain boundaries, precipitates and textures vary depending on the thickness location. The precipitation strengthening has a stronger influence on the alloy along the rolling direction than the transverse direction from the under-aged to the peak-aging condition; however, its effect on the anisotropy is insignificant. The higher Taylor factor (M) value caused by stronger β fiber rolling textures and the intergranular phases is the main reason that leads to the highest strength at the t/2 position along the rolling direction. The M-value has a limited change at different thickness layers along the transverse direction, which causes the same tensile strength.
Trans. Nonferrous Met. Soc. China 31(2021) 1189-1204
Ding-ding LU1, Jin-feng LI1, Hong NING1, Peng-cheng MA2,Yong-lai CHEN2, Xu-hu ZHANG2, Kai ZHANG3, Jian-mei LI4, Rui-feng ZHANG1
1. School of Materials Science and Engineering, Central South University, Changsha 410083, China;
2. Aerospace Research Institute of Materials and Processing Technology, Beijing 100076, China;
3. Monash Centre for Additive Manufacturing, Monash University, Clayton 3800, Australia;
4. School of Chemistry and Chemical Engineering, Ningxia University, Yinchuan 750021, China
Received 27 May 2020; accepted 8 February 2021
Abstract: The effect of microstructure evolution on the tensile properties of 2050 Al-Li alloy thick plate aged at 150 °C with 80 mm in thickness (t) was studied from a microstructural perspective. Scanning electron microscope, optical microscope, transmission electron microscope and X-ray diffractometer were used to explore the surface (t/6), interlayer (t/3) and center (t/2) thickness layer of this alloy. Results show that the secondary phases on grain boundaries, precipitates and textures vary depending on the thickness location. The precipitation strengthening has a stronger influence on the alloy along the rolling direction than the transverse direction from the under-aged to the peak-aging condition; however, its effect on the anisotropy is insignificant. The higher Taylor factor (M) value caused by stronger β fiber rolling textures and the intergranular phases is the main reason that leads to the highest strength at the t/2 position along the rolling direction. The M-value has a limited change at different thickness layers along the transverse direction, which causes the same tensile strength.
Key words: 2050 Al-Li alloy; tensile properties; anisotropy; precipitate; texture
1 Introduction
Aluminum lithium alloys have been widely used in aerospace, transportation and other industries because of the low density, high strength and heat resistance stability [1]. As a typical third-generation Al-Li alloy, the 2050 Al-Li alloy has a low Li content, increasing the damage resistance and strength by reducing the coplanar slip caused by θ′ phase precipitation and the hydrogen embrittlement from excessive hydrogen absorption [2]. The 2050 Al-Li alloy thick plate combines the flaw resistance performance of 2xxx alloys and the ultra-high strength of 7xxx alloys. Compared with the 7xxx alloy thick plate, the 2050 Al-Li alloy thick plate has higher elastic modulus, better damage resistance and higher specific strength [1,3,4]. LEQUEU et al [5] suggested that an Al-Cu-Li thick plate has a better damage tolerance than a 7050-T7451 thick plate. WU et al [6] also found that the yield strength and ultimate tensile strength gradually increased from the surface layer to the center layer of an Al-Cu-Li plate with a final thickness of 90 mm. These uneven mechanical properties at different regions within thick plate dramatically restrict the application of 2050 Al-Li alloys.
The properties of 2050 Al-Li alloy can be affected by many factors like segregation in casting ingots, dissolution of secondary phases, recrystallization, hardenability and textures during plastic deformation [5,7]. Previous reports [8] indicated that the coarse secondary phases were observed in casting ingots and retained in subsequent heat treatment. It will result in stress concentration or crack, which reduces the plasticity, fracture toughness, fatigue properties and stress corrosion resistance [9]. Coarse precipitates and dispersoids significantly affect the microstructure refinement and corresponding strengthening in the particle-containing materials [10].
As a heat-treatable aluminum alloy, the 2050 Al-Li alloy achieves a high yield strength from precipitation strengthening. However, it is also the main factor that leads to the inhomogeneous properties of the material. This hypothesis has been verified from tremendous works by characterizing the number density, size and types of precipitates under various aging environments [11]. LIU et al [7] reported that the Zn and Mg concentration of grain boundary precipitates led to the disparity of corrosion resistance under different quenching rates. Additionally, SHU et al [12] found that the Mg/Zn ratio difference can alter the growth kinetics of the η′ phase distributed at the surface layer and central layer. Such a microstructure difference will cause distinct mechanical properties along the normal direction (ND) of 7055 thick plates. ZHAO et al [13] reported that the pitting corrosion behavior of 95 mm-thick 2297 Al-Li alloy was mainly ascribed to the distribution of the inhomogeneous precipitates.
Textures can also contribute to the inhomogeneous strength of thick plates. In contrast to the weak texture of the surface layer in an Al-Li-Cu-Zr alloy with a thickness (t) of 12 mm, the central part of this alloy presents a strong rolling texture [14]. It was also proposed that the texture disparity contributed to the discrepancy of tensile strength. Similarly, WU et al [6] reported that an Al-Li-Cu alloy had a random texture at the surface layer, originating from the greater recrystallization degree with cold deformation during the rolling process. The typical shear texture of R-Cube and strong β fiber rolling textures were found at the t/8 and t/2 (center) layers due to the weaker recrystallization driving force.
From the above mentioned results, it can be found that a strong anisotropy at different thickness layers on the mechanical properties is inevitable. SHE et al [12] investigated the influence of microstructure (center and edge) on the tensile properties along ND in aged 7055 aluminum alloy plate. They hypothesized that the anisotropy of tensile strength through ND could be mainly attributed to a strong β fiber rolling texture at the center layer.
Most Al-Li alloy thin plates were extensively studied by researchers [3,11]. However, few works have explored the inhomogeneity along ND of Al-Li thick plates. Further, the understanding of the inhomogeneous mechanical properties from a microstructural perspective is not completely clear. The 2050 Al-Li alloy thick plates may find potential applications for the aircraft industry for their excellent performance. Nevertheless, the inhomogeneous tensile properties along ND of 2050 Al-Li alloy thick plates may hinder their further application. This work aims to investigate the microstructure inhomogeneities and their effect on tensile properties of 2050 Al-Li alloy plates with a thickness of 80 mm. We focus on the factors such as secondary phases at grain boundaries, precipitates and rolling texture and their influences on the strength and ductility. The effects of the anisotropy on different layers will also be discussed in this work.
2 Experimental
2.1 Materials and procedures
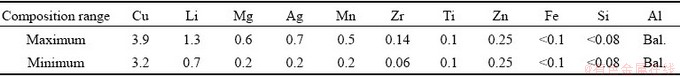
As-received 2050 Al-Li alloy plate with a thickness of ~80 mm in T3 condition was provided by Southwest Aluminum (Group) Co., Ltd. The detailed chemical composition is listed in Table 1. The samples were firstly solution heat-treated for 60 min at ~520 °C then water quenched to ~25 °C. After quenching, the samples were pre- deformed to a plastic strain of 4% and aged at 150 °C for different durations.
Table 1 Chemical composition of 2050 Al-Li alloy (wt.%)
2.2 Tensile test
The plate was cut into three equal layers from the surface to the center. The layers were spaced ~13 mm apart. The samples cut from these equal layers (the surface, the interlayer, the center) were designated as t/6, t/3 and t/2 positions, respectively. The tensile samples with a diameter of 8 mm and a length gauge of 48 mm were prepared from the aged plate with different thickness layers along the rolling direction (RD) and the transverse direction (TD). A schematic about sampling is shown in Fig. 1. Tensile testing was conducted on the MTS- 810 machine at ambient temperature with a strain rate of 0.01 s-1.
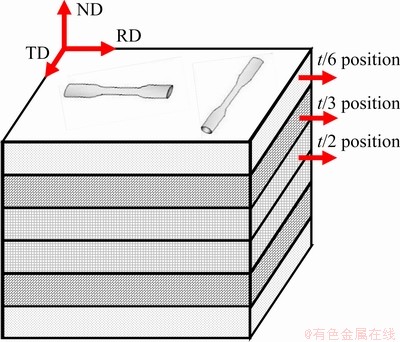
Fig. 1 Schematic diagram showing sample orientations and three thickness positions (t/6, t/3 and t/2 positions)
2.3 Microstructure characterization
The microstructures were characterized by optical microscope (OM, Leica Microsystems Wetzlar GmbH, Germany) and transmission electron microscope (TEM, FEI Tecnai G220) operated at 200 kV. The chemical composition of secondary particles was defined by scanning electron microscopy (SEM, Quanta 200) with energy- dispersive spectroscopy (EDS, GENE SIS60E). The SEM specimens along ND were ground, polished then etched in the Keller’s reagent for 10 s. The TEM specimens were prepared by cutting pieces with a thickness of 500 μm and carefully grinding them to a 80 μm-thick sheet. These thin pieces were subsequently punched into 3 mm-diameter disks. The disks were finally thinned by electro polisher in a solution containing 75% methanol and 25% nitric acid (volume fraction) at -40 to -25 °C.
X-ray diffraction (XRD, BruckerD8 Discovery) was carried out at 40 kV and 40 mA with Cu Kα radiation to determine the textures at different positions along ND. The samples with 12 mm (RD) × 12 mm (TD) × 3 mm (ND) taken from different layers along ND were prepared by electrical polishing. The incomplete pole figures in the three directions of {111}, {200} and {220} were measured. The three-dimensional orientation distribution functions (ODFs) were calculated by analysis software to obtain the relative volume fraction of texture components.
3 Results
3.1 Tensile properties
Typical engineering stress-strain curves of 2050 Al-Li alloy thick plate aged at 150 °C along RD and TD are shown in Fig. 2. Little serration is observed from the tensile curves. As shown in Figs. 2(a, c, e), the curves of specimens along RD demonstrate a stress decrease at high strains, which indicates the occurrence of nonuniform deformation and necking.
The ultimate tensile strength (UTS), yield strength (YS) and elongation (El) of 2050 Al-Li alloy aged plate at the three regions (along TD and RD) are shown in Fig. 3. Significantly inhomogeneous tensile properties appear at different thickness positions of the aged plate. The UTS and YS at the t/2 position along RD are 50 MPa higher than those at the other positions in all cases. Compared to the t/3 position, the difference between the UTS and the YS at the t/6 position is slightly over 10 MPa. The El at the t/2 position is lower than that at the t/6 and t/3 positions during all aging time.
Meanwhile, El has a stable value of around 10% after 30 h at different thickness positions. The UTS, YS and El at all regions along TD decrease. The YS at the t/6 and t/2 positions is similar after 30 h and that is 10 MPa higher than the t/3 position. The UTS at different thickness positions has a similar situation as the YS. The YS and UTS at the t/6 and t/3 positions along TD and RD have nearly the same values in all aging conditions. However, the strength at the t/2 position along TD is about 90% of that along RD. Notably, the alloy at the t/2 position exhibits severer anisotropy in strength than the other positions. The YS at the t/2 position along RD increases by about 8% from under-aged to peak-aging condition, while the YS at other positions increases by 10%. The YS at the t/3 position along TD has the highest increase (7.3%).
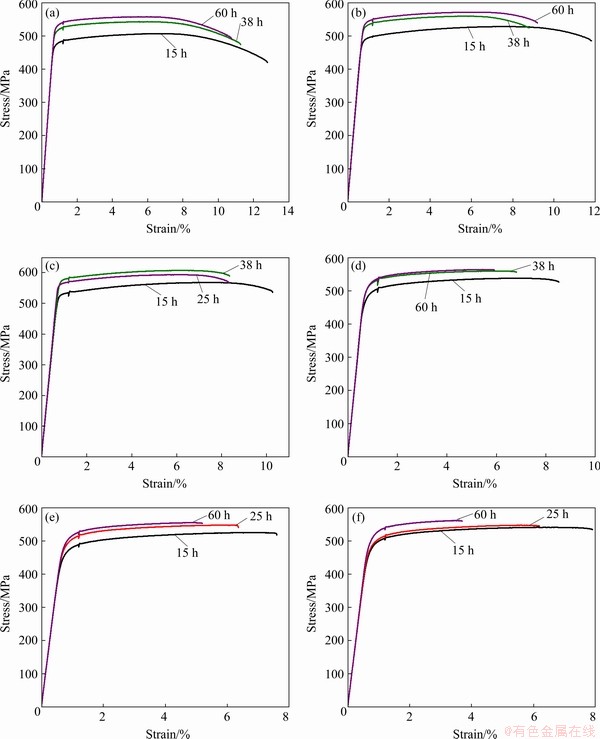
Fig. 2 Engineering stress-strain curves of 2050 Al-Li alloy thick plate aged at 150 °C along RD (a, c, e) and TD (b, d, f) at t/6 position (a, b), t/3 position (c, d), and t/2 position (e, f)
3.2 Microstructural inhomogeneities
Figure 4 shows the fractions of secondary phases at the grain boundaries (GBs) in 2050 Al-Li alloy thick plate at the three thickness positions. The main chemical compositions of coarse phases are Cu, Fe and Mn basing on EDS point analysis. Li is too light to be detected by EDS. The area fraction (fA), minimum diameter (Dmin), maximum diameter (Dmax) of these phases are quantitatively analyzed, as shown in Table 2. The area fraction of these coarse phases at the t/2 position (1.18%) is higher than that at the t/6 and t/3 position (0.76% and 0.87%).
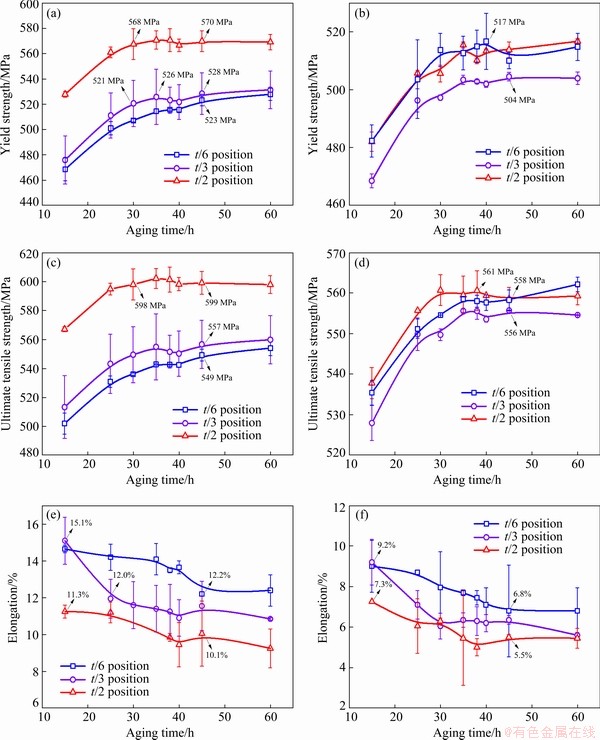
Fig. 3 YS (a, b), UTS (c, d) and El (e, f) of 2050 Al-Li alloy thick plate aged at 150 °C from three thickness positions along RD (a, c, e), and along TD (b, d, f)
Meanwhile, the Dmax of the secondary phases at the GBs at the t/2 position is the maximum. Secondary phases within grains at the t/2 position dissolve into the matrix after the solid-solution treatment, while some intergranular phases remain, as shown in Fig. 4(d). Figure 4 indicates that the phase number around GBs increases from surface to center, where the morphology of these phases turns from particle to lump.
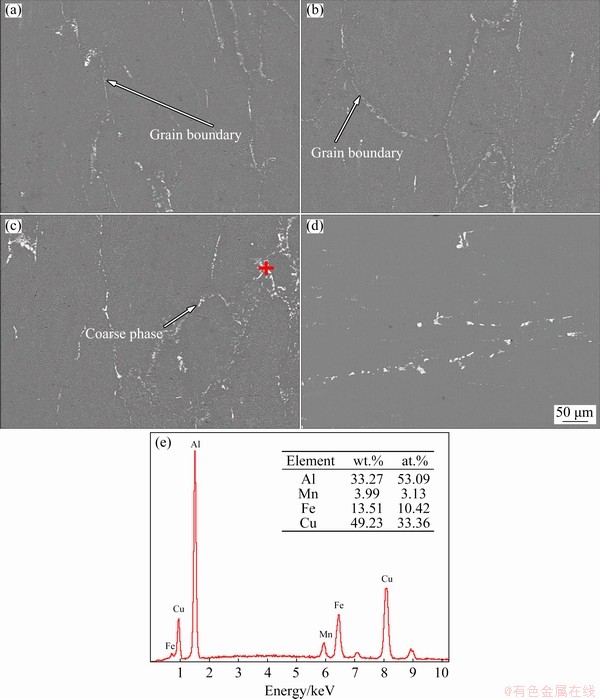
Fig. 4 SEM images of secondary phases in 2050 Al-Li alloy thick plate after hot rolling at t/6 position (a), t/3 position (b) and t/2 position (c), after solution treatment at t/2 position (d), and corresponding EDS analysis (e)
Table 2 Microstructural parameters of coarse phases at GBs in 2050 Al-Li alloy
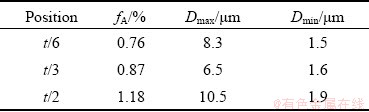
Figure 5 depicts the selected area diffraction patterns (SADPs) along the [112]α(Al) zone axis at t/6 position and the [001]α(Al) zone axis at t/3 position for 2050 Al-Li alloy aged at 150 °C for 30 h. The main strong diffraction spots come from the
α(Al) matrix. The weak sharp diffraction spots at 1/3{220}α(Al) and 2/3{220}α(Al) in the [112]α(Al) SADPs, marked with a red circle in Fig. 5, are sheet-like T1 (Al2CuLi) precipitates with a hexagonal close-packed lattice. Besides, the discontinuous lines passing through the {200}α(Al) and {110}α(Al) spots in the [001]α(Al) SADPs, marked with a white circle in Fig. 5, are sheet-like θ′(Al2Cu) precipitates with the tetragonal system. There are no strong diffraction spots of other phases in the SADPs, indicating that T1 and θ′ precipitates are the dominant precipitates within the grains. Figure 6 illustrates the bright field TEM image (BFs) of the 2050 Al-Li alloy thick plate aged at 150 °C for 15 h. Rod-like (A marked with red arrows) and equiaxed (B marked with black arrows) particles are observed at the t/2 position. T1 precipitates are found at the t/3 position, while the rod-like or equiaxed coarse particles are not observed, as shown in Fig. 6(b).
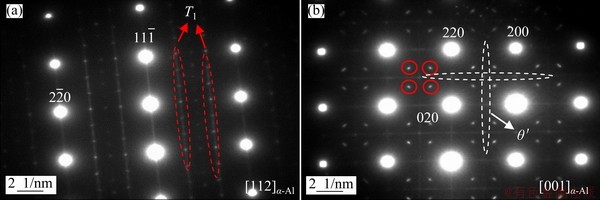
Fig. 5 Typical SADPs of 2050 Al-Li alloy aged at 150 °C for 30 h corresponding to [112]α(Al) (t/6 position) (a) and [001]α(Al) zone axis (t/3 position) (b)
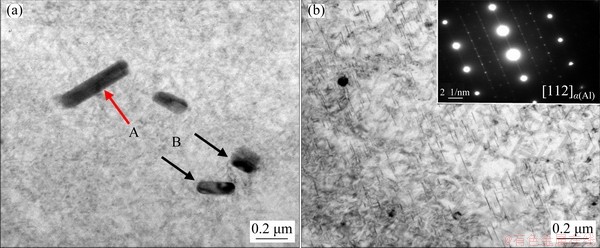
Fig. 6 TEM images of 2050 Al-Li alloy thick plate aged at 150 °C for 15 h from t/2 position (a) and t/3 position (b) in [112]α(Al) zone axis
Figure 7 shows the SADPs and dark field images (DFs) at the t/6, t/3 and t/2 positions along [112]α(Al) and [001]α(Al) zone axes inside the grains, where both T1 and θ′ precipitates are observed. It is known that the strength of heat- treated alloys is mainly determined by the types, size and number density of precipitates [10,15]. The sizes of T1 and θ′ precipitates were counted by the Image-Pro Plus software in the present work. Three photos were selected for statistics to ensure the accuracy of the data. The average diameters of T1 and θ′ precipitates at different regions were quantitatively measured.
The average diameter of T1 precipitates at the t/6 position (70.1 μm) is slightly less than that at the t/3 and t/2 positions (77.4 and 82.2 μm, respectively). There is a competitive relationship for the Cu atoms between T1 and θ′ precipitates in the Al-Li alloy during aging treatment [16]. The average diameter of θ′ precipitates at the t/3 position (99.6 μm) is higher than that at the t/6 and t/2 positions (75.6 and 77.5 μm, respectively). The result is supported by the histograms of diameter in precipitate from different thickness positions, as shown in Fig. 8.
3.3 Texture
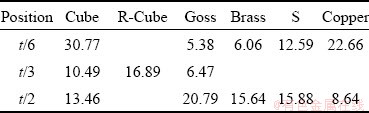
The ODF figures illustrate that textures of 2050 Al-Li alloy thick plate aged at 150 °C for 30 h are mainly the recrystallized texture (Goss {011}<001>, Cube {001}<100>), shear textures (Rotate-Cube {001}<110>), and β fiber rolling texture which aligns the three main texture components: Brass {011}<112>, S{123}<634> and Cu {112}<111>, as shown in Fig. 9. Their volume fractions at the three thickness positions are summarized in Table 3. Typical textures at the t/6 and t/2 positions are similar, including Brass, S, Cu, Cube and Goss. Cube (30.77%) and Cu (22.66%) at the t/6 position are greater than that in the t/2 position with 13.46% and 8.64%. The Cube, Goss and R-Cube dominate textures at the t/3 position, and the volume fraction of R-Cube has the maximum fraction 16.89%. The proportions of the recrystallized texture and β fiber rolling texture at the t/6 position are 36.2% and 41.3%, respectively, like the t/2 position (34.3% and 40.2%).
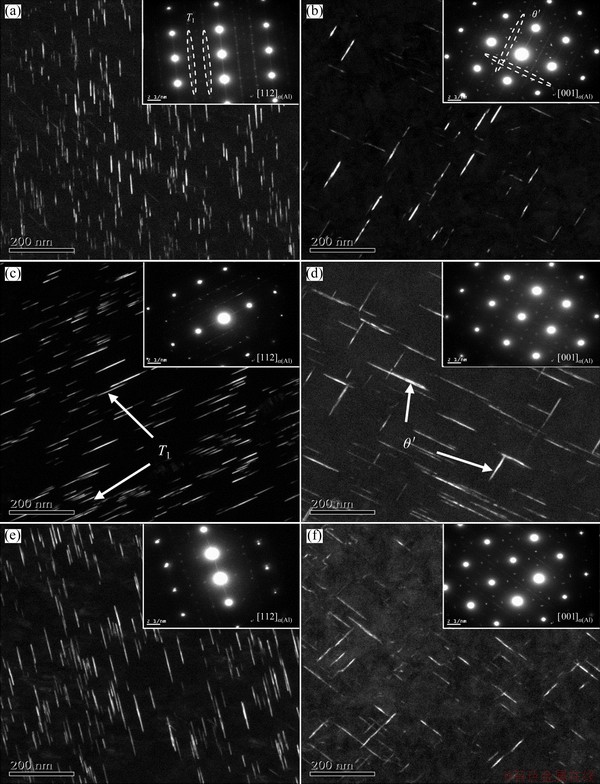
Fig. 7 TEM images of 2050 Al-Li alloy thick plate aged at 150 °C for 30 h along [112]α(Al) zone axis (a, c, e) and [001]α(Al) zone axis (b, d, f) at t/6 position (a, b), t/3 position (c, d), and t/2 position (e, f)
4 Discussion
4.1 Tensile properties and microstructures
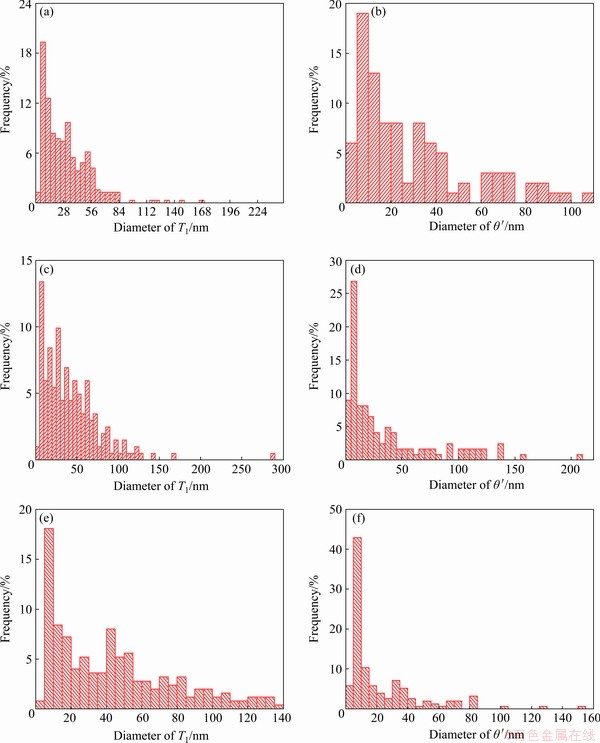
Fig. 8 Histograms of diameter in typical precipitates of 2050 Al-Li alloy thick plate aged at 150 °C for 30 h at t/6 position (a, b), t/3 position (c, d), and t/2 position (e, f)
Precipitation is the main parameter that affects the mechanical properties of aged 2050 Al-Li alloy. Equation (1) illustrates that the critical shear stress is primarily derived from the precipitates strengthening effect in the aging- hardening aluminum alloys. THOMAS et al [17] analyzed the equilibrium configurations of a dislocation interacting with random distributed unshearable fine-sized obstacles under applied stress. According to Eqs. (1)-(4), both T1 and θ′ precipitates can hinder the dislocation slip and improve the strength by the Orowan mechanism.
 (1)
(1)
 (2)
(2)
 (3)
(3)
 (4)
(4)
where τp is the critical resolved shear stress within the grain, G is the shear modulus, b is the Burgers vector component of the slip dislocation, υ is the poisson ratio, Dp is the average particle radius, Tp is the average particle thickness, f is the particle volume fraction, R0 is the radius of the dislocation nucleation zone and L0 is the mean distance between particles. The habit plane of T1 precipitates is {111} and that of θ′ precipitates is {100}, while the slip system of 2050 Al-Li alloys is {111}<110>. τp of precipitates at the habit plane of {111} is greater than that of {100}. The above equations indicate that the shear strain gradually increased with the average diameter and number density of precipitates. The interaction between dislocation and T1 precipitates consists of shearing and by-passing controlled by the thickness of T1 precipitates [17-20]. Meanwhile, a similar thickening evolution (an average T1 precipitate thickness less than 2 nm) in AA2050 alloy aged at 155 °C was reported [21]. The shearing mechanism is another strengthening method of T1 precipitates. The density and size of T1 precipitates have a significant effect on the strengthening of this alloy.
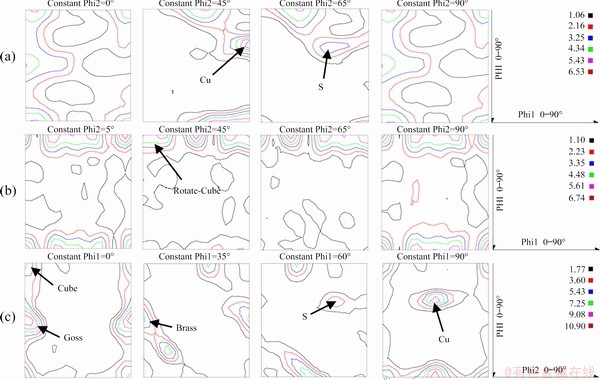
Fig. 9 ODFs of 2050 Al-Li alloy thick plate aged at 150 °C for 30 h at t/6 position (a), t/3 position (b), and t/2 position (c)
Table 3 Texture content at different thickness positions of 2050 Al-Li alloy aged at 150 °C for 30 h (vol.%)
The temperature distribution at different thicknesses will not be uniform during the hot rolling, which affects the solute diffusion rate, strain, dynamic recrystallization and precipitations [13,22]. It has been well acknowledged that solute atoms have low free energy at the GBs, enabling the segregation of solute atoms and then reducing the formation energies of GBs [23]. The strengthening effect of Cu solutes on GBs is forming new Cu-Al bonds that contribute to the grain boundary cohesion, thereby increasing GBs resistance against crack propagation [24]. Segregation of solute (Cu and Fe) around GBs was observed in Al-Li-alloy systems [25]. The Cu segregation at the t/2 position at the GBs is higher than that at other positions due to the higher diffusion rate. The entropy difference of Cu in the Al-matrix adjacent to GBs during hot rolling will affect the feature of subsequent precipitates during aging treatment. Most alloying elements in specimens, like Cu and Mn, dissolve into the Al matrix due to the high solidification rate [1]. This phenomenon explains the solute elements retained around GBs by forming the Cu-rich and Fe-rich phases (as shown in Fig. 4). The strengthening effect of GBs at the t/2 position is remarkable as the segregation of Cu/Fe and can significantly increase the fracture energy. The enrichment in Cu is not associated with an appreciable enrichment in Li [26]. In an Al-Cu-Li alloy, the rapid segregation of Li around GBs was reported in underaged conditions [27]. Hence, the segregation of Li around GBs can not be ignored in this alloy.
LI et al [1] reported that the 2050 Al-Li alloy has a “hardenability” which is different from the classical definition for steel. The Cu-rich secondary phases at GBs and lenticular-shaped Cu-containing secondary phases have more significant differences due to the distance away from the quenching end [1]. The Cu-enriched secondary phases around GBs are formed during the quenching process by taking Cu atoms away from the matrix, which results in a restricted growth of T1 precipitates within grains during the aging treatment. Two particles (A and B in Fig. 6(a)) at the t/2 position have similar morphologies of those secondary phases reported by LI et al [1]. This result implies that the concentration of Cu in the Al-matrix of this alloy from the t/2 position is lower than that of the location near the quenching end due to the formation of those Cu-rich phases. The solid solubility of solute atoms in the Al-matrix from the t/6 position is remarkable due to the higher quenching rate, contributing to the precipitation during aging.
The slip system can activate easily with a higher Schmid factor (SF) that causes decreasing dislocation density by cross-slip and lower deformation within grains under a given load [28,29]. SFs of the tested alloy along RD and TD in {111}<110> were calculated by the Orientation software, as shown in Tables 4 and 5. According to Tables 3-5, the weighted average SFs at the t/6, t/3 and t/2 positions along RD in {111}<110> are 0.237, 0.285 and 0.246 respectively, which are higher than those along TD (0.227, 0.276 and 0.210). The average SF at the t/6 and t/2 positions along RD in {111}<110> is almost the same. The dislocation density is supposed to have a minimal difference between the t/6 and t/2 positions after 4% pre-deformation along RD. During the pre-deformation at the t/3 position, the dislocation density yielded is lower due to the lowest SF value. Many works indicated that the stress field around the dislocation promotes the diffusion of Cu and also reduces the energy required for the T1 precipitates nucleation [30]. The dislocations caused by the plastic deformation before aging can be treated as the ideal position for the T1 precipitates nucleation [19]. The difference in the dislocation density and the concentration of Cu atoms from different thicknesses can dramatically alter microstructures. As a result, the number density of T1 precipitates at t/6 and t/2 positions is higher than that at the t/3 position. A higher diameter of T1 precipitates at the t/2 position was also observed. Minor lattice misfits between precipitate and matrix exist along other directions perpendicular to the elongation direction, making the corresponding interfaces around the precipitates [19,31]. The strain field provides an effective impediment against dislocation movement, thus helps to strengthen the materials. Larger precipitates have a better effect on the strength due to the increasing strain field caused by the lattice misfit between the precipitate and matrix. The number density of T1 precipitates may cause the precipitation strengthening at the t/2 position along RD is less than that at the t/6 position. Previous reports [32] suggested that the strength anisotropy may be controlled by the volume fraction of T1 precipitates related to the {111} fiber texture intensity. The interaction between dislocations and precipitates is different at different grain orientations when loaded in a confirmed direction, which causes that the precipitation strengthening in specimens along RD is higher than that along TD. Nonetheless, the effect of precipitation in anisotropy is not significant, as shown in Fig. 3.
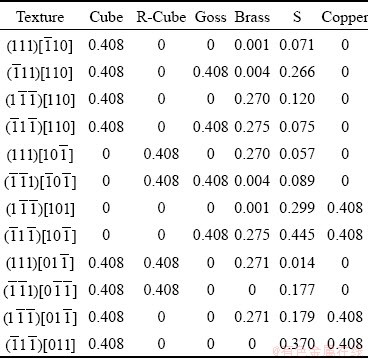
Table 4 Schmid factors of typical texture in {111}<110> along RD of 2050 Al-Li alloy thick plate aged at 150 °C for 30 h
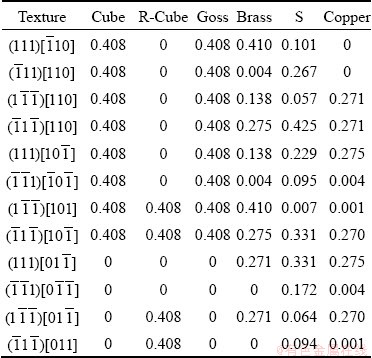
Table 5 Schmid factors of typical texture in {111}<110> along TD of 2050 Al-Li alloy thick plate aged at 150 °C for 30 h
The secondary phases around GBs hinder the occurrence of slip transfer, which contributes to the higher tensile strength of alloys [1]. However, these phases around GBs are brittle and incoherent, resulting in the formation and growth of cracks under the critical stress [33]. The failure of macrocracks extended into the soft matrix results in decreasing ductility [12]. The residual phases around GBs with a decreasing cooling rate on solidification and hot rolling process result in the strength increase. However, the ductility decreases from the t/6 position to the t/2 position. The segregation of Li and Cu contributes to the precipitation of T1 and θ′ during the aging treatment, which also causes the increase of strength and the decrease of ductility. The higher grain boundary density is the reason causing the greater strength along TD than that along RD. It suggests that the grain boundary strengthening is one of the factors that influence the anisotropy in strength.
A schematic provides the crack propagation path of 2050 Al-Li alloy, as shown in Fig. 10. When loaded along TD, the crack gathers and expands along GBs, and its propagation direction is difficult to change. Besides, the grains are easy to be elongated along RD by plastic deformation, which results in the necking and the deteriorated mechanical properties later. As shown in Fig. 11, the fracture morphologies of 2050 Al-Li alloy thick plate artificially aged at 150 °C for 30 h after the tensile test support this result. At the same time, many rough dimples are found within grains. The dimples number and the GBs density in the alloy along RD are higher than those along TD, which means that the elongation at three different positions along TD is lower than that along RD.
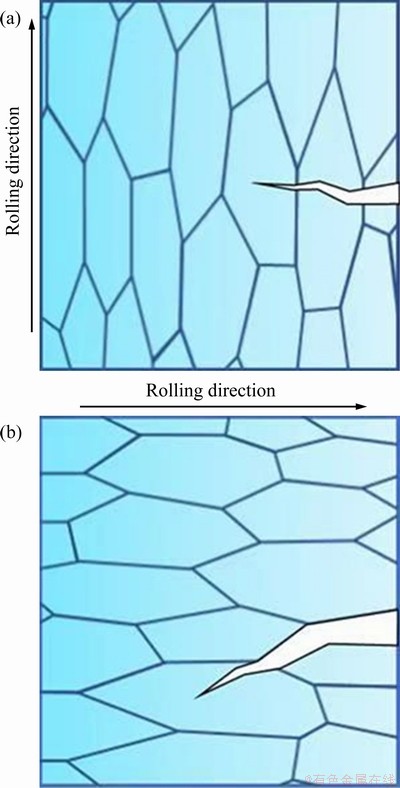
Fig. 10 Crack propagation path of 2050 Al-Li alloy thick plate under loading along RD (a) and TD (b)
4.2 Texture analysis
It should be noticed that the textures have minimal differences during the various aging conditions [34], which means that the textures of this alloy formed in the hot rolling and solution treatment. The deformation parameters of temperature and strain in hot rolling affect the microstructures of Al-Li alloy at different thickness positions [35,36]. The interface between the alloy plate and the roller during the hot rolling process resulted in a remarkable temperature drop at the t/6 position (the surface vicinity). While the temperature increases because of the heat generated by the plastic deformations at the t/2 position [37]. Each variable leads to the temperature gradually decreasing in this alloy from the t/6 position to the t/2 position. However, the hot deformation gradually decreases from the t/6 position to the t/2 position because of the redundant shear strains. The shear strain caused by the friction between the roller and the plate surface is produced at the t/6 position at the relatively low deformation temperature. The plastic deformation occurs easily at the t/2 position due to the high deformation temperature. The shear strain rises to a high value at the t/3 position after the hot rolling due to the uneven deformation between the t/6 and t/2 positions and that is the main reason for the high shear textures at the t/3 position. A high strain and a low deformation temperature at the t/6 position during the hot rolling process lead to the increasing deformed substructure [38]. These substructure results in the stored energy at the t/6 position are higher than those at the other positions. The nucleation and growth of recrystallized grains have a preferred orientation, which affects the formation and transformation of textures after recrystallization. The high grain stored energy at the t/6 position will increase the driving force for recovery and recrystallization, which results in recrystallized textures. Generally, the uniaxially deformed fcc metals with high stacking-fault energy present the <111> fiber texture distribution [32]. Some β fiber rolling texture remains at the t/6 position under intense deformation. The grain stored energy at the t/2 position is lower than that at the t/6 position after the hot rolling. However, dynamic recrystallization occurs in the alloy under suitable hot deformation environments, resulting in large amounts of recrystallized textures. It should be noted that the β fiber rolling textures also remain at the t/2 position.
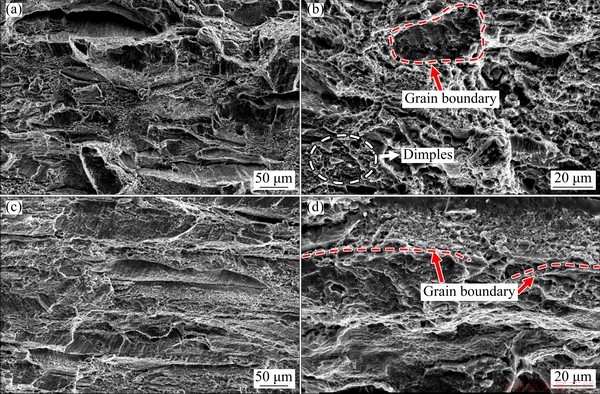
Fig. 11 SEM images of 2050 Al-Li alloy thick plate artificially aged at 150 °C for 30 h after tensile test under loading along RD (a, b) and TD (c, d)
A slip system can be activated if the resolved shear stress applied to material is higher than the critical resolved shear stress of this slip system [39]. SFs can be used to describe the difficulty of material deformation. The slip system has the highest significant possibility to be activated with the highest SF [30]. Taylor factor (M) depends on the texture and the orientation of the tensile axis relative to the worked specimens main axes and has an effective relationship with the SF value [39,40]. Based on the texture analysis, the average M at different thicknesses of the 2050 Al-Li alloy thick plate aged at 150 °C for 30 h is shown in Fig. 12. The crystallographic texture is the main factor of the macroscopic anisotropy of aluminum alloy plates. The Brass texture is a characteristic of alloys with lithium and has the highest anisotropy of Al-Li alloy properties, unlike the other aluminum alloys [34,41]. The alloys at the t/6 and t/2 positions have a higher M-value along RD than that at the t/3 position due to the β fiber rolling texture. The M-value is almost the same in the three different regions along TD. The correlation between anisotropy and the <100> texture is there but is not crucial as the correlation with the <111> fiber texture [32]. It suggests that the anisotropy of this alloy at the t/6 positions is the maximum due to the stronger copper rolling textures. However, the anisotropy on strength at the t/2 position is higher than that in the other thickness positions.
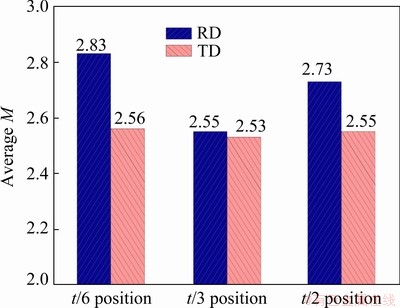
Fig. 12 Average Taylor factor of 2050 Al-Li alloy thick plate artificially aged at 150 °C for 30 h from three thickness positions
The yield strength (σy) of a polycrystalline metal can generally be described by [39]
σy=△σgb+Mτp (5)
where σgb is the strengthening due to (sub-)grain boundaries.
Although this alloy has a lower average M value at the t/2 positions along RD, the strengthening of GBs is another reason that causes the highest strength at the t/2 position. This alloy at the t/3 position along RD has a lower M-value than the t/6 position. However, the grain boundary strengthening at the t/3 position along RD is more significant than that at the t/6 position, which causes the same strength. When loaded along TD, the GBs will promote the propagation of cracks in the fracture process rather than crack deflection, which weakened the influence of GBs on the strength and ductility. Consequently, the strength in specimens at the different positions is the same along TD due to the equal M-value.
5 Conclusions
(1) Precipitation strengthening contributes to the increase in the strength of this alloy along RD from the under-aged to the peak-aging condition, and it is higher than that along TD at the same thickness position. Meanwhile, the effect of precipitation on the anisotropy is not significant.
(2) The 2050 Al-Li alloy plate has a higher M-value at the t/6 and t/2 positions along RD due to the stronger β fiber rolling textures. However, the M-value of this alloy along TD is almost the same at different positions.
(3) The strength and ductility at the t/2 position along RD are greater than those at the t/6 and t/3 positions due to the higher M-value and the grain boundary precipitates. When loaded along TD, the strength is the same at different thickness layers because of the equal M-value.
Acknowledgments
This work is supported by the National Natural Science Foundation of China (No. 51961034) and the Key Research and Development Program of Ningxia (No. 2018BEB04037), China.
References
[1] LI J F, LIU D Y, NING H, LIU C, MA P C, CHEN Y L, ZHANG X H. Experimental quantification of “hardenability” of 2195 and 2050 Al-Li alloys by using cold-rolled sheets [J]. Materials Characterization, 2018, 137: 180-188.
[2] WEI L L, PAN Q L, HUANG H F, FENG L, WANG Y L. Influence of grain structure and crystallographic orientation on fatigue crack propagation behavior of 7050 alloy thick plate [J]. International Journal of Fatigue, 2014, 66: 55-64.
[3] ZHU R H, LIU Q, LI J F, CHEN Y L, ZHANG X H, ZHENG Z Q. Flow curve correction and processing map of 2050 Al-Li alloy [J]. Transactions of Nonferrous Metals Society of China, 2018, 28(3): 404-414.
[4] GUERIN M, ALEXIS J, ANDRIEU E, BLANC C, ODEMER G. Corrosion-fatigue lifetime of aluminium- copper-lithium alloy 2050 in chloride solution [J]. Materials and Design, 2015, 87: 681-692.
[5] LEQUEU P, SMITH K P, DANIELOU A. Aluminum- copper-lithium alloy 2050 developed for medium to thick plate [J]. Journal of Materials Engineering and Performance, 2010, 19(6): 841-847.
[6] WU P F, DENG Y L, ZHANG J, FAN S T, ZHANG X M. The effect of inhomogeneous microstructures on strength and fatigue properties of an Al-Cu-Li thick plate [J]. Materials Science and Engineering A, 2018, 731: 1-11.
[7] LIU S D, ZHANG Y, LIU W J, DENG Y L, ZHANG X M. Effect of step-quenching on microstructure of aluminum alloy 7055 [J]. Transactions of Nonferrous Metals Society of China, 2010, 20(1): 1-6.
[8] LIU G, ZHANG G J, WANG R H, HU W, SUN J, CHEN K H. Heat treatment-modulated coupling effect of multi-scale second-phase particles on the ductile fracture of aged aluminum alloys [J]. Acta Materialia, 2007, 55(1): 273-284.
[9] ZHANG R F, LI J F, LI Q, QI Y S, ZENG Z R, QIU Y, CHEN X B, KAIRY S K, THOMAS S, BIRBILIS N. Analysing the degree of sensitisation in 5xxx series aluminium alloys using artificial neural networks: A tool for alloy design [J]. Corrosion Science, 2019, 150: 268-278.
[10] LI C, XIONG H Q, BHATTA L, WANG L, ZHANG Z Y, WANG H, KONG C, YU H L. Microstructure evolution and mechanical properties of Al-3.6Cu-1Li alloy via cryorolling and aging [J]. Transactions of Nonferrous Metals Society of China, 2020, 30(11): 2904-2914.
[11] WU W T, LIU Z Y, BAI S, LI F Y, LIU M, WANG A. Anisotropy in fatigue crack propagation behavior of Al-Cu-Li alloy thick plate [J]. Materials Characterization, 2017, 131: 440-449.
[12] SHE H, SHU D, WANG J, SUN B D. Influence of multi- microstructural alterations on tensile property inhomogeneity of 7055 aluminum alloy medium thick plate [J]. Materials Characterization, 2016, 113: 189-197.
[13] ZHAO K, LIU J H, YU M, LI S M. Through-thickness inhomogeneity of precipitate distribution and pitting corrosion behavior of Al-Li alloy thick plate [J]. Transactions of Nonferrous Metals Society of China, 2019, 29(9): 1793-1802.
[14] WANG D, GAO C, LUO H Y, YANG Y H, MA Y. Texture evolution behavior and anisotropy of 2A97 Al-Li alloy during recrystallization at elevated temperature [J]. Rare Metals, 2018: 1-11.
[15] TANG J G, YU B, ZHANG J, XU F S, BAO C J. Effects of pre-deformation mode and strain on creep aging bend-forming process of Al-Cu-Li alloy [J]. Transactions of Nonferrous Metals Society of China, 2020, 30(5): 1227-1237.
[16] LI J F, HUANG J L, LIU D Y, CHEN Y L, ZHANG X H, MA P C. Distribution and evolution of aging precipitates in Al-Cu-Li alloy with high Li concentration [J]. Transactions of Nonferrous Metals Society of China, 2019, 29(1): 15-24.
[17] THOMAS D, FREDERIC D G, WILLIAMS L, CHRISTOPHE S, ALEXIS D. Strengthening mechanisms of T1 precipitates and their influence on the plasticity of an Al-Cu-Li alloy [J]. Materials Science and Engineering A, 2014, 605: 119-126.
[18] LV K X, ZHU C Y, ZHENG J X, WANG X D, CHEN B. Precipitation of T1 phase in 2198 Al-Li alloy studied by atomic-resolution HAADF-STEM [J]. Journal of Materials Research, 2019, 34(20): 3535-3544.
[19] ZHAO T Z, JIN L, XU Y, ZHANG S H. Anisotropic yielding stress of 2198 Al-Li alloy sheet and mechanisms [J]. Materials Science and Engineering A, 2020,771: 138572.
[20] ZHU A W, STARKE E A. Strengthening effect of unshearable particles of finite size: A computer experimental study [J]. Acta Materialia, 1999, 47(11): 3263-3269.
[21] YAN Y, PEGUET L, GHARBI O, DESCHAMPS A, HUTCHINSON C R, KAIRY S K, BIRBILIS N. On the corrosion, electrochemistry and microstructure of Al-Cu-Li alloy AA2050 as a function of ageing [J]. Acta Materialia, 2018, 1: 25-36.
[22] MA Y L, LI J F, SANG F J, LI H Y, ZHENG Z Q, HUANG C. Grain structure and tensile property of Al-Li alloy sheet caused by different cold rolling reduction [J]. Transactions of Nonferrous Metals Society of China, 2019, 29(8): 1569-1582.
[23] FISCHER F, SCHMITZ G, EICH S M. A systematic study of grain boundary segregation and grain boundary formation energy using a new copper-nickel embedded-atom potential [J]. Acta Materialia, 2019, 176: 220-231.
[24] ZHAO D D, LOVVIK O M, MARTHINSEN K, LI Y J. Segregation of Mg, Cu and their effects on the strength of Al S5 (210)[001] symmetrical tilt grain boundary [J]. Acta Materialia, 2018, 145: 235-246.
[25] DU Y, CHANG Y A, HUANG B Y, GONG W P, JIN Z P, XU H H, YUAN Z H LIU Y, HE Y H, XIE F Y. Diffusion coefficients of some solutes in fcc and liquid Al: Critical evaluation and correlation [J]. Materials Science and Engineering A, 2003, 363(1-2): 140-151.
[26] OTT N, YAN Y M, RAMAMURTHY S, KAIRY S, BIRBILIS N. Auger electron spectroscopy analysis of grain boundary microchemistry in an Al-Cu-Li alloy [J]. Scripta Materialia, 2016, 119: 17-20.
[27] OTT N, KAIRY S K, YAN Y M, BIRBILIS N. Evolution of grain boundary precipitates in an Al-Cu-Li alloy during aging [J]. Metallurgical and Materials Transactions A, 2016, 48(1): 51-56.
[28] CHO K K, CHUNG Y H, LEE C W, KWUN S I, SHIN M C. Effects of grain shape and texture on the yield strength anisotropy of Al-Li alloy sheet [J]. Scripta Materialia, 1999, 40(6): 651-657.
[29] TAO X F, GAO Y K, KANG J M, WANG Y H. Softening effects induced by shot peening for an aluminum-lithium alloy [J]. Metallurgical and Materials Transactions A, 2020, 51(1): 410-418.
[30] KUMAR K S, BROWN S A, PICKENS J R. Effect of a prior stretch on the aging response of an Al-Cu-Li-Ag-Mg-Zr alloy [J]. Scripta Metallurgica et Materialia, 1990, 24(7): 1245-1250.
[31] ANDERSEN S J, ZANDBERGEN H W, JANSEN J, TRLHOLT C, TUNDAL U, REISO O. The crystal structure of the β″ phase in Al-Mg-Si alloys [J]. Acta Materialia, 1998, 46(9): 3283-3298.
[32] BOIS-BROCHU A, BLAIS C, GOMA F A T, LAROUCHE D, BOSELLI J, BROCHU M. Characterization of Al-Li 2099 extrusions and the influence of fiber texture on the anisotropy of static mechanical properties [J]. Materials Science and Engineering A, 2014, 597: 62-69.
[33] PASANG T, SYMONDS N, MOUTSOS S, WANHILL R J H, LYNCH S P. Low-energy intergranular fracture in Al-Li alloys [J]. Engineering Failure Analysis, 2012, 22: 166-178.
[34] BETSOFEN S Y, ANTIPOV V V, KNYAZEV M I, OGLODKOV M S. Effect of heat treatment on the phase composition, the texture, and the mechanical properties of a V1461 (Al-Cu-Li) alloy [J]. Russian Metallurgy, 2015, 2015(11): 929-936.
[35] MEDJAHED A, MOULA H, ZEGAOUI A, DERRADJI M, HENNICHE A, WU R Z, HOU L G, ZHANG J H, ZHANG M L. Influence of the rolling direction on the microstructure, mechanical, anisotropy and gamma rays shielding properties of an Al-Cu-Li-Mg-X alloy [J]. Materials Science and Engineering A, 2018, 732: 129-137.
[36] EXAMILIOTI T N, KLUSEMANN B, KASHAEV N, RIEKEHR S, ENZ J, ALEXOPOULOS N D. Anisotropy and size effect in tensile mechanical properties of Al-Cu-Li 2198 alloy [J]. Procedia Structural Integrity, 2017, 5: 13-18.
[37] MAGALHaES D C C, KLIAUGA A M, FERRANTE M, SORDI V L. Asymmetric cryorolling of AA6061 Al alloy: Strain distribution, texture and age hardening behavior [J]. Materials Science and Engineering A, 2018, 736: 53-60.
[38] SELLARS C M, ZHU Q. Microstructural modeling of aluminum alloys during thermomechanical processing [J]. Materials Science and Engineering A, 2000, 280(1): 1-7.
[39] STARINK M J, WANG S C. A model for the yield strength of overaged Al-Zn-Mg-Cu alloys [J]. Acta Materialia, 2003, 51(17): 5131-5150.
[40] ZHANG K, HOLMEDAL B, MANIK T, SAAI A. Assessment of advanced Taylor models, the Taylor factor and yield-surface exponent for FCC metals [J]. International Journal of Plasticity, 2019, 114: 144-160.
[41] MONDAL C, SINGH A K, MUKHOPADHYAY A K, CHATTOPADHYAY K. Formation of a single, rotated-Brass {110}<556> texture by hot cross-rolling of an Al-Zn-Mg-Cu-Zr alloy [J]. Scripta Materialia, 2011, 64(5): 446-449.
陆丁丁1,李劲风1,宁 红1,马鹏程2,陈永来2,张绪虎2,张 恺3,李建梅4,张瑞丰1
1. 中南大学 材料科学与工程学院,长沙 410083;
2. 航天材料及工艺研究所,北京100076;
3. Monash Centre for Additive Manufacturing, Monash University, Clayton 3800, Australia;
4. 宁夏大学 化学化工学院,银川 750021
摘 要:从显微角度研究80 mm厚(t)2050铝锂合金板材在150°C时效后显微组织对其拉伸性能的影响。采用扫描电子显微镜、光学显微镜、透射电子显微镜和X射线衍射仪对合金表层(t/6)、中间层(t/3)和中心层(t/2)进行观察。结果表明,合金晶界第二相、析出相和织构随厚度位置的变化而出现差异。在欠时效到峰时效过程中,该合金沿轧制方向的析出相强化效果高于沿垂直轧制方向,但对合金各向异性影响不显著。β织构导致的较高泰勒因子值以及晶间第二相是合金在t/2层沿轧制方向获得最高强度的主要原因。合金沿垂直轧制方向的泰勒因子值差别较小,这导致合金在不同厚度层有相同抗拉强度。
关键词:2050铝锂合金;拉伸性能;各向异性;析出相;织构
(Edited by Xiang-qun LI)
Corresponding author: Rui-feng ZHANG, Tel: +86-18684819600, E-mail: ruifeng.zhang@csu.edu.cn
DOI: 10.1016/S1003-6326(21)65571-1
1003-6326/ 2021 The Nonferrous Metals Society of China. Published by Elsevier Ltd & Science Press

