J. Cent. South Univ. (2012) 19: 1032-1039
DOI: 10.1007/s11771-012-1106-2
Designing similarity measurement with distance measure and
application on laterally directional mode flight test
PARK Wook-je1, LEE Sang-min1, LEE Sang-hyuk2
1. Institute for Information and Electronics Research, Inha University, Incheon 402-751, Korea;
2. Department of Electrical and Electronic Engineering, Xi’an Jiaotong-Liverpool University, Suzhou 215123, China
? Central South University Press and Springer-Verlag Berlin Heidelberg 2012
Abstract: Similarity measure construction has been proposed as fault detection of flight test method in order to obtain the primary control surface stuck and the combination stuck of primary control. Similarity measures were obtained through analyzing the certainty and uncertainty of fuzzy membership functions, which were designed based on well-known Hamming distance. It was applied to the fault detection of primary control surface stuck of uninhabited aerial vehicle (UAV). At post-failure control surface, if the UAV is controllable and trimmable using other control surfaces, the UAV is able to fly or return to the safety region through reconfiguration of flight control system. To detect the fault, similarity measure computations were carried out. This result could be applicable with the real-time parameter estimation method. By monitoring the value of coefficients due to the control surface deviation, it becomes aware that the control surface fault occurs or not. The control surface stuck position and value were separated by comparing the trim value with the reference value. This is the advantage of increasing in reliability without adding sensors or with additional low cost.
Key words: similarity measure; fault detection and isolation; real-time parameter estimation; control surface stuck
1 Introduction
Researches on the similarity measurement designing have been proceeded by numerous researches [1-5]. Some similarity measurement was designed for the triangular or trapezoidal types fuzzy membership function, in which similarity was designed based on the fuzzy number. From the fuzzy number characteristics, the mentioned similarities are obtained easily. However, similarities are restricted with the specific type fuzzy membership functions, triangular and trapezoidal. Furthermore, membership functions are required to keep symmetric structure. To obtain similarity degree for more general fuzzy membership function, another approach is needed. Similarity measures between two fuzzy membership functions are roughly dependent on inverse value of distance. Similarity measure between two data has been considered as the common information of two sets, hence the common information is represented to be proved explicitly. Obtaining similarity measure is based upon the distance measure, which satisfies the definition of distance measure. The proposed similarity measure is explained through the comparative membership functions. With the obtained similarity measure, the computation of similarity between two fuzzy sets has been conducted.
Fault detection problem has been emphasized for many years by numerous researchers [6-10]. To decide faulty condition, it was required to possess the knowledge about motor, driver or other individual equipments. To decide fault operation for macroscopic machine like car, airplane or other complex materials, more essential parameters should be cosidered to affect the behavior of machine. Finally, to obtain more reliable performance, it was needed to process data having minimum uncertainty. Hence, to utilize reliable data, correction decision had to be required.
Proposed similarity measure was applied to aircraft system to decide malfunction or normal during flight. In the event of control surface malfunction in flight, the flight control system usually has redundancy to increase the safety of damaged aircraft. If the status of damage is known after the occurrence of failure, the fault tolerant control system is capable of adapting to the various faults in real time. Therefore, the pilot or the flight control system accomplishes the mission or returns to safety region. The fault-tolerant control system was required to perform fault detection and isolation (FDI) following failure to a critical system [1-9]. The conventional FDI methods consisted of the hardware and analytical method [9]. To implement a failure strategy, a variety of control surfaces including primary control surfaces, speed brakes, wing flaps, and spoilers, flight control computer and thrust mechanisms could be used [6-8,10]. Assuming the controllability and trimmability of the aircraft under post-failure conditions, in the event of the control surface stuck, the aircraft can keep on flying by the flight control computer which has restructured and reconfigured controllers according to the grade of system failure. For the decision or analyzing of the faults cases, statistical information of elevator deflection, aileron deflection and others cases have been analyzed. However, malfunctions could be invoked through processing overlapping data simple mean or other statistical information. Detection of faulty data from measurement analysis is obtained through statistical analysis, pattern recognition or other methods. However, these methods are not clear because there are data mixing cases or the higher dimensional partitioning is required.
2 Similarity measure
Similarity measure can determine the degree of similarity among data. From the following definition, various similarity measures can be derived.
Definition 1: A real function s: F2(X)→R+ is called a similarity measure, if s has the following properties:
(S1)  ,
,  ;
;
(S2)  ;
;
(S3)  ,
,  ;
;
(S4)  if
if then s(A, B)≥ s(A, C) and s(B, C)≥s(A, C).
where F(X) and P(X) are fuzzy set and ordinary set, respectively; Ac is the complement of A. With the definition of similarity measure, the similarity between fuzzy sets is followed. (S1) states commutative characteristic for similarity definition and (S2) shows that there is no similarity between complementary data sets. For the same data, its similarity represents the maximum value among the data sets and it is illustrated in (S3). With the meaning of triangular inequality, inequality between similarity measures can be explained in (S4).
Considering the two Gaussian type membership functions, as shown in Fig. 1, the shaded areas C and D can be considered as the components of similarity measure. Hamming distance is commonly used as distance measure between fuzzy sets A and B:

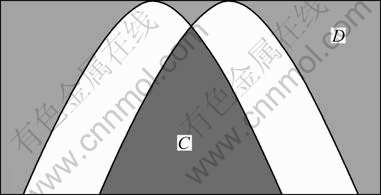
 Fig. 1 Two Gaussian type membership functions
where X={x1, x2, …, xn}; |・| is the absolute value of・; μA(x) is the membership function of A F(X). Then, the next two equations,
 and
and  [0]X) are proportional to C and D, where [1]X and [0]X are all ones and zeros for the universe of discourse. Part C is the common area of membership function, whereas D also represents the common information of the two membership functions. As the area C goes to one, area D satisfies zero. If D satisfies one, then two membership functions are exactly the same membership functions. Hence, proper similarity measure is obtained by combining two values.
Theorem 1: For any set A, BF(X) or P(X), if d satisfies Hamming distance measure, then
 (1)
(1)
Function s(A, B) is the similarity measure, where d is equal to the Hamming distance.
Proof: (S1) refers to the commutative characteristic of the sets A and B, which is clear from Eq. (1) itself. For (S2), because  and
and  [0]X) are equal to one, there is


For arbitrary different sets A and B, the inequality in (S3) is proved as


This inequality is satisfied by 
 and
and Finally, if then


Further,


Two inequalities are satisfied by d(B,[0]X)≤d(C,[0]X) and d(B,[1]X)≤d(A,[1]X). Therefore, s(A,B)≥s(A,C) and s(B,C)≥s(A,C) are satisfied. Therefore, (S4) is proved.
Thus, proposed similarity measure (see Eq. (1)) satisfies similarity measure. Another similarity measure can be obtained by similar way of consideration in the following theorem.
Theorem 2: For any set A, BF(X), if d satisfies Hamming distance measure, and d(A, B)=d(Ac, Bc), then
 (2)
(2)
Function s(A, B) is the similarity measure between set A and B.
Verifications are quite similar to those of Theorem 1.
3 Airplane model
3.1 Model description
In aircraft system for combining longitudinal mode and lateral-directional modes, x and u denote state vector and elevator control input variable, respectively.
 (3)
(3)
and
 (4)
(4)
where u=δr is rudder control input, u=δa is aileron control input, and  is rudder and aileron sequential control input. In the state vector, p, q and r are the angular velocities; α is the angle of attack; β denotes the sideslip angle; u=δe is the elevator deflection; f and θ represent the roll and pitch angles, respectively. The elements of system matrix can be derived from dynamics equations that are linearized by using the small disturbance theory. System matrix and input matrix containing the model parameters are represented by
 (5)
(5)
and

 (6)
(6)
In Eq. (5), A1 and A2 are satisfied as


and
A2=
With Eqs. (3)-(6), the following finite dimensional airplane dynamics are shown as the state space equations [6-8, 10, 11-15]:
 (7)
(7)
 (8)
(8)
Output vector y are identified by x itself [4-7, 9, 11-12]. B=Ba is aileron control input; B=Br is rudder control input; B=Bra is rudder and aileron sequential control input.
In the above Eq. (8), C′=1 and D′=0 are used commonly. For parameter estimation procedure, Fourier transformation and least square method are carried out. The estimating parameters are assumed to be constant during flight test maneuvering [6-8, 10-15].
Applying the Fourier transform to Eqs. (7) and (8) gives
 (9)
(9)
 (10)
(10)
For the k-th state equation of vector (Eq. (9)), the cost function is
 (11)
(11)
The least squares cost function is
 (12)
(12)
 (13)
(13)
where 
 is parameter vector. The discrete Fourier transform for the i-th sampling time is obtained as
 is constant for given frequency and constant sampling interval, ωi is the i-th frequency and Δt is time interval (0.5 s). Furthermore, the estimated parameter covariance matrix is

where the equation error variance  can be estimated from the residuals:

and p1 is the number of elements in parameter vector.
The frequency spacing of 0.02Hz was found to be adequate, which gives 50 frequencies evenly distributed on the interval of 0.02-1.0 Hz for each transformed time domain signal.
3.2 Control surface stuck conditions and test procedure
The experimental model consists of one elevator, one rudder and two ailerons, as shown in Fig. 2. To simulate the fault detection procedure, one piece elevator as separated into two pieces has been considered: one is normal and the other is fault. The experimental model has also equipped with only one elevator. Hence, it is difficult to know whether it is fault or not. Therefore, the control surface has been added at the other vertical stabilizer. Finally, aircraft system having two elevators, two rudders, and two ailerons [6-8] has been considered.
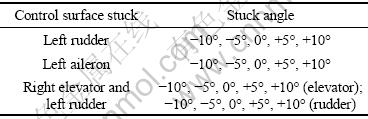
To represent the control surface failure, the right elevator, the left rudder, the left aileron stuck and the combination of these control surface stuck could be used. Excluding the uncontrollability and the untrimmability of the aircraft at post-failure conditions, the flight test was scheduled. Table 1 gives the flight test conditions of control surface stuck.
In the first flight test, the control input for the real-time parameter estimation was applied with the knob and switching method [6-8]. The flight data were acquired for exciting the dynamics of aircraft with the above mentioned method [6-8, 11-15]. But, it was found that the applied time interval was slightly inaccurate. In the second stage of the flight test in order to realize constant control input magnitude and the time interval, the control input device was developed to use an radio frequency (RF) modem and an remote control (R/C) Transmitter. According to the flight condition of control surface stuck, the flight test engineer adapted to the control surface stuck. After the ground test pilot had maintained the trimmed level flight at post- failure condition, the engineer was applied to the control input using the new device.
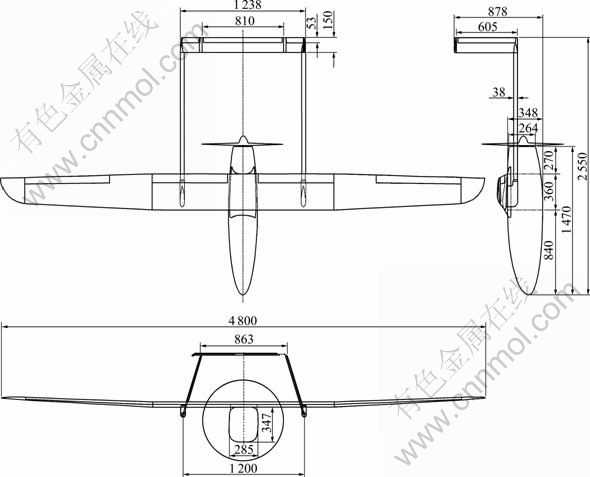
Fig. 2 UAV drawing (Unit: mm)
Table 1 Control surface stuck conditions
3.3 Parameters of lateral-directional mode
Considering the primary control of surface stuck and combination stuck, the aircraft must have controllability and trimmability at post-failure conditions, and the flight test procedure contains the recovery of the normal state from the fault state [6-8]. Tables 2, 3 and 4 show that the experimental system (DURUMI-II) is successfully tested under the fault conditions. Also, the tables show the trim value of available primary control surface under post-failure conditions. In Tables 2 and 3, blank parts are considered as the uncontrollability and the untrimmability cases.
Table 2 Rudder trim value in lateral-directional mode (Normal mode rudder trim value is 5.545)
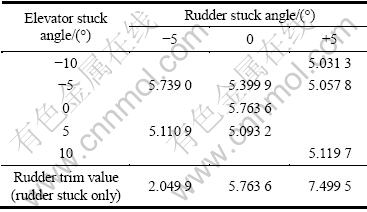
Table 3 Elevator trim value in lateral-directional mode (Normal mode elevator trim value is 0.520)
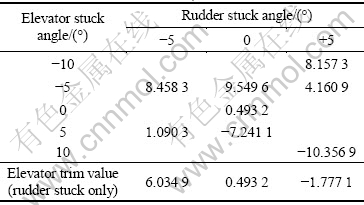
Table 4 Aileron trim value in lateral-directional mode (Normal mode aileron trim value is 0.086 5)

In lateral-directional mode, in order to obtain the failure status of the aileron, the following data are required: the change in rolling moment coefficient caused by variation in sideslip angle,  the change in rolling moment coefficient due to variation in rolling velocity,
  the variation in rolling moment coefficient with change in aileron deflection
  The lateral mode analysis of
 and
and  is essential to obtaining information on the aircraft performance characteristics. Figures 3-5 show the scatter diagrams of and
  respectively. In order to obtain the failure status of rudder, the variation in yawing moment coefficient with a change in rudder deflection,
  is essential to obtaining information on the aircraft performance characteristics.
In Figs. 3-6, normal point and fault points are summarized as follows: Anorm: Aileron normal (Aileron control input only); AilF0: Left aileron fault 0° (Aileron control input only); AilFL5: Left aileron fault left 5° (Aileron control input only); AilFR5: Left aileron fault right 5° (Aileron control input only); RudAil: Rudder and aileron control input (Normal state); Rnorm: Rudder normal (Rudder control input only); RudF0: Left rudder fault 0° (Rudder control input only); RudFL5: Left rudder fault left 5° (Rudder control input only); RudFR5: Left rudder fault right 5° (Rudder control input only).
Operation data points are dotted in Figs. 3-6. The case of normal or fault has been listed for elevator, rudder and aileron, simultaneously. Conventionally, statistical information such as mean and variance is commonly used. However, the analysis results of the stability and controllability derivations do not clearly explain whether the control surface of aircraft is normal because the results are scattered. Hence, the proper detection or partitioning measures are required to classify the difference between the normal states and the post-failure states.
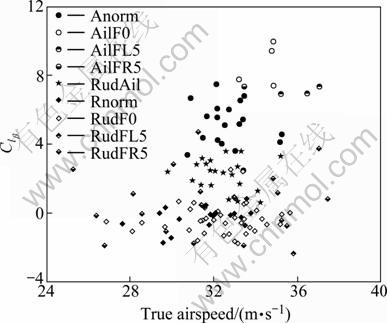
Fig. 3 Scatter diagram of  coefficient
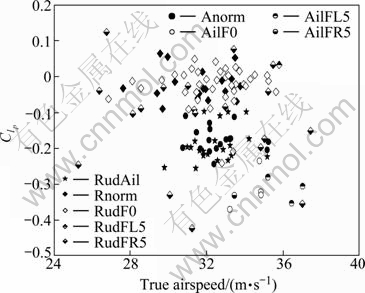
Fig. 4 Scatter diagram of coefficient
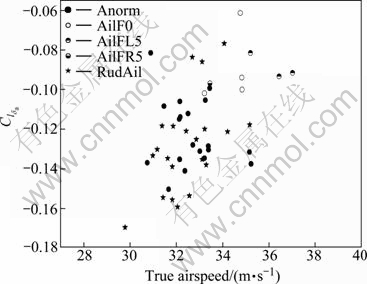
Fig. 5 Scatter diagram of  coefficient

Fig. 6 Scatter diagram of  coefficient
3.4 Fault detection procedure
Fault detection and isolation procedure is illustrated, as shown in Fig. 7. Fault detection procedures are composed with similarity computation and detection. Similarity computations are carried out with similarity measure, and detection part needs more reference data and consideration.
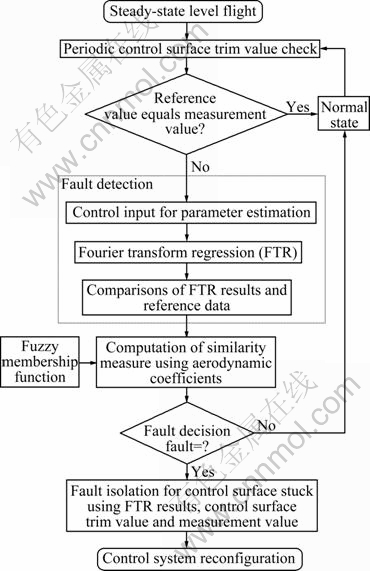
Fig. 7 Fault detection and isolation procedure
The flight control computer (FCC) detects and isolates the control surface fault, according to the procedure, as shown in Fig. 8. The FCC periodically checks the measured trim value against the reference value in steady state level flight. If the measurement value is wide of the error limit, the FCC is applied to the control input for the real-time parameter estimation and estimates in real time. It detects the control surface failure by comparing the estimated coefficients with the reference coefficients, and finds out the control surface stuck position by comparing the trim value and the reference value. Fault detection and isolation implement the difference of trim value and the variation of aerodynamic coefficients using the real-time parameter estimation method. Tables 2-4 give the trimmed values of aircraft at post-failure conditions.
For constructing fuzzy membership function, the coefficient values of  and
and  are partitioned into ten groups, and numbers of data are normalized. Distributed data points of and indicate that the normal and faulty values are mixed. Hence, it is not easy to obtain efficient similarity measure with only statistical analysis, mean and standard deviation. To overcome the difficulty of statistical study, similarity measure is considered which is based on the fuzzy membership function.
With scatter diagrams, normal and faulty fuzzy membership functions are illustrated in Figs. 8-11. Firstly, similarity measure is considered using  as
as


where FN and FF denote normal and faulty fuzzy membership function (see Fig. 8). Another similarities of and are obtained through Figs. 8- 11. Six points are chosen to calculate and analyze the characteristics. Points a1 to a6 are shown in Figs. 8-11 (where a1 and a2 reprent aileron normal; a3 reprents rudder normal; a4 reprents aileron normal and rudder normal; a5 reprents aileron fault; a6 reprents rudder fault).
From the mixed similarity, measures of
and are combined as

 (14)
(14)
where ω1-ω4 are weighting factors for similarity measures. From Eq. (14), the tendency of normal or fault
is calculated for six points. Value of  is
is
classified into normal and fault conditions by
 and
and  for point p′. Similarly, the
other similarities of Eq. (14) are also classified by normal and faulty conditions.
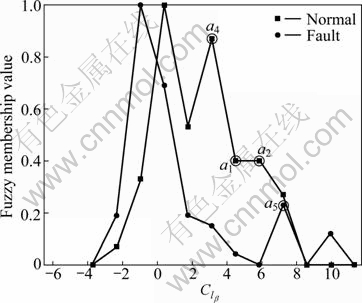
Fig. 8 Membership functions of  coefficient
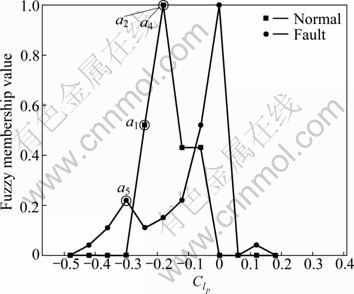
Fig. 9 Membership functions of  coefficient
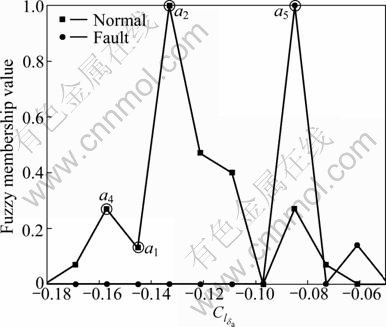
Fig. 10 Membership functions of  coefficient
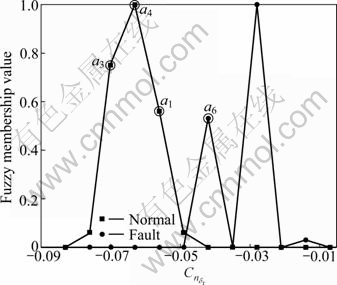
Fig. 11 Membership functions of  coefficient
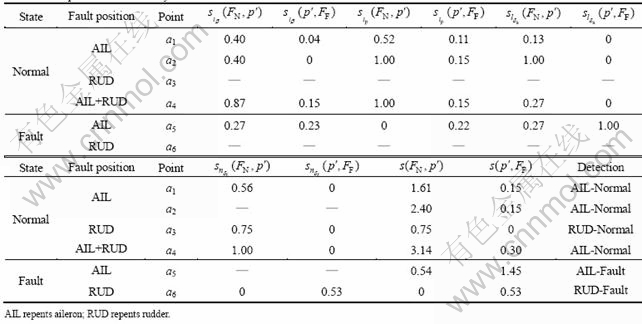
Table 5 indicates that the detection of six operation points goes well. Five cases of operation, AIL-Normal, AIL-Fault, RUD-Normal, RUD-Fault and AIL-RUD Normal, are represented by a1-a6. Here, weighting factors ω1-ω4 in Eq. (14) are all assigned by one. By the result of Table 5, six cases of detection are all correct. The advantage of detection by similarity measure is clear from the quantitative measure. Furthermore, wide difference measures between normal and fault operations make it easy to decide. The least multiple of difference is2.68 for operation a5. However, decision method with similarity measure is required using at least more than one coefficient. Because similarity measure  of a5 is greater than
  decision is AIL-Fault.
Table 5 Computation of similarity measure
4 Conclusions
1) The normal and faulty operation with the right elevator stuck, the left rudder stuck, the left aileron stuck, and the combinations stuck are examined. The input for the parameter estimation is successfully implemented in flight by using programmed switch method. It is shown that it is possible to detect the fault operation with the monitoring the value of the roll damping derivative  and other coefficients
 and
and 
2) It is found that the control surface stuck position is known by comparing the trim value and the reference value. In the reconfigurable flight control system using on-line estimates of aircraft parameters from a real-time parameter estimation scheme, the advantage is an increase in reliability without adding sensors or with additional low cost.
3) Similarity measure is designed for the purpose of discriminating between healthy and faulty data. Fault detection and isolation using the real-time parameters of trim value and the variation of aerodynamic coefficients are carried out by application of similarity measure. Decision by calculation of similarity measure indicates satisfactory results, and it is verified from result table.
References
[1] LEE S H, PARK H J, PARK W J. Similarity computation between fuzzy set and crisp set with similarity measure based on distance [J]. Lecture Notes in Computer Science, 2008, 4993: 644-649.
[2] FAN J L, XIE W X. Distance measure and induced fuzzy entropy [J]. Fuzzy Set and Systems, 1999, 104(2): 305-314.
[3] LEE S H, KIM Y Y, CHEON S P, KIM S S. Reliable data selection with fuzzy entropy [J]. Lecture Notes in Computer Science, 2005, 3613: 203-212.
[4] LIU X. Entropy, distance measure and similarity measure of fuzzy sets and their relations [J]. Fuzzy Sets and Systems, 1992, 52(3): 305-318.
[5] FAN J L, XIE W X. Distance measure and induced fuzzy entropy [J]. Fuzzy Set and Systems, 1999, 104: 305-314.
[6] PARK W J, LEE S H, SONG J I. Fault detection and isolation of DURUMI-II using similarity measure [J]. Journal of Mechanical Science and Technology, 2009, 23(2): 302-310.
[7] PARK W J, KIM E T, SONG Y K, KO B J. A study on the real-time parameter estimation of DURUMI-II for control surface fault using flight test data [J]. International Journal of Control, Automation, and Systems, 2007, 5(4): 410-418.
[8] PARK W J, KIM W T, SEONG K J, KIM Y C. A study on the parameter estimation of DURUMI-II for the fixed right elevator using flight test data [J]. Journal of Mechanical Science and Technology, 2006, 20(8): 1224-1231.
[9] KIM Y D. A study on fault detection and redundancy management system [R]. SUDP-P1-G4, March 2005.
[10] NAPOLITANO M R, SONG Y K, SEANOR B. On-line parameter estimation for restructurable flight control systems [J]. Aircraft Design, 2001, 4(1): 19-50.
[11] MORELLI E A. Real-time parameter estimation in the frequency domain [C]// Proceedings of the 1999 AIAA Atmospheric Flight Mechanics Conference. Portland, Or., 1999. AIAA-99-4043.
[12] MORELLI E A. Identification of low order equivalent system models from flight test data [R]. NASA-TM-210117, 2000.
[13] SONG Y K. A study on real-time aircraft parameter estimation [C]// Proceedings of the KSAS Spring Annual Meeting. 2001: 359-362.
[14] PARK W J. A study on the design of real-time parameter estimator for an aircraft [D]. Hankuk Aviation University, 2004.
[15] HWANG M S, PARK W J, KIM Y C, EUN H B, CHOI W J, SONG Y K. Lateral stability improvement of a canard airplane using a vertical panel [C]// AIAA Atmospheric Flight Mechanics Conference and Exhibit. Monterey. California. 2002. AIAA-2002-4625.
(Edited by DENG Lü-xiang)
Foundation item: Project(20110018394) supported by Key Research Institute Program through the National Research Foundation (NRF) of Korea
Received date: 2011-05-31; Accepted date: 2011-11-11
Corresponding author: LEE Sang-hyuk, Professor, PhD; Tel: +86-512-88161415; E-mail: Sanghyuk.Lee@xjtlu.edu.cn

