Shot noise analysis on corrosion behavior of zinc alloy (ZnAl4Cu1) under dry-wet cycles
来源期刊:中国有色金属学报(英文版)2012年第1期
论文作者:陈安娜 曹发和 刘文娟 郑利云 张昭 张鉴清 曹楚南
文章页码:228 - 240
关键词:电化学噪声;散粒噪声分析;干湿循环;锌合金
Key words:electrochemical noise; shot noise analysis; dry-wet cycle; zinc alloy
摘 要:采用电化学噪声理论,研究锌合金(ZnAl4Cu1)在3.5%(质量分数)NaCl, 7.3%(质量分数)Na2SO4和模拟酸雨溶液中干湿循环条件下的腐蚀行为。采用快速傅里叶变换(FFT)、快速小波变换(FWT)和散粒噪声理论结合统计方法分析原位电化学电位噪声。散粒噪声分析的fn累计曲线图表明,在干循环中电子转移事件的频率高于湿循环中的,在NaCl溶液中的腐蚀比在Na2SO4中的腐蚀更均匀,腐蚀事件的条件产生速率r(t)对于受扩散控制的事件来说随着干湿循环时间的延长而降低。锌合金在NaCl溶液中湿循环时,均匀腐蚀和扩散控制的事件的r(t)值最大;在Na2SO4溶液中湿循环时,点蚀事件的r(t)值最大。在酸雨溶液中可明显观察到锌合金的晶间腐蚀。
Abstract:
The corrosion behaviors of zinc alloy (ZnAl4Cu1) in 3.5% (mass fraction) NaCl, 7.3% (mass fraction) Na2SO4 and simulated acid rain solutions were investigated using electrochemical measurements. The potential noise during dry-wet cycle was monitored and analyzed by fast Fourier transform (FFT), fast wavelet transform (FWT), shot noise theory and stochastic theory. Cumulative probability curves of event frequency fn indicate that the corrosion events in the dry cycles are greater than those in the wet cycles. Uniform corrosion was observed in the NaCl solution compared with more localized corrosion in the Na2SO4 solution, which is evidenced by FWT and SEM. Conditional events generation rate r(t) for diffusion controlled reactions decreases with increasing the time. r(t) values for uniform corrosion and diffusion controlled process are the largest in the wet cycle in 3.5% NaCl solution. The values of r(t) for pitting corrosion in Na2SO4 solution are observed to become large during spraying periods, and r(t) for pitting corrosion has the largest value in the Na2SO4 solution. The intergranular corrosion of zinc is serious in simulated acid rain solution.

![]()

Trans. Nonferrous Met. Soc. China 22(2012) 228-240
CHEN An-na1, CAO Fa-he1, LIU Wen-juan1, ZHENG Li-yun1, ZHANG Zhao1, ZHANG Jian-qing1, 2, CAO Chu-nan1, 2
1. Department of Chemistry, Zhejiang University, Hangzhou 310027, China;
2. State Key Laboratory for Corrosion and Protection, Institute of Metal Research,
Chinese Academy of Sciences, Shenyang 110016, China
Received 8 December 2010; accepted 4 May 2011
Abstract: The corrosion behaviors of zinc alloy (ZnAl4Cu1) in 3.5% (mass fraction) NaCl, 7.3% (mass fraction) Na2SO4 and simulated acid rain solutions were investigated using electrochemical measurements. The potential noise during dry-wet cycle was monitored and analyzed by fast Fourier transform (FFT), fast wavelet transform (FWT), shot noise theory and stochastic theory. Cumulative probability curves of event frequency fn indicate that the corrosion events in the dry cycles are greater than those in the wet cycles. Uniform corrosion was observed in the NaCl solution compared with more localized corrosion in the Na2SO4 solution, which is evidenced by FWT and SEM. Conditional events generation rate r(t) for diffusion controlled reactions decreases with increasing the time. r(t) values for uniform corrosion and diffusion controlled process are the largest in the wet cycle in 3.5% NaCl solution. The values of r(t) for pitting corrosion in Na2SO4 solution are observed to become large during spraying periods, and r(t) for pitting corrosion has the largest value in the Na2SO4 solution. The intergranular corrosion of zinc is serious in simulated acid rain solution.
Key words: electrochemical noise; shot noise analysis; dry-wet cycle; zinc alloy
1 Introduction
The crucial effects of Cl- and SO42- on zinc atmospheric corrosion have been corroborated through a number of studies [1-4]. One of the common methods is simulating natural conditions in laboratory to make alloy failure artificially. It is important to know that Cl- causes the premature failure of zinc alloys and coatings. PERSSON et al [2] have done some work to research the corrosion processes of zinc confined in crevices during drying of the wet surface. Their significant result was that, at the border of the electrolyte during the drying process, a white zone of corrosion products containing zinc hydroxycarbonate (Zn5(CO3)2(OH)4) was formed, which indicated the separation of the anodic and cathodic regions. But in this way the drying and wetting process cannot be circulated. Changing electrolyte film on the metal due to the natural processes makes corrosion events more complex. A successful example for the application of electrochemical measurement in detecting dry-wet effects on metals was EL-MAHDY’s [3] work to study the corrosion mechanisms for brass. EL-MAHDY [3] investigated the atmospheric corrosion of brass in aqueous sodium chloride (NaCl) and ammonium sulfate ((NH4)2SO4) solution in dry-wet cycle. Polarization resistance of brass was monitored by electrochemical impedance spectroscopy. QU et al [4] pointed out that zinc hydroxysulfate (Zn4SO4(OH)6・5H2O) and zincite (ZnO) were the main corrosion products in the presence of Na2SO4. CHEN et al [5] reported the precipitation of zinc hydroxysulphate and the absence of secondary spreading decreased the corrosion rate.
Electrochemical noise (EN) technique was able to monitor the corrosion process in situ in the corrosion processes of aluminum alloy [6, 7], copper [8] and steels [9]. Shot noise theory was one of the methods to analyze EN signal in corrosion processes [10, 11]. From shot noise theory it can be deduced that the number of charge carriers passing a given point will be a random variable [10]. The mean frequency of charge emission fn, which is proportional to the specimen area, can be deduced like [10, 11]:
![]()
where Icorr is the corrosion current; q is the average charge on carrier; A is the exposed electrode area; ΨE,meas is the low frequency power spectral density of measured potential; B is Stern-Geary constant (about 26 mV/decade according to the earlier work [7]). AL-MAZEEDI and COTTIS [12] reported the electrochemical noise measurements on BS970:080A15, where fn was obtained and correlated with the number of corrosion events. NA and PYUN et al [13] introduced the Weibull distribution to 1/fn system and plotted the cumulative probability F(1/fn) against 1/fn; in the further step of quantitative analysis, they employed “the conditional events generation rate of corrosion r(t)” to predict the probability of events in the future from the past events.
The shot noise theory has been rarely used in the interpretation of electrochemical noise data collected from corrosion of a metal under dry-wet cycles. The aim of this work is to study the corrosion process of zinc alloy in the simulated nature conditions by EN technique. Fast Fourier transform (FFT), fast wavelet transform (FWT) and shot noise analysis are used to analyze EN signal. Quantitative effects of Cl-, SO42- and acid rain on the simulated atmospheric corrosion of zinc alloy are discussed.
2 Experimental
The composition of zinc alloy is shown in Table 1. The material was made into cylindrical specimens with a diameter of 5.00 mm and mounted in polymethylmethacrylate (PMMA) coating with the exposed surface of 0.20 cm2. The specimen was ground by abrasive paper from 400 to 1200 grade, polished with diamond paste, degreased in ethanol, rinsed with distilled water, dried in cool air and kept in desiccators. The electrolytes were aqueous of 3.5% NaCl, 7.3% Na2SO4 and the simulated acid rain, whose compositions were shown in our previous work [6]. All these solutions were prepared with distilled water and analytical grade reagents. The pH value of the simulated acid rain solution was adjusted to 3.0 by sulfuric acid and sodium hydroxide.
Table 1 Composition of zinc alloy (mass fraction, %)
![]()
The dry-wet chamber is shown in Fig. 1. Specimens were fixed at the same site in the chamber. In the wet cycles, droplets of solutions of 3.5% NaCl, 7.3% Na2SO4 and the simulated acid rain sprayed out from the top of the chamber. In the dry cycles, the droplets stopped falling. A routine of dry-wet cycle consisted of 1 h spray and 7 h drying process. All experiments were completed at 25 °C and high relative humidity (90%-95%).
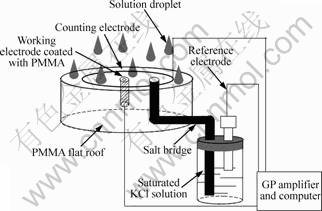
Fig. 1 Electrochemical cell and experimental setup
Polarization measurements were performed with a commercial Model 630C electrochemical analyzer/ workstation (CH Instruments Inc., USA). Conventional three-electrode electrochemical cell was utilized. A platinum wire with a larger area compared with the work electrode was used as the auxiliary electrode and a saturated calomel electrode (SCE) as reference electrode. Polarization curve was scanned from -1.2 to -0.8 V at a rate of 0.5 mV/s [14].
Electrochemical potential noise measurements were carried out in 20 min after the electrochemical arrangement was set up. EN measurements were performed by a PowerLab/4sp coupled with GP Amplifiers (AD Instruments Pty Ltd., Australia) and a low-pass filter before the analog-to-digital conversion. The sampling frequency was 4 Hz. As a result, potential―time series were obtained. The chamber was placed in a Faraday cage during measurements and each measurement last 4 d (12 dry-wet cycles). A SCE was also used as reference electrode.
After dry-wet cycles, the electrodes were washed with distilled water, dried by cool air with a blower, and identified by SEM and EDX (SIRION-100 equipped with GENESIS 4000, USA). The corrosion products were removed by saturated ammonium acetate (CH3COONH4) solution and the surface morphology and corrosion production were also observed by SEM and EDX.
3 Data analysis
The potential noise should be pretreated with linear trend removal in the first step. The characteristic of potential noise is then determined through power spectrum density (PSD) [15] and the parameter fn. In PSD analysis, each time record consists of 2048 data points. Time series of 12 wet cycles and the 4th hour of 12 dry cycles are taken into concern. The first 15 min data have been lapsed and 4 continuous time records are analyzed for each hour. The PSD values at 10-2 Hz are used to estimate fn value, so there are 48fn points in wet or dry condition in one solution. Cumulative probability F(fn) of fn is plotted as a function of fn under each condition, which can be referred by AL-MAZEEDI and COTTIS [12] and NA and PYUN [16]. Cumulative probability is measured as M/(N+1), where M is the rank in the ascending order of fn data and N is the total number of data. In this work, N is 48 according to above analysis. The Weibull probability plot is then constructed by calculating cumulative probability of 1/fn stated in the introduction section. The cumulative probability from Weibull distribution function is expressed as Eqs. (2) and (3).
![]()
whose rearranged form is written by:
![]()
where m and n are the shape and scale parameters, respectively.
The conditional events generation rate can be obtained by:
![]()
In Eq. (4), F′(1/fn) is the derivative of F(1/fn), indicating the probability density function for the Weibull distribution; r(t)dt represents the generation probability of events in the next unit time dt for the specimens.
More recently, our group has attempted to derive alternative indicators of corrosion types and corrosion severity from wavelet analysis [17]. A approach of wavelet analysis is to represent the time record x(t) (t=1, 2, …, N) by a linear combination of dyadic wavelet ![]() and scaling functions
and scaling functions ![]() [17].
[17].

where SJ,k, Dj,k, …, Dj,k are so-called wavelet coefficients; J is a natural number; j=1, 2, …, J; k=1, 2, …, N/2; N is the number of data.
The mother and father wavelet functions are expressed respectively as follows:
![]()
![]()
The energy of the analyzed signal is equal to the sum of energies of all components obtained by wavelet transform. As a result, the detail coefficients D and the general coefficients S are saved. Then, the relative energy of a crystal, which estimates the contribution of crystal to the overall signal, can be calculated as:

At present work, J is assumed to be 8 and the orthogonal Daubechies order 4 (db4) mothers analysis is used because the shape of this wave is close to EN.
4 Results and discussion
4.1 Calculation of Stern-Geary constant B
The polarization curves (Fig. 2) are obtained to determine the Tafel slopes and the corrosion current density Jcorr. The cathodic current density of the zinc in acid rain is mainly related to the evolution of hydrogen. However, the activity of H3O+ in the neutral solutions is too low for the hydrogen evolution. Water molecules may act as the electron accepter as Eq. (9) whose standard electrode potential equals -1.07 V.
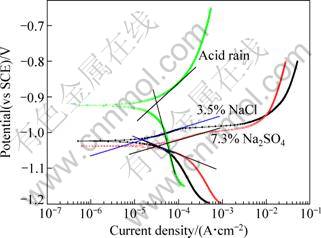
Fig. 2 Polarization curves of zinc alloy in 3.5% NaCl, 7.3% Na2SO4 and simulated acid rain
![]() (9)
(9)
The pattern of anodic polarization branch can be due to the dissolution of zinc. It exhibits pitting potential Epit in the NaCl and Na2SO4 solutions [18-20]. However, the Tafel slopes still exist [14]. The values of Stern-Geary constant B and Jcorr are listed in Table 2. Though some difference exists among the values of kinetic parameters in the three solutions, more attention should be paid to realize that there are no magnitude differences between the three systems in the B values. The measured ones are close to the referenced B value in typical corrosion system [7].
Table 2 Values of coefficient determined from polarization curves

4.2 Time domain analysis of potential time series
Figure 3 shows the typical potential records of zinc alloy in 3.5% NaCl, 7.3% Na2SO4 and simulated acid rain solutions for 4 d of dry-wet cycle, respectively.
It can be seen that the wet periods of all solutions exhibit more noble potential values than those of their individual drying processes, indicating the higher activity of Zn alloy during wet cycles [3, 6]. The thickness of diffusion layer is thinner in spray periods, which results in the increase of cathodic current density in the wet periods. The decrease of cathodic current leads to the shrinkage of potential in the dry cycles, referred to our previous work [6]. In 3.5% NaCl solution, the potential difference between the drying and wetting processes dwindles obviously with time, which is different from the situation in Na2SO4 solution. It is suggested that the deposited products have limited the spreading of the electrolyte on the surface in NaCl solution [21].
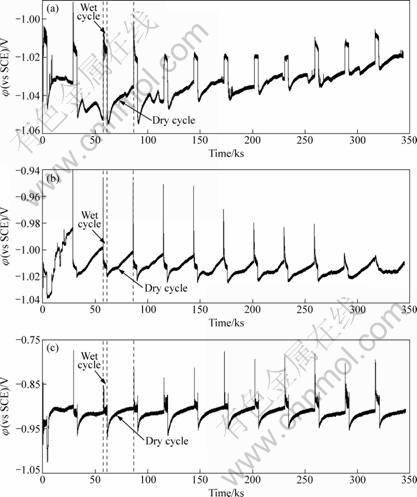
Fig. 3 Electrochemical potential series of zinc alloy in 3.5% NaCl (a), 7.3% Na2SO4 (b) and pH=3.0 simulated acid rain (c) during dry-wet cyclic conditions
According to the study of QU et al [4], the corrosion of zinc in the presence of Na2SO4 may lead to the formation of insoluble zinc hydroxysulfate, Zn4SO4(OH)6・5H2O as:
![]() (10)
(10)
In the simulated acid rain solution, the potential difference between the dry and wet cycles enhances due to the increase in active reaction region of zinc alloy under low pH conditions.
At every beginning of wetting periods, the corrosion potential sharply increases and then decreases slightly, which can be explained by the activation of electrode. The cathodic reagent changes from proton to oxygen resulting in a more positive corrosion potential at the end of dry cycles [6]. In Na2SO4 solution, the highest corrosion potential in each terminal of drying process is about -1.00 V, which is a relative minor negative value compared with the corresponding corrosion potential in NaCl solution. This contributes to higher concentration of electrolyte which makes the solute particles easily deposit on the electrode surface.
Zinc alloy in acid rain solution (lower pH value) has higher corrosion potential (Fig. 3(c)). The anodic dezincification involved in neutral solutions has different mechanisms with those in acid rain solution. Intermediate Zn+ ion into Zn is suggested as a probable process for the neutral solutions. This phenomenon can also refer to the polarization curves results, as shown in Fig. 2.
Time―frequency transform technology and shot noise theory will be applied to making in-depth analysis of Zn corrosion behavior in different aggressive environments in the following sections.
4.3 FFT analysis
The PSD is determined as the amplitude square of the sine waves using FFT method. Figure 4 shows the power spectra corresponding to potential data from the first dry-wet cycle in three solutions. In this case, PSD changes little with frequencies over the whole range. Most of time, low frequency plateau can be found, so the lowest PSD value can be taken into shot noise analysis.
4.4 Shot noise analysis
4.4.1 Cumulative distribution of fn
The distributions of the shot noise parameter fn were plotted, as shown in Fig. 5. It can be seen that most values of fn lie between 103 to 106 Hz/cm2. A larger value of fn indicates higher tendency for uniform corrosion [7]. It is clear to see that the wet cycles have lower values of fn, which suggests that localized corrosion of zinc alloy within wet cycles such as metastable pitting is dominant.
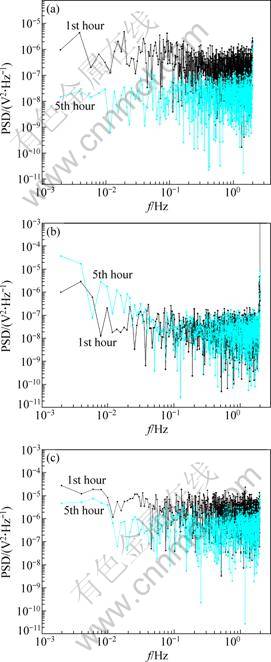
Fig. 4 PSD plots estimated by FFT for potential records of zinc alloy in 3.5% NaCl (a), 7.3% Na2SO4 (b) solutions, and pH=3.0 simulated acid rain (c) in the 1st and 5th hour of dry-wet cycle
In dry cycles, the increase of fn can be attributed to the stable uniform corrosion of the electrode, which is evidenced by the FWT shown in the next section.
fn of 12 wet cycles in simulated acid rain is absolutely separated from the one in 3.5% NaCl solution. Parameter fn appears in boarder range in the simulated acid rain solution. It is suggested that a complex corrosion process of zinc alloys occurs in the simulated acid rain solution and the localized corrosion is dominant, especially in wet cycles. The curves in 7.3% Na2SO4 solution have an analogy to the ones in simulated acid rain. In drying processes, two curves related to the data from Na2SO4 and acid rain solutions assemble in a small range, even badge with each other.

Fig. 5 Cumulative probability plots for frequency of events (fn) of zinc alloy during dry-wet cycles in 3.5% NaCl (1―Wet cycles; 2―Dry cycles), 7.3% Na2SO4 (3―Wet cycles; 4―Dry cycles) solutions and pH=3.0 simulated acid rain (5―Wet cycles; 6―Dry cycles)
4.4.2 Weibull distribution of 1/fn
The cumulative probability of 1/fn can be introduced as a Weibull distribution function, which is expressed as Eqs. (2) and (3). ln[ln(1/(1-F(1/fn)))] is plotted vs ln(1/fn), as shown in Fig. 6. According to the stochastic theory, the change of slops of curves in Fig. 6 indicates the change of corrosion mechanism [11, 13, 16].
Figure 7 shows the linear fitting of Weibull probability plots of zinc alloys in NaCl solution, Na2SO4 solution and simulated acidic rain. It can be found that one to three straight lines appear on the plots. According to the physical meaning of fn introduced above, the slope in the smallest 1/fn region is associated with uniform corrosion. The one in the relatively larger 1/fn region is responsible for the localized corrosion, and the largest 1/fn region corresponds to the stochastic process like the diffusion of reaction ions [13]. The three regions are separated by vertical lines parallel to y-axis. It is stressed that the slopes do not rigorously but dominantly represent the uniform corrosion, localized corrosion and diffusion control. The values of m and n for the uniform, localized corrosion and diffusion control are quantitatively calculated.
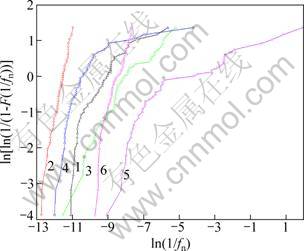
Fig. 6 Weibull probability of zinc alloy during dry-wet cycle in 3.5% NaCl (1―Wet cycles; 2―Dry cycles), 7.3% Na2SO4 (3―Wet cycles; 4―Dry cycles) solutions and pH=3.0 simulated acid rain (5―Wet cycles; 6―Dry cycles)
The values of shape parameter m and scale parameter n in Table 3 are used to calculate r(t) values for estimating the “future dissolution possibility” of zinc, shown in Figs. 8-10. The r(t) values for the diffusion controlled process are the largest during the wet cycles in 3.5% NaCl solution (Fig. 8(a)). The r(t) values for the uniform corrosion are the largest during the dry cycles in the NaCl solution (Fig. 10(a)). These phenomena can be explained that the frequencies of evens occur in confined order of magnitudes and the cumulative probabilities increase sharply, due to small size and specific surface aggression of Cl- ion to zinc alloy. In diffusion control segment (Fig. 8), r(t) decreases with time no matter which kind of the solutions.
Table 3 Linear fitting parameters of Weibull probability plots
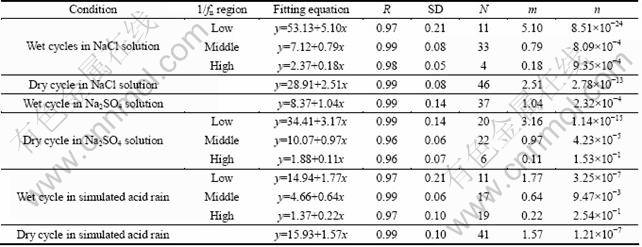
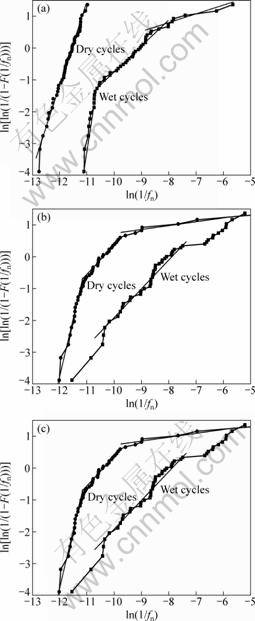
Fig. 7 Linear fitting of Weibull probability of zinc alloy during dry-wet cycle in 3.5% NaCl (a), 7.3% Na2SO4 (b) solutions and simulated acid rain (c)
The plots in Fig. 9 demonstrate the r(t) values for the pitting corrosion. Curves decrease with time in the NaCl and simulated acid rain solution (curves a and c in Fig. 9(a), (c)), which is due to the change of corrosion types from pitting to uniform corrosion. The values of r(t) in Na2SO4 solution are observed to become large during spraying periods, and r(t) has the largest value during dry cycles in Na2SO4 solution simultaneously. As reported in Ref. [16], in Na2SO4 solution the growth of existing pits will be promoted, but the incubation of new pitting holes will be restrained. In simulated acid rain solution, all r(t) values of zinc dissolution are lower, due to the diluted aggressive ions. r(t) values in acid rain decrease with increasing 1/fn for the stochastic process controlled by diffusion and pitting formation and increase when uniform dissolution is dominant.
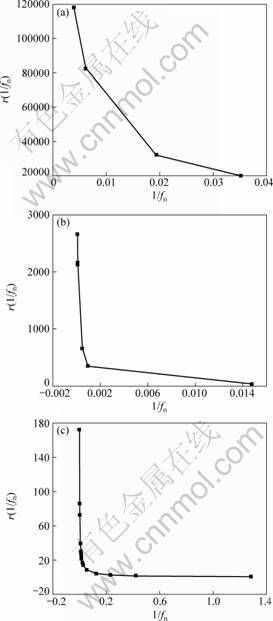
Fig. 8 Plots of conditional events generation rate for stochastic process controlled by diffusion, r(1/fn) vs 1/fn for zinc in wet cycle of 3.5% NaCl (a), dry cycle of 7.3% Na2SO4 (b) solutions and simulated acid rain (c)
4.5 Wavelet analysis
Figure 11 shows the mean values Ej of relative energy distribution of 2048 points after 15 min of 120 h immersion of zinc in the three solutions. The mean relative energy is calculated from the wavelet analysis, as shown in Eq. (8). Pitting corrosion is generally believed as the first breeding before other types of localized corrosion [22]. It is accompanied with the intergranular corrosion and uniform corrosion. That’s why Fig. 11 shows the relative high energy distribution of low crystals, indicating a pitting corrosion, and why the percentages of energy decrease with the coefficient of the crystal factor increasing. The relative energy of the 8th crystal in NaCl solution is the largest, when the least energy distributes in the low crystals in Na2SO4 solution. It is as well as a support of conclusion obtained by importing the Weibull distribution to the shot noise analysis. In the NaCl solution the zinc alloy experiences more serious uniform corrosion than in the Na2SO4 solution or the simulated acid rain. The crystals of 2, 3 and 4 order in the acid rain solution have the largest energy distribution in the three solutions, possibly due to zinc alloy in the acid rain generating a deeper pit or intergranular corrosion caused by alloying elements (such as Al element, which can react with the acid before zinc), which can be seen in Figs. 12-14. Time resolving energy distribution of crystals shows that energy distributing in the low-level crystals in the Na2SO4 solution becomes large with time, even greater than 0.85, while it changes slightly in NaCl or acid rain solution. That is because SO42- can inhibit the occurrence of new pits as stated in Ref. [16].

Fig. 9 Plots of pitting formation rate, r(1/fn), against exposure time t for wet cycles in 3.5% NaCl (a), 7.3% Na2SO4 (b) solution and pH=3.0 simulated acid rain (c) and dry cycles in 7.3% Na2SO4 solution (d)
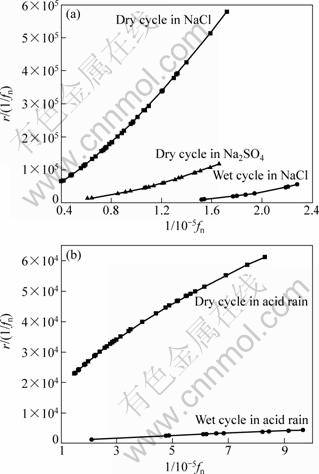
Fig. 10 Plots of conditional events generation rate for uniform dissolution of zinc
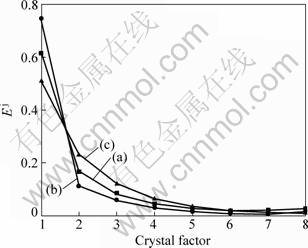
Fig. 11 EPD obtained for zinc alloy exposed to 3.5% NaCl (a), 7.3% Na2SO4 (b) and pH=3.0 simulated acid rain (c) Ej indicates mean values of relative energy calculated from 120 h dry-wet cycle)
4.6 Surface characterization
In order to investigate and verify the conclusions of EN analysis, corrosion morphology was monitored by SEM, as shown in Figs. 12-14. At the initial stage of dry-wet cycle in the NaCl solution (Figs. 12(a), (b) and (c)), the specimen shows pitting holes and soon the cracks propagate. EDX measurements were done in the point and whole area of the zinc electrode surface after different time exposure. Figure 12 confirms the EN analysis that after 4 dry-wet cycles, uniform corrosion is dominant. From EDX (not shown in paper), it is also clear to find the elements on the zinc alloy surface keeping relative constants after 1 d dry-wet treatment. During the first 0.5 h, the content of zinc element decreases, and after 8 h dry-wet cycle, massive dissolution of aluminum begins.
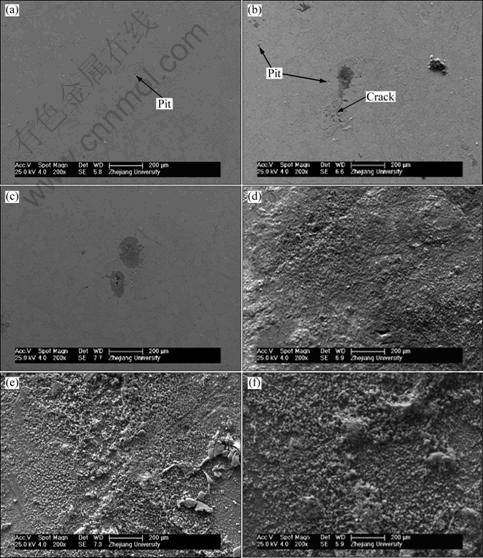
Fig. 12 SEM images of zinc alloy surface before treatment (a) and after dry-wet treatment for 0.5 h spray (b), 1 cycle (c), 3 cycles (d), 6 cycles (e) and 12 cycles (f) in 3.5% NaCl solution
The results of SEM and EDX indicate that the corrosion in 7.3% Na2SO4 is not as serious as that in 3.5% NaCl solution. After the 1st cycle, the surface presents a great deal of small corrosion sites, shown in Fig. 13(c) and the mass fraction of zinc element decreases steadily. Figs. 13(d) and (e) show the SEM images of zinc alloy surface after 6 and 9 dry-wet cycles respectively, which show intergranular corrosion [23]. In Fig. 13(f), the metallic froths on the surface are found [24]. On the other hand, it seems an even layer of corrosion products covering on the surface, which can protect the substrate [5]. The increasing sulfur mass fraction indicates that zinc sulfate is formed as product film, which could be confirmed from Refs. [4, 5, 25], so the crack and protection coincide for the system. Both the zinc and aluminum mass fraction keep relatively constant.
The situation in simulated acid rain is similar to that in Na2SO4 solution. But from Fig. 14, lots of small pits appear on the surface after 1 h wet treatment, and hydrogen generation makes the surface rough. After 4 d exposure, cracks could be seen even with thick corrosion products, and a serious uniform corrosion is observed eventually. In the above shot noise theory analysis, the corrosion events are less massive in acid rain solution than that in NaCl solution. But from SEM photographs, dissolution seems to quickly happen in acid rain. The reason may be due to the corrosion attack on the surface in NaCl solution, resulting in a formation of thin ZnO film, even some Zn(OH)42- at higher pH area. The anodic reactions are more complex. But in simulated acid rain solution, the electrons lost directly and the reactions are less reversible. During the 4 d experiment, the element mass of zinc loses all the time, indicating the continuous dissolution of zinc. Zinc dissolution has more priority than aluminum, which is the same as that in NaCl solution.
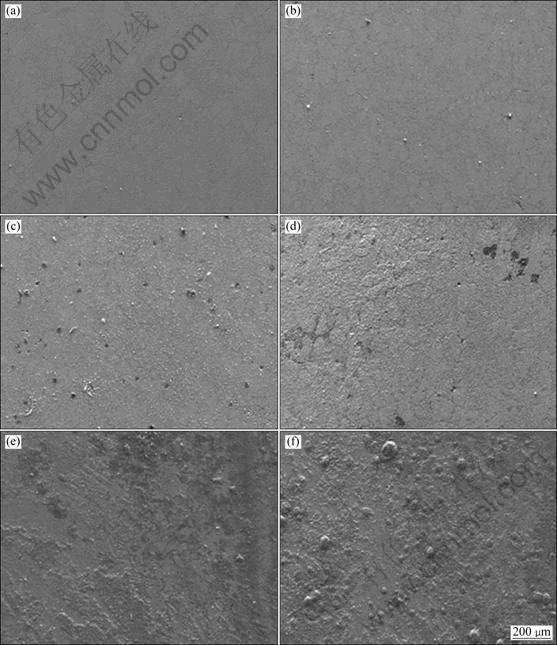
Fig. 13 SEM images of zinc alloy surface before treatment (a) and after dry-wet treatment of 1 cycle (b), 3 cycles (c), 6 cycles (d), 9 cycles (e) and 12 cycles (f) in 7.3% Na2SO4 solution
With regard to the corrosion products, SEM analysis is defeated to detect true morphology of electrodes. Figure 15 exhibits the additional three images of zinc electrodes after removing products using saturated CHCOONH4 solution. Figure 15(a) shows the surface morphology after 4 d exposure to periodic dry-wet condition in 3.5% NaCl solution, while Figs. 15(b) and (c) show images in 7.3 % Na2SO4 and simulated acid rain solutions, respectively. It has been noted that corrosion area in 3.5% NaCl is more extensive than in 7.3% Na2SO4 solution. In 7.3% Na2SO4 or simulated acid rain solutions, the corrosion exceeds in depth. Figure 15(b) also confirms that the type of zinc corrosion in tested Na2SO4 solution is more localized.
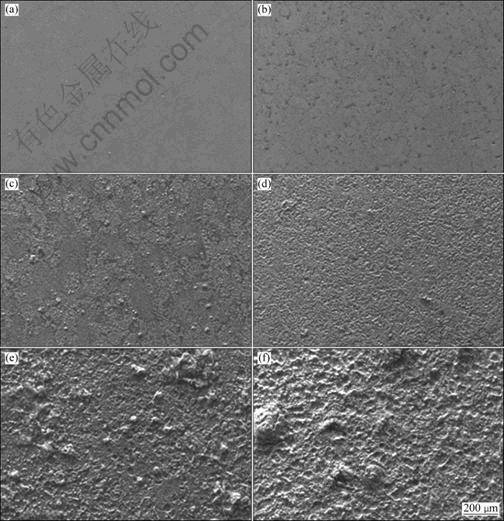
Fig. 14 SEM images of zinc alloy surface before treatment (a) and after dry-wet treatment for 0.5 h spray (b), 1 cycle (c), 3 cycles (d), 6 cycles (e) and 12 cycles (f) in simulated acid rain solution
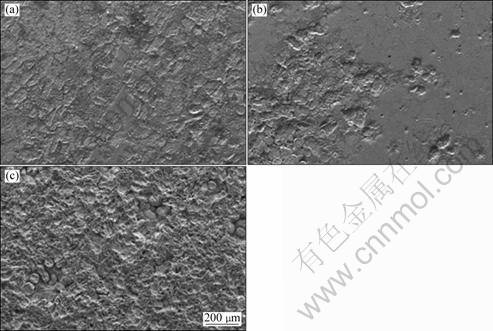
Fig. 15 SEM images of zinc alloy after 4 d of exposure in 3.5% NaCl solution (a), in 7.3% Na2SO4 solution (b) and in simulated acid rain (c) after pickling
5 Conclusions
1) Cumulative probability curves of fn indicate that the corrosion events in the dry cycles are greater than those in the wet cycles. Massive transformation of electrons was observed in the NaCl solution compared with more localized transformation in the Na2SO4 solution, which is evidenced by FWT and SEM. r(t) predicting the density of corrosion probability was calculated. When diffusion controls the reactions, r(t) decreases with increasing time. The r(t) values for uniform corrosion and diffusion controlled process are the largest in the wet cycle in 3.5% NaCl solution. The values of r(t) for pitting corrosion in Na2SO4 solution are observed to become larger during spraying periods, and r(t) for pitting corrosion has the largest value in the Na2SO4 solution. The 2nd to the 4th crystals of EDP have the highest energy in acid rain solution, which means that intergranular corrosion of zinc is serious in the simulated acid rain solution.
2) SEM observation of the specimens exposed to 3.5% NaCl solution shows incipient corrosion at isolated points on the surface after 1 cycle. After 3 cycles, the range of corrosion increases and the type of corrosion gradually becomes uniform. However, at the first few hours of specimens in 7.3% Na2SO4 and simulated acid rain solution, a number of corrosion events occur and lots of craters appear. The crystals have a laminar shape and grow irregularly. After 1 d of exposure to Na2SO4, on the surface of zinc alloy a very thin film forms through a chemical oxidation mechanism, which makes an effect on separating the anodic and cathodic regions. The mass fraction of zinc keeps about 50% after 1 d of exposure for specimens in Na2SO4 solution, and decreases during the entire exposure time in acid rain solution.
References
[1] SHI Yan-yan, ZHANG Zhao, ZHANG Jian-qing, CAO Chu-nan. Review of atmospheric corrosion of zinc and zinc alloy [J]. Journal of Chinese Society for Corrosion and Protection, 2005, 25(6): 373-379. (in Chinese)
[2] PERSSON D, MIKHAILOV A, THIERRY D. In situ studies of the corrosion during drying of confined zinc surfaces [J]. Mater Corros, 2007, 58(6): 452-462.
[3] EL-MAHDY G A. Electrochemical impedance study on brass corrosion in NaCl and (NH4)2SO4 solutions during cyclic wet-dry conditions [J]. J Appl Electrochem, 2005, 35(3): 347-353.
[4] QU Qing, LI Lei, BAI Wei, YAN Chuan-wei. Initial atmospheric corrosion of zinc in presence of Na2SO4 and (NH4)2SO4 [J]. Trans Nonferrous Met Soc China, 2006, 16(4): 887-891.
[5] CHEN Z Y, PERSSON D, LEYGRAF C. Initial NaCl-particle induced atmospheric corrosion of zinc―Effect of CO2 and SO2 [J]. Corros Sci, 2008, 50(1): 111-123.
[6] SHI Y Y, ZHANG Z, SU J X, CAO F H, ZHANG J Q. Electrochemical noise study on 2024-T3 aluminum alloy corrosion in simulated acid rain under cyclic wet-dry condition [J]. Electrochim Acta, 2006, 51(3): 4977-4986.
[7] SANCHEZ-AMAYA J M, COTTIS R A, BOTANA F J. Shot noise and statistical parameters for the estimation of corrosion mechanisms [J]. Corros Sci, 2005, 47(12): 3280-3299.
[8] GARC?A-OCHOA E, GONZ?LEZ-S?NCHEZ J, CORVO F, USAGAWA Z, DZIB-P?REZ L, CASTA?EDA A. Application of electrochemical noise to evaluate outdoor atmospheric corrosion of copper after relatively short exposure periods [J]. J Appl Electrochem, 2008, 38(10): 1363-1368.
[9] MANSFELD F, SUN Z, HSU C H. Electrochemical noise analysis (ENA) for active and passive systems in chloride media [J]. Electrochimica Acta, 2001, 46(24-25): 3651-3664.
[10] COTTIS R A. Interpretation of electrochemical noise data [J]. Corrosion, 2001, 57(3): 265-285.
[11] ZHANG T, LIU X L, SHAO Y W, MENG G Z, WANG F H. Electrochemical noise analysis on the pit corrosion susceptibility of Mg-10Gd-2Y-0.5Zr, AZ91D alloy and pure magnesium using stochastic model [J]. Corros Sci, 2008, 50(12): 3500-3507.
[12] AL-MAZEEDI H A A, COTTIS R A. A practical evaluation of electrochemical noise parameters as indicators of corrosion type [J]. Electrochim Acta, 2004, 49(17-18): 2787-2793.
[13] NA K H, PYUN S I. Effect of sulphate and molybdate ions on pitting corrosion of aluminium by using electrochemical noise analysis [J]. J Electroanal Chem, 2006, 596(1): 7-12.
[14] ZHANG X L, JIANG Z H, YAO Z P, SONG Y, WU Z D. Effects of scan rate on the potentiodynamic polarization curve obtained to determine the Tafel slopes and corrosion current density [J]. Corros Sci, 2009, 51(3): 581-587.
[15] ZHANG Jian-qing, ZHANG Zhao, WANG Jian-ming, CAO Chu-nan. Analysis and application of electrochemical noise (I). Theory of electrochemical noise analysis [J]. Journal of Chinese Society for Corrosion and Protection, 2001, 21(5): 310-320. (in Chinese)
[16] NA K H, PYUN S I. Electrochemical noise analysis of corrosion of pure aluminium in alkaline solution in the presence of SO42- ion, NO3- ion and Na2S [J]. Electrochim Acta, 2007, 52(13): 4363-4373.
[17] CAO F H, ZHANG Z, SU J X, SHI Y Y, ZHANG J Q. Electrochemical noise analysis of LY12-T3 in EXCO solution by discrete wavelet transform technique [J]. Electrochim Acta, 2006, 51(7): 1359-1364.
[18] CASTANO J G, FUENTE D, MORCILLO M. A laboratory study of the effect of NO2 on the atmospheric corrosion of zinc [J]. Atmos Environ, 2007, 41(38): 8681-8696.
[19] FIGUEIRA N, SILVA T M, CARMEZIM M J, FERNANDES J C S. Corrosion behaviour of NiTi alloy [J]. Electrochim Acta, 2009, 54(3): 921-926.
[20] GALVELE J R. Tafel’s law in pitting corrosion and crevice corrosion susceptibility [J]. Corros Sci, 2005, 47(12): 3053-3067.
[21] MAGAINO S, SOGA M, SOBUE K, KAWAGUCHI A, ISHIDA N, IMAI H. Zinc corrosion in simulated acid rain [J]. Electrochimica Acta, 1999, 44(24): 4307-4312.
[22] ZHANG Z, LENG W H, CAI Q Y, CAO F H, ZHANG J Q. Study of the zinc electroplating process using electrochemical noise technique [J]. J Electroanal Chem, 2005, 578(2): 357-367.
[23] CHENG Y L, ZHANG Z, CAO F H, LI J F, ZHANG J Q, WANG J M, CAO C N. Study of the potential electrochemical noise during corrosion process of aluminum alloys 2024, 7075 and pure aluminum [J]. Mater Corros, 2003, 54(8): 601-608.
[24] SU Jing-xin, ZHANG Zhao, CAO Fa-he, ZHANG Jian-qing, CAO Chu-nan. Exfoliation corrosion behavior of T6 treated 2090 Al-Li alloy in EXCO solution and EIS during exfoliation corrosion evolution [J]. Acta Metall Sin, 2005, 41(9): 974-978. (in Chinese)
[25] CASTANO J G, ARROYAVE C, MORCILLO M. Characterization of atmospheric corrosion products of zinc exposed to SO2 and NO2 using XPS and GIXD [J]. J Mater Sci, 2007, 42(3): 9654-9662.
陈安娜1,曹发和1,刘文娟1,郑利云1,张 昭1,张鉴清1, 2,曹楚南1, 2
1. 浙江大学 化学系,杭州 310027;
2. 中国科学院 金属研究所 金属腐蚀与防护国家重点实验室,沈阳 110016
摘 要:采用电化学噪声理论,研究锌合金(ZnAl4Cu1)在3.5%(质量分数)NaCl, 7.3%(质量分数)Na2SO4和模拟酸雨溶液中干湿循环条件下的腐蚀行为。采用快速傅里叶变换(FFT)、快速小波变换(FWT)和散粒噪声理论结合统计方法分析原位电化学电位噪声。散粒噪声分析的fn累计曲线图表明,在干循环中电子转移事件的频率高于湿循环中的,在NaCl溶液中的腐蚀比在Na2SO4中的腐蚀更均匀,腐蚀事件的条件产生速率r(t)对于受扩散控制的事件来说随着干湿循环时间的延长而降低。锌合金在NaCl溶液中湿循环时,均匀腐蚀和扩散控制的事件的r(t)值最大;在Na2SO4溶液中湿循环时,点蚀事件的r(t)值最大。在酸雨溶液中可明显观察到锌合金的晶间腐蚀。
关键词:电化学噪声;散粒噪声分析;干湿循环;锌合金
(Edited by YANG Hua)
Foundation item: Projects (51131005, 51171172, J0830413) supported by the National Natural Science Foundation of China; Project (Y4110074) supported by Zhejiang Provincial Natural Science Foundation, China
Corresponding author: CAO Fa-he; Tel: +86-571-87952318; Fax: +86-571-87951895; E-mail: nelson_cao@zju.edu.cn
DOI: 10.1016/S1003-6326(11)61165-5

