J. Cent. South Univ. Technol. (2011) 18: 1667-1676
DOI: 10.1007/s11771-011-0887-z
Influence of features of natural soft clay on behaviour of embankment
YIN Zhen-yu(������)1, M. Karstunen2, WANG Jian-hua(������)1, YU Chuang(�ള)3
1. Center for Marine Geotechnics Research, Department of Civil Engineering,
Shanghai Jiao Tong University, Shanghai 200240, China;
2. Department of Civil Engineering, University of Strathclyde, John Anderson Building, 107 Rottenrow, Glasgow G4 0NG, UK;
3. Department of Civil Engineering, Wenzhou University, Wenzhou 325035, China
? Central South University Press and Springer-Verlag Berlin Heidelberg 2011
Abstract: The influence of different features of natural soft clays, namely anisotropy, destructuration and viscosity, on modelling the time-dependent behaviour of Murro embankment was investigated. The newly developed elasto-viscoplastic models were enhanced for determining viscosity parameters in a straightforward way and adopted for the finite element analysis. The same set of common parameters determined from conventional triaxial and oedometer tests was employed for all models, with additional parameters required for representing different soil features. The finite element predictions by using models coupled with BIOT��s consolidation theory were compared with each other and with field data for settlement, horizontal displacement and excess pore pressures. In addition, the stress paths under the embankment loading were also compared with each other to improve the understanding of the effect of different soil features. All simulations demonstrate that all three features significantly influence the predictions. As a consequence, accounting for soil features needs to be carefully considered when they are applied to a construction site.
Key words: viscosity; anisotropy; destructuration; soft clay; embankment; viscoplasticity
1 Introduction
The stress-strain behaviour of natural soft clay is very complex, as different fundamental features of natural soil behaviour, such as viscosity, anisotropy and destructuration, influence the soil response to foundation loading [1-6]. Thus, design and construction of embankments on soft soil deposits is still a challenge. In the literature, some of the features have been considered on modelling the behaviour of embankments on soft soils [1-4], but none of them discussed the influence of all these three features on the behaviour of embankments on soft soils. KARSTUNEN and YIN [7] simulated a test embankment on Murro clay in Finland by using a newly developed elasto-viscoplastic model by YIN and KARSTUNEN [8]. Comparisons between simulations and measurements validate the predictive ability of the model. However, the influence of viscosity, anisotropy and destructuration on the behaviour of embankment has not been discussed. Furthermore, it was noticed that the determination of model parameters (YIN and KARSTUNEN [8]) requires curve fitting, which makes the model less efficient for engineering practice.
Since on natural soft clays all these features play a role during the plastic straining, the aim of this work is to investigate the influence of soil viscosity, anisotropy and destructuration on the delayed behaviour of embankment on soft clay. For this purpose, the Murro test embankment was selected because of its relatively complete field data and its construction site with typical soft clay deposits. For the analysis, firstly an elasto- viscoplastic model based on Modified Cam Clay model (noted as EVP-MCC, developed by YIN and HICHER [9]) was used for the simulations. The extended anisotropic version of the model, called EVP-SCLAY1, incorporated the effect of initial and plastic strain induced anisotropy via initial inclination and subsequent rotation of the yield surface, similarly to the S-CLAY1 model (WHEELER et al [10]). Finally, a new EVP model, EVP-SCLAY1S, by YIN and KARSTUNEN [8] was used to account for all three soil features. EVP-SCLAY1S is a hierarchical elasto-viscoplastic model, and it is possible via selection of values for soil constants to switch various features on and off, reducing the model to EVP-SCLAY1 and EVP-MCC accordingly. In addition, an additional run was made to investigate the effect of viscosity on the predicted response.
Also, it is noticed that the determination of model parameters in a straightforward way is very important for the use of the model in practice. For this purpose, in the present work, EVP models mentioned above were enhanced by modifying the scaling function of viscoplastic strain-rate and providing a straightforward way to determine the viscosity parameters.
Firstly, the constitutive models are briefly described, and the modification of models is presented with providing a straightforward way of determining the viscosity parameters. Then, the Murro test embankment with its foundation soil is briefly presented. The derivation of values for soil constants is discussed. Using the selected parameters for all models, finite element analyses are carried out, using the same finite element mesh for all analyses. The analyses are performed with updated mesh and steady-state groundwater flow, which is necessary for the case of embankment that settles partly below the ground water table. The model predictions are then compared to investigate the effect of soil features on the embankment behaviour.
2 Elasto-viscoplastic models
2.1 Newly developed models
YIN and KARSTUNEN [8] have developed an elasto-viscoplastic model, called EVP-SCLAY1S, accounting for soil viscosity, anisotropy and destructuration. The model is based on the overstress theory of PERZYNA [11-12] and elasto-plastic model S-CLAY1S (KARSTUNEN et al [1]). According to PERZYNA��s overstress theory, the total strain rate is additively composed of the elastic strain rates and viscoplastic strain rates:
 (1)
(1)
where  denotes the (i,j) component of the total strain rate tensor, and the superscripts ��e�� and ��vp�� stand, respectively, for the elastic and the viscoplastic components.
The elastic behaviour in the proposed model is assumed to be isotropic, similar to the Modified Cam Clay model (ROSCOE and BURLAND [13]). The viscoplastic strain rate  in Eq.(1) is assumed to obey an associated flow rule with respect to the dynamic loading surface following the original proposal by PERZYNA [11-12]:
 (2)
(2)
where �� is referred to as the fluidity parameter; ��(F) is the overstress function representing the difference between the dynamic loading surface (fd) and the static yield surface  fd is the viscoplastic potential function, represented by the dynamic loading surface explained as follows.
An exponential type of scaling function is adopted:
 (3)
(3)
where N is the viscosity index (or strain rate coefficient). N and �� are therefore the key parameters controlling the viscoplastic strain-rate.  and
and  represent the size of dynamic loading surface and the size of static yield surface, respectively.
Following the ideas by WHEELER et al [10], an elliptical surface is adopted as the dynamic loading surface, relating to the current stress state:
 (4)
(4)
where ��d is deviatoric fabric tensor, a dimensionless vector with the same form as deviatoric stress vector [10]; M is the slope of the critical state line. For the special case of a cross-anisotropic sample, the scalar parameter  defines the inclination of the ellipse of the yield curve in q-p�� plane, as illustrated in Fig.1(a). The static yield surface has an identical shape, but a different size (see Fig.1(a)) compared with the dynamic loading surface.
The intrinsic yield surface is assumed again to have similar shape, with size defined via pmi, which is related to the size of the static yield surface with bonding parameter �� (Fig.1(a)):
 (5)
(5)
The expansion of the intrinsic yield surface, which represents the intrinsic hardening of the material, is assumed to be due to the inelastic volumetric strain  similar to the critical state models:
 (6)
(6)
where ��i is the slope of the intrinsic normal compression curve in the e-ln plane for a stress path at constant stress ratio involving no change of anisotropy (such as isotropic loading of an isotropic sample, or oedometer test on a reconstituted sample, see Fig.1(b)),
  is the slope of the swelling-line and e is the void ratio.
The rotational hardening law, based on the formulation proposed by WHEELER et al [10], describes the development or erasure of anisotropy caused by viscoplastic strains. Both volumetric and deviatoric viscoplastic strains influence the rotation of the yield curve:
 (7)
(7)
where the soil constant �� controls the rate at which the components of the deviatoric fabric tensor heads toward their current target values, which depend on the stress path, and ��d controls the relative effect of viscoplastic deviatoric strains in rotating the yield and loading surfaces. According to WHEELER et al [10], LEONI et al [14] and YIN et al [15], the anisotropy parameters can be obtained from M by
 (8)
(8)
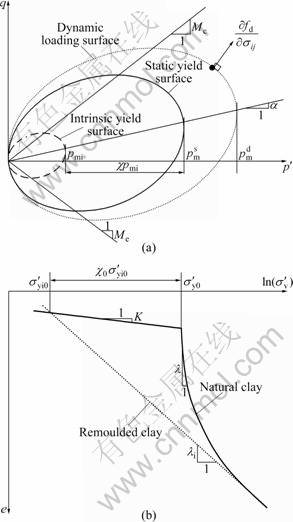
Fig.1 Definition of surfaces and parameters of EVP-SCLAY1S model in triaxial space (a) and one-dimensional space (b)
The amount of particle bonding is described with a scalar state variable ��, which changes due to bond degradation ultimately to zero, analogously to the S-CLAY1S model [1]:
 (9)
(9)
where the soil constant �� controls the absolute rate of destructuration and ��d controls the relative effect of viscoplastic deviatoric strains in destroying the bonds; ��0 is the initial amount of bonding, which relates to the sizes of the intrinsic yield surface and static yield surfaces as
 (10)
(10)
Taking into account of the elastic stress-strain relations, the constitutive equations of the proposed model for structured clays are derived as

 (11)
(11)
where  is the deviatoric stress rate tensor
 p�� is the mean effective stress (p��=
 G is the elastic shear modulus, which is related to the elastic bulk modulus (K=(1+e)p��/��) by assuming a constant value of Poisson ratio
  (G=3(1-2)K/2(1+)); ��ij is Kronecker delta with ��ij=1 for i=j and? ��ij=0 for i��j.
The model was implemented into 2D Plaxis v.8 as a user defined model. By switching on/off certain parameters, the model is reduced to EVP-SCLAY1 (��0= ��=��d=0) and ultimately to EVP-MCC (��0=��=��d=0 and ��0=��=��d=0). The basic finite element scheme for the proposed model is similar to that presented in Refs.[3-4]. For a coupled consolidation analysis based on BIOT��s theory, the relationship of the load increment is given by applying the principle of virtual work to the equilibrium equation [3-4] as

 (12)
(12)
The coupled finite element equations are well documented by several researchers [3-4, 9], and not repeated here. By using the coupled consolidation analysis based on BIOT��s theory provided in Plaxis with the proposed model, consolidation analyses of boundary value problem can be carried out.
The input parameters for the model EVP-SCLAY1S with its determining method can be found in Ref.[7]. It should be noted that the determination of the parameters does not require additional tests compared with that for the Modified Cam Clay model. Unfortunately, the determination of viscosity parameters requires curve fitting, which makes the model less efficient for engineering practice.
2.2 Modification for elasto-viscoplastic models
In order to improve the determination of viscosity parameters in a straightforward way, the modification of EVP-SCLAY1S is presented.
As presented in the previous section, the viscosity parameters are introduced by the exponential type scaling function Eq.(3). Another type of scaling function, the power type, can also be found for viscoplastic models, e.g. HINCHBERGER and ROWE [3]. In their model, the parallel yield surface tangents are used as the measure of overstress distance. Although the model has good performance on predicting the time-dependency of clay, the viscosity parameters still need to be determined by curve fitting.
Different from HINCHBERGER and ROWE [3], in this modified version of EVP-SCLAY1S model, the scaling function is proposed directly based on the sizes of static yield surface and dynamic loading surface adopting the power type formulation as
 (13)
(13)
Equation (3) is then replaced by Eq.(13) for the modified model.
The determination of parameters N and �� is discussed based on the same conventional oedometer test. Due to the elliptic-shaped yield surface adopted in this model, the relationship 
 (
( is the principle image stress tensor of current stress tensor on the static yield surface) can be obtained for an arbitrary constant stress ratio ��. Thus, for the case of K0-consolidation, the relationship between the apparent preconsolidation pressure (equal to the current vertical stress) and the size of surfaces is given by
  Also for the initial yield stresses,
  is obtained. The
  represents the size of elastic region which is smaller than the preconsolidation pressure obtained from conventional oedometer test. Thus, based on Eqs.(2), (4) and (13), the viscoplastic strain-rate under K0-consolidation can be derived as
 (14)
(14)
Equation (14) implies that the relationship between the applied strain-rate (viscoplastic strain-rate is one part of strain-rate) and the measured apparent preconsolidation pressure . can be the preconsolidation pressure from the conventional oedometer test when
  corresponds to this conventional test.
Based on the conventional oedometer test, VERMEER et al [16] also proposed the viscoplastic strain-rate under one-dimensional loading condition:
 (15)
(15)
where ��=24 h for conventional oedometer test, C��e is the secondary compression coefficient,  is the reference preconsolidation pressure (initial value of is the preconsolidation pressure from conventional test). Equation (15) can also predict the initial apparent preconsolidation pressure (
 ) corresponding to an applied strain-rate. The linear relationship for
  with a slope (��-��)/C��e is implied by this equation.
In Eq.(14) the parameter N is always larger than 10 (see YIN and HICHER [9]). Generally, the value of  is selected resulting in the ratio
  then
then  is approximately obtained. Then, by comparing Eq.(14) with Eq.(15), in order to keep the slope of linear relationship
 proposed by VERMEER et al [16], N is obtained as
 (16)
(16)
Furthermore, if using both models (Eq.(14) and Eq.(15)) to predict an apparent preconsolidation pressure equal to the preconsolidation pressure from conventional oedometer test  the following relation can be obtained:

 (17)
(17)
For undisturbed soil samples with good quality, due to the loading rate effect,  from conventional oedometer tests (one day duration for each loading increment) is generally larger than the in-situ effective stress
  under which soils have been deposited for hundreds of years. For the convenience,
  is assumed for Murro clay based on experimental observations. The parameter �� can then be obtained by Eq.(18) reduced from Eq.(17) as
 (18)
(18)
Equation (18) suggests that a small value of �� represents high viscosity with which the soil has large value of OCR ( ). Using Eqs.(16) and (18), the viscosity parameters can be calculated directly from ��i, ��, C��e with ��=24 h obtained from conventional oedometer tests on reconstituted clay samples and from intact samples. For the convenience, in the present work,
the C��e and POPr ( ) are used as viscosity parameters instead of N and ��.
The modification is applied to all above mentioned elasto-viscoplastic models (EVP-MCC, EVP-SCLAY1 and EVP-SCLAY1S). All models are then enhanced by this modification.
3 Murro test embankment
3.1 Finite element model
Murro test embankment is an instrumented test embankment on a soft clay deposit, which has been subjected to the previous studies [1, 7, 17]. The geometry of the benchmark embankment is shown in Fig.2. The groundwater table is located at the depth of 0.8 m. Drained conditions and zero initial pore pressures are assumed above the water table, while the other boundaries were assumed to be undrained (closed). The domain to be analyzed (under plane strain conditions) has an extent of 36 m in the horizontal direction from the symmetry axis and 23 m in the vertical direction. The lateral boundaries are restrained horizontally, and the bottom boundary is restrained in both directions. Due to the symmetry, only half of the embankment is represented in the finite element mesh.
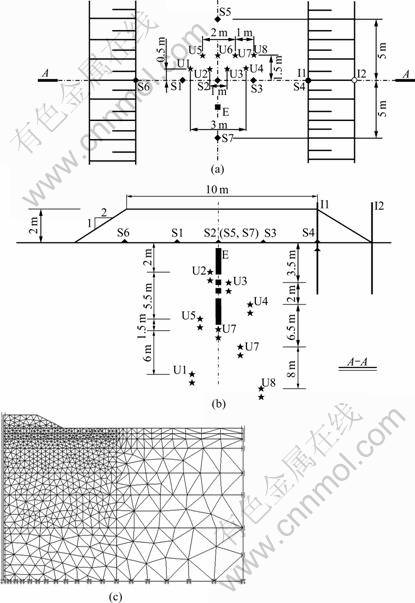
Fig.2 Murro test embankment with details of instrumentation: (a) Plan; (b) Cross section; (c) Finite element model
The construction and the subsequent consolidation of Murro embankment were simulated by using two-dimensional (2D) finite element code PLAXIS into which the EVP-SCLAY1S model was implemented as a user-defined model. The finite element mesh is composed of 1 456 15-noded triangular elements resulting in 3 019 nodes. Mesh-sensitivity studies were done to ensure that the mesh was dense enough to produce accurate results. The embankment loading was reproduced by increasing the unit weight of the elements of the embankment fill within two days.
The embankment material is crushed rock (biotite gneiss) with a grain size of 0-65 mm. A simple linear elastic-perfectly plastic Mohr Coulomb model was adopted to model the stress-strain behaviour of the embankment fill. The typical values of model parameters, as proposed by KARSTUNEN et al [1], are summarized as: elastic modulus E=40 000 kN/m2, Poisson ratio  0.35, critical state friction angle
  40o, dilation angle ��=0o and unit weight ��=19.6 kN/m3. A small value of apparent cohesion c��=2 kN/m2 is assumed to improve the numerical convergence. The problem is dominated by the soft soil response and is hence rather insensitive to the embankment parameters.
3.2 Parameters of foundation soil for constitutive models
KARSTUNEN and YIN [7] presented parameters determination for foundation soils from conventional triaxial and oedometer tests when simulating Murro test embankment by using EVP-SCLAY1S. All tested samples were intact from the construction site with physical properties summarized in Table 1. The selected values of parameters (excluding viscosity parameters) were adopted in this work (see Table 1), and the details for the determination of parameters are not repeated here. Simulations by EVP-SCLAY1 were carried out using ��0=��=��d=0 and keeping other parameters the same. Simulations by EVP-MCC assumed additionally that ��0= ��=��d=0 and ��0=��=��d=0 keeping other parameters the same.
For viscosity parameters, POPr and C��e were measured from conventional oedometer tests on intact samples and reconstituted samples, respectively. The average values for different soil layers are summarized in Table 2.
Table 1 Average values for physical properties of Murro clay
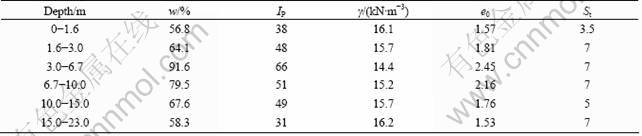
Table 2 Values of parameters of EVP-SCLAY1S model for Murro clay
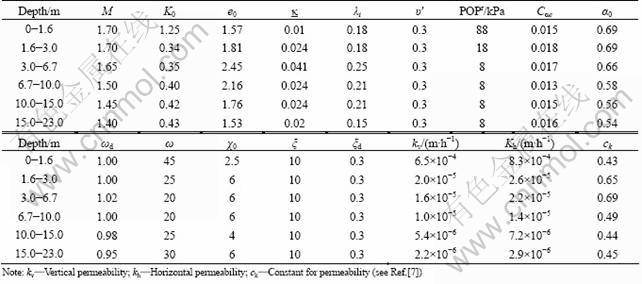
In order to investigate the effect of viscosity, an additional prediction by EVP-SCLAY1S was made with a half of values of POPr ?listed in Table 1 for each layer (small OCR represents low viscosity, as discussed in Eq.(17)). The results for this case are referred to as ��low viscosity��.
4 Influence of soil features on embankment behaviour
4.1 Settlements
Figures 3(a) and (b) show the surface settlements under the centreline of the embankment predicted by models with different considerations of soil behaviour. Major differences are found between the predictions by different models after ten days of construction, especially during later stages of consolidation. Comparing the predicted settlements by EVP-SCLAY1 with that by EVP-MCC, it is clear that the incorporation of soil anisotropy results in larger settlement than in the isotropic case. Accounting for initial bonding, the destructuration (by EVP-SCLAY11S) further increases the predicted settlement significantly. The predicted settlement with low viscosity model is larger than the one predicted by the standard viscosity during the early consolidation stage, but converges to the same level during creep. This means that the higher viscosity delays the occurrence of deformations. Figure 3(c) shows the settlements at a depth of 3.4 m under the centreline of the embankment predicted by models with different considerations of soil behaviour. The differences between the predictions by different models become apparent from 180 d after the construction. Again, EVP- SCLAY1S predicts the largest settlement. For this selected depth, there is no difference between high viscosity and low viscosity.
Figure 4 shows the surface settlements immediately after the construction of the embankment and at 3 058 d after the construction, which agree with the time- settlement curves (Figs.3(a) and (b)). This implies that the effects of soil features on settlements behaviour for other positions underneath the embankment are the same. As for the long-term behaviour, the settlements develop fast during the consolidation and become slow towards the full dissipation of excess-pore pressure (39 years after the construction) for all cases. The predicted settlements continue to increase due to soil viscosity still after the full dissipation of excess pore pressures.
4.2 Horizontal displacements
Figure 5 presents the predicted horizontal displacements corresponding to inclinometer I1 (see Fig.2) by all models. At the end of the construction (labelled ��immediately after the construction�� in figures), the predicted displacements by all models are almost the same. At 3 201 d after the construction, the model EVP- MCC predicts the smallest displacements. The consideration of anisotropy increases slightly the displacements. The model considering initial bonding and debonding process predicts much larger displacements than other models. The predicted displacements with lower viscosity at the end of construction are much larger than the predictions by other models corresponding to the larger settlements in Fig.4(a), but at 3 201 d after the construction they return to the same level as the ones with high viscosity model, corresponding to the same level of settlements (Fig.4(b)).
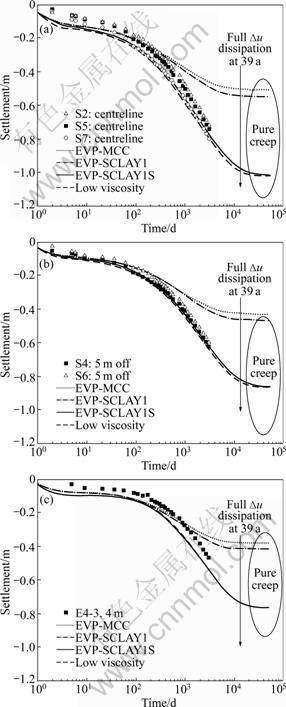
Fig.3 Surface settlements of embankment predicted by different models: (a) Underneath embankment at centerline; (b) Under- neath embankment 5 m from centerline; (c) At 3.4 m depth under centerline
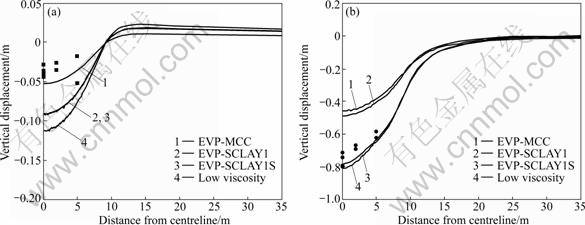
Fig.4 Surface settlements at different time: (a) Immediately after construction; (b) 3 058 d after construction
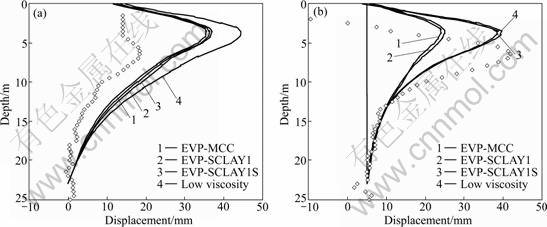
Fig.5 Horizontal displacements at I1: (a) Immediately after construction; (b) 3 201 d after construction
Figure 6 presents the evolution of the ratio of maximum horizontal displacement at I1 (Ux)max to the maximum vertical settlement (Uy)max as a function of time, comparing the model predictions with the field data estimated from the horizontal displacements of I2 and surface settlements at centreline. The isotropic model predicts the lowest ratio at the early consolidation stage and the highest stable ratio at the later consolidation stage. Whilst, the model with initial bonding and destructuration predicts the highest ratio at the early consolidation stage and the lowest stable ratio at the later consolidation stage. It is noted that there is no difference between predicted ratios by EVP-SCLAY1S using high viscosity and using low viscosity.
4.3 Excess pore pressure
Figure 7 shows the model predictions for excess pore pressure in the foundation soil under centreline at a depth of 3.5 m. All model predictions are rather similar during the construction and the subsequent consolidation. As expected, all numerical simulations show excess pore pressures gradually dissipating with time. The predicted excess pore pressure with low viscosity is much higher during the consolidation than that with high viscosity, while the anisotropy and destructuration have only a slight influence generated during construction and during early stage of consolidation. The models without considering bonds predict faster dissipation of excess pore pressure.
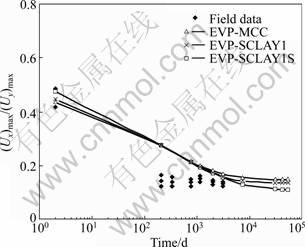
Fig.6 Ratio of horizontal maximum displacements to vertical maximum settlements
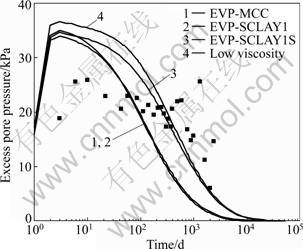
Fig.7 Excess pore pressures at position U3 (3.5 m depth and 0.5 m from centerline)
4.4 Stress paths
In order to improve the understanding of the embankment behaviour with different considerations of the soil features, a point at a depth of 3.5 m underneath the embankment centreline was selected. Figure 8 shows that the stress paths predicted by different models reflect the evolution of effective stresses during the construction of the embankment and subsequent consolidation. All models predict undrained viscoplastic behaviour until a stress state corresponding to the end of construction, (indicated with solid dots). This stress state is different from one model to another due to different considerations of soil behaviour. Due to the effect of creep, ?u increases for a while even though the consolidation boundaries have been opened. For the subsequent consolidation stage with the dissipation of excess pore pressures, the anisotropic versions of the model result in an incremental stress ratio that corresponds approximately to JAKY��s K0=1-sinf��c, while a higher value of K0 (corresponding to lower ��) is predicted by isotropic model. Different stress paths are predicted by EVP-SCLAY1S with different viscosities during the embankment loading, which agrees with the different responses of excess pore pressure and displacements (settlements and horizontal displacements) between the predictions with low and high viscosity.
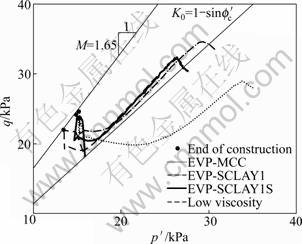
Fig.8 Stress path at 3.5 m in depth under centerline
5 Conclusions
1) The soil anisotropy has only slight influence on the predicted settlement at early consolidation stage and a major important effect on later stages. For horizontal displacements, the anisotropy has only slight influence during early consolidation stage, and results in larger value for later stages than that predicted by the isotropic model. For excess pore pressures, the soil anisotropy has only a slight influence on the predicted excess pore pressures during the embankment construction and its subsequent consolidation.
2) As for soil destructuration, significant influence on settlements can be found especially during the later consolidation stages. It also seems to be a minor influence on the predicted horizontal displacements for early consolidation stage, but significant influence for later consolidation stage. For excess pore pressures, the soil destructuration has only a slight influence during the embankment construction, but leads to slower dissipation rate during subsequent consolidation.
3) Concerning the soil viscosity, significant influence on settlements can be seen during the early consolidation stage, but this effect vanishes with time. Similar influence can also be seen on the predicted horizontal displacements. The soil viscosity has a major influence on the generation of the excess pore pressures during the embankment construction, as well as for their dissipation during subsequent consolidation, but not for the total time of full dissipation.
References
[1] KARSTUNEN M, KRENN H, WHEELER S J, KOSKINEN M, ZENTAR R. The effect of anisotropy and destructuration on the behaviour of Murro test embankment [J]. ASCE International Journal of Geomechanics, 2005, 5(2): 87-97.
[2] KARSTUNEN M, WILTAFSKY C, KRENN H, SCHARINGER F, SCHWEIGER H F. Modelling the behaviour of an embankment on soft clay with different constitutive models [J]. International Journal for Numerical and Analytical Methods in Geomechanics, 2006, 30(10): 953-982.
[3] HINCHBERGER S D, ROWE R K. Evaluation of the predictive ability of two elastic-viscoplastic constitutive models [J]. Canadian Geotechnical Journal, 2005, 42(6): 1675-1694.
[4] KELLN C, SHARMA J, HUGHES D, GRAHAM J. Finite element analysis of an embankment on a soft estuarine deposit using an elastic-viscoplastic soil model [J]. Canadian Geotechnical Journal, 2009, 46: 357-368.
[5] XU Li-sheng, LI Jian-zhong. Viscous property of dried clay [J]. Journal of Central South University of Technology, 2006, 13(2): 204-208.
[6] KONG Gang-qiang, YANG Qing, ZHENG Peng-yi, LUAN Mao-tian. Evaluation of group effect of pile group under dragload embedded in clay [J]. Journal of Central South University of Technology, 2009, 16(3): 503-512.
[7] KARSTUNEN M, YIN Z-Y. Modelling time-dependent behaviour of Murro test embankment [J]. G��otechnique, 2010, 60(10): 735-749.
[8] YIN Z-Y, KARSTUNEN M. Influence of anisotropy, destructuration and viscosity on the behaviour of an embankment on soft clay [C]// The 12th International Conference of International Association for Computer Methods and Advances in Geomechanics (IACMAG). Goa, India, 2008: 4728-4735.
[9] YIN Z-Y, HICHER P Y. Identifying parameters controlling soil delayed behaviour from laboratory and in situ pressuremeter testing [J]. International Journal for Numerical and Analytical Methods in Geomechanics, 2008, 32(12): 1515-1535.
[10] WHEELER S J, N??T?NEN A, KARSTUNEN M, LOJANDER M. An anisotropic elasto-plastic model for soft clays [J]. Canadian Geotechnical Journal, 2003, 40: 403-418.
[11] PERZYNA P. The constitutive equations for work-hardening and rate sensitive plastic materials [J]. Proceedings of Vibration Problems Warsaw, 1963: 281-290.
[12] PERZYNA P. Fundamental problems in viscoplasticity [J]. Adv Appl Mech, 1966, 9: 244-377.
[13] ROSCOE K H, BURLAND J B. On the generalized stress�Cstrain behaviour of ��wet�� clay. Engineering Plasticity [M]. Cambridge: Cambridge University Press, 1968: 553-609.
[14] LEONI M, KARSTUNEN M, VERMEER P A. Anisotropic creep model for soft soils [J]. G��otechnique, 2008, 58(3): 215-226.
[15] YIN Z-Y, CHANG C S, KARSTUNEN M, HICHER P Y. An anisotropic elastic viscoplastic model for soft soils [J]. International Journal of Solids and Structures, 2010, 47(5): 665-677.
[16] VERMEER P A, STOLLE D F A, BONNIER P G. From the Classical Theory of Secondary Compression to Modern Creep Analysis [C]// Proceedings of the 9th International Conference on Computer Methods and Advances in Geomechanics. Wuhan/China, Vol.4. Rotterdam: Balkema, 1997: 2469-2478.
[17] KOSKINEN M, KARSTUNEN M. Numerical modelling of Murro test embankment with S-CLAY1S [C]// Proc 6th European Conf Num Meth in Geotech Eng (NUMGE), Graz, Austria, 2006: 455-461.
(Edited by YANG Bing)
Foundation item: Project(11PJ1405700) supported by Pujiang Talent Plan of Shanghai, China; Project(41002091) supported by the National Natural Science Foundation of China; Project(PIAP-GA-2009-230638) supported by the European Community through the Program ��People��
Received date: 2010-07-22; Accepted date: 2011-02-28
Corresponding author: YIN Zhen-yu, Professor, PhD; Tel/Fax: +86-21-34207964; E-mail: zhenyu.yin@gmail.com

