
Simulation of polycrystalline aluminum tensile test with
crystal plasticity finite element method
SI Liang-ying(司良英)1, 2, L? Cheng(吕 程)2, K. Tieu2, LIU Xiang-hua(刘相华)1
1. State Key Laboratory of Rolling and Automation, Northeastern University, Shenyang 110004, China;
2. School of Mechanical, Materials and Mechatronic Engineering, University of Wollongong,
Northfields Avenue, Wollongong NSW 2522, Australia
Received 15 July 2007; accepted 10 September 2007
Abstract: The crystal plasticity was implemented in the finite element method(FEM) software ABAQUS through the user subroutine UMAT. By means of discretizing the space at the grain level with the Voronoi diagram method, a polycrystal model was built and used in the FEM analysis. The initial orientation of each grain was generated based on the orientation distribution function(ODF). The developed model was successfully applied in simulation of polycrystalline aluminium samples deformed by the tensile tests. The theoretical strain―stress relation was in good agreement with the experimental result. The simulation results show that the grain size has significant effect on the deformation behavior. The initial plastic deformation usually occurs at grain boundaries, and multiple slip often results in an enhanced local hardening at grain boundaries.
Key words: crystal plasticity finite element method; polycrystal modeling; Voronoi diagram; texture; face-centered cubic crystal
1 Introduction
In conventional forming processes, the deformation of metals is considered isotropy because the specimen is usually composed of a large number of grains and most grains are much small. In the development of the metal forming technology in thin strip rolling, miniaturization of the product and parts, where the size of some features may be similar to the grain size, and the heterogeneity of the deformation behavior attract more and more attentions. But the traditional elastoplastic or rigid-plastic finite element methods could not take these effects into account.
In recent years, the crystal plasticity finite element method(CPFEM) model has been widely developed to investigate the plastic deformation behavior of the Al single crystal experimentally and theoretically[1-5]. It has been found that the crystal orientation mainly rotates along the transverse direction during plain strain compression. Cubic and rotated cubic orientations are unstable, while Goss and Brass orientations are stable. Compared with single crystals, fewer researches have
been carried out on the simulation of polycrystalline. RABBE et al[6] investigated the influences of intrinsic and extrinsic origins on the formation of orientation gradients using a 3D crystal plasticity model with BCC and FCC binary-crystal structures. BORG[7] studied the influence of grain size on yield and flow stress with a simple crystal plasticity model of a three slip systems and a regular hexagon grain polycrystal. CHOI[8] calculated the stored energy of cold-rolled IF steel with a simple geometry polycrystal model.
In this work, a crystal plasticity finite element model was developed. A Voronoi diagram was used to generate the virtual polycrystalline microstructure. The effect of grain size and necking during the tensile test has been analyzed.
2 Theory of crystal plasticity
2.1 Kinematics of crystalline deformation
The crystalline material under load undergoes crystallographic slip due to dislocation motion on the active slip systems and elastic deformation including stretching and rotation of the crystal lattice[9-13].
The total deformation gradient(F) can be decomposed into two components:
 (1)
(1)
where X is the position of material points in the reference configuration and x the position of material points in the deformed configuration. F* represents the elastic lattice deformation and F p describes the flow of material by slip. In this work, the twelve {111}<110> slip systems are adopted.
A slip system α is specified by the slip direction vector s(α) and the normal vector to the slip plane m(α). They convert with the lattice when the lattice is stretched and rotated during the deformation. The slip direction vector s*(α) and the normal vector to the slip plane m*(α) in the deformed lattice are given by
 (2)
(2)
The crystalline slip is assumed here to obey Schmid’s law, i.e. the slipping rate in any particular slip system α is assumed to depend on the current σ solely through the so-called resolved shear stress or Schmid stress τ(α). From the general expression for the rate of working, there is
 (3)
(3)
2.2 Rate-dependent hardening model
In this study, the rate-dependent hardening model with the power law is employed, which relates with the resolved shear stress τ(α) and the shear strain rate on a slip system α. The slip at a slip system also obeys the Schmid law, which states that slip begins when the resolved shear stress reaches a critical value:
 (4)
(4)
where sgn(x) is the signum function,  is the reference value of the shear strain rate and n is the rate sensitive exponent. Both
  and n are the material parameters.
  is the critical resolved shear stress of the slip system α.
A linear hardening is assumed and the rate of change of the critical resolved shear stress is expressed as[9]
 (5)
(5)
 (6)
(6)
hαβ=qhαα α≠β (no sum on α) (7)
where hαβ is the instantaneous hardening moduli including the self hardening of each system (α=β) and latent hardening (α≠β), hαα is the self hardening moduli, q is a latent hardening parameter, γ0 is the reference value of slip, γ is the shear strain, τ0 is the initial critical resolved shear stress, τ1 is the breakthrough stress where large plastic flow initiates, h0 is the hardening modulus just after initial yield, hs is the hardening modulus during easy glide and fαβ represents the magnitude of the strength of a particular slip interaction between two slip systems α and β. The factor fαβ depends on the geometric relation between two slip systems. There are five constants for fαβ, namely a1(no junction), a2(Hirth lock), a3(coplanar junction), a4(glissile junction) and a5(sessile junction).
3 Two dimensional grains modeling
To study the polycrystal deformation, it is necessary to build a method to generate a number of virtual grains. In this study a Voronoi diagram approach was used to generate a number of two dimensional cells in terms of the measured grain size distribution[14]. Each cell represents a virtual grain. Given n points in the plane, the Voronoi diagram partitions a plane into n convex polygons (cells). Each cell contains exactly one generating point and every point in a cell is closer to its generating point than to any other.
Two groups of virtual grains with different average size have been generated by the Voronoi diagram method, as shown in Fig.1. There are 51 gains in a rectangle of 40 mm×6.25 mm in Fig.1(a), while there are 165 grains in Fig.1(b). They are defined as model A and model B in the following context. The average diameters for two groups of grains are 2.50 mm and 1.39 mm, respectively. Model B has the same average size with the measured samples. It is assumed that the orientation distribution function(ODF) is uniformly distributed in Euler space since the annealed high-purity aluminum has been simulated. Random orientation is assigned to each grain and the misorientation between it and its neighbor grains is calculated to ensure the misorientation larger than 15?. The mapped orientation is shown in Fig.1. In this figure, the orientation is displayed by different RGB color and the value of RGB is the location of the grain in Euler space.
Due to the symmetry, one quarter of the sample was simulated. In the initial step, the symmetric boundary conditions were applied on the symmetric planes, and the sample was tensioned till necking. In the FEM model, the numbers of the nodes of the two tensile test cases were 14 070 and 18 196 for model A and model B respectively, which can guarantee enough nodes in each grain.

Fig.1 Polycrystal with different grain sizes generated by Voronoi diagram method: (a) 51 grains; (b) 165 grains
4 Simulation results
The grains will elongate and rotate during the tensile test process. Because of the orientation difference between the grains, the deformation of the sample is not isotropic. The necking will happen when the strain reaches a certain level. To validate the developed model, the stress―strain curves are compared with the experimental results of the high-purity aluminum (99.99%) tensile test. In the experiments, the sample were annealed at 400 ℃ for 4 h to obtain large grains. The simulated strain―stress curves and the experimental one are compared in Fig.2. Model B used the same average grain size as the experimental sample. It is clear that the predicted strain―stress curve for Model B has a good agreement with the experimental results. Increasing error beyond the true strain greater than 0.1 may be caused by the random initial orientation, which is slightly different from the measured results.
Comparing the results of Model A and Model B in Fig.2 shows that as expected the grain size has a signifi-
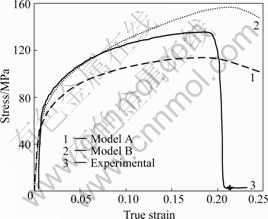
Fig.2 Strain―stress curves for different grain sizes
cant effect on the strength. The strength increases with the refinement of the grains. The maximum strength is enhanced from 113.5 MPa to 156.5 MPa as the average grain diameter is reduced from 1.39 mm to 2.50 mm.
Fig.3 shows the stress contour in the samples when the necking begins. It can be found that the stress concentrates at the grain boundary. That is because the deformation must be harmonious between the grains. Compared with the slip systems in the grain, the hardening of the slip systems around the boundary becomes larger because the dislocation slip here must overcome the grain boundary. The location of the necking does not occur at the middle of the sample, and actually it should be related to the texture of the sample.

Fig.3 Necking of deformed samples: (a) Model A; (b) Model B
Because of the initial orientation and the orientation difference between the grains, the samples have severe local stress concentration, which in turn causes the necking. The orientation evolution of the grains around the necking area was studied. In model B four grains in the necking area as shown in Fig.4 are picked up.

Fig.4 Sketch of four grains picked up around necking area in model B
The change of orientation for 4 points picked up from Fig.4 is displayed by the pole figure in Fig.5. The pole figure shows that textures of the grains around the necking area are profoundly changed during the deformation. The initial orientations are only points in the pole figure of Fig.5 for all the grains before deformation. After deformation, the orientation spreads in each grains as shown in Fig.6. This strongly demonstrates that the deformation is heterogeneous. It can been seen from Fig.5 and Fig.6 that the orientation rotates mainly along ND (thickness direction), which is different from the TD (transverse direction) rotation during rolling.

Fig.5 Pole figures of grains before deformation near necking area: (a) Grain A; (b) Grain B; (c) Grain C; (d) Grain D
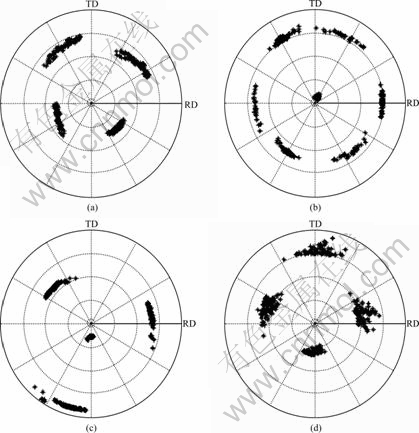
Fig.6 Pole figures of grains after deformation near necking area: (a) Grain A; (b) Grain B; (c) Grain C; (d) Grain D
5 Conclusions
1) The crystal plasticity theory based on ASARO et al with BASSANI’s hardening model is implemented in the FEM software ABAQUS through the user subroutine UMAT.
2) By means of discretizing the space at the grain size level with the Voronoi diagram method, a polycrystal model is built and used in the FEM analysis. The initial orientation of each grain is generated based on the orientation distribution function(ODF).
3) The developed model is successfully applied in the simulation of polycrystalline aluminium samples deformed by the tensile tests. The developed model is validated by comparing the theoretical strain―stress relation with the experimental result. The simulation results show that the grain size has significant effect on the deformation behavior. The initial plastic deformation usually occurs at grain boundaries, and multiple slip results in an enhanced local hardening at grain boundaries. The orientation around the necking area predominantly rotates around the thickness direction.
References
[1] WENK H R, van HOUTTE P. Texture and anisotropy [J]. Rep Prog Phys, 2004, 67: 1367-1428.
[2] ROTERS F. Application of crystal plasticity FEM from single crystal to bulk polycrystal [J]. Computational Materials Science, 2005, 32: 509-517.
[3] LIU Q, HANSEN N. Macroscopic and microscopic subdivision of a cold-rolled aluminium single crystal of cubic orientation [J]. Proc R Soc Lond A, 1998, 454: 2255-2592.
[4] WERT J A, LIU Q, HANSEN N. Dislocation boundary formation in a cold-rolled cube-oriented Al single crystal [J]. Acta Mater, 1997, 45: 2565-2576.
[5] ROTERS F. Application of crystal plasticity FEM from single crystal to bulk polycrystal [J]. Computational Materials Science, 2005, 32: 509-517.
[6] RAABE D, ZHAO Z, ROTERS F. Study on the orientational stability of cube-oriented FCC crystals under plane strain by use of a texture component crystal plasticity finite element method [J]. Scripta Materialia, 2004, 50: 1085-1090.
[7] BORG U. A strain gradient crystal plasticity analysis of grain size effects in polycrystals [J]. European Journal of Mechanics-A/Solids, 2007, 26: 313-324.
[8] CHOI S H. Simulation of stored energy and orientation gradients in cold-rolled interstitial free steels [J]. Acta Materialia,2003, 51: 1775-1788.
[9] Abaqus/explicit user’s manual (version 6.3) [M]. USA: Hibbitt, Karlsson and Sorensen Inc, 2002.
[10] ASARO R J, RICE J R. Strain localization in ductile single crystals [J]. J Mech Phys Solids, 1977, 25: 309-338.
[11] PEIRCE D, ASARO R J, NEEDLEMAN A. An analysis of nonumiform and localized deformation in ductile single crystals [J]. Acta Metall, 1982, 30: 1087-1119.
[12] ASARO R J. Crystal plasticity [J]. J App Mech, 1983, 50: 921-934.
[13] BASSANI J L, WU T Y. Latent hardening in single crystals (II): Analytical characterization and predictions [J]. Proc R Soc Lond A, 1991, 435: 21-41.
[14] AURENHAMMER F. Voronoi diagrams―A survey of a fundamental geometric data structure [J]. ACM Computing Surveys, 1991, 23(3): 345-405.
(Edited by YANG Bing)
Corresponding author: SI Liang-ying; Tel: +86-24-83688547; E-mail: yingsly@gmail.com

