
Simulation for microstructure evolution of Al-Si alloys in solidification process
XU Hong(徐 宏), HOU Hua(侯 华), ZHANG Guo-wei(张国伟)
School of Materials Science and Engineering, North University of China, Taiyuan 030051, China
Received 10 April 2006; accepted 25 April 2006
Abstract: The numerical simulation for microstructure evolution of Al-Si alloy in solidification process is carried out with phase field model. The phase field model, solution algorithm and the program of dendrite growth are introduced. The definition of initial condition, boundary condition and the stability condition of differential format are all included. The simulation results show that the evolution of dendrite morphology is as follows: the initial circle nucleus transforms to the rectangle one firstly, then its corners develop to the four trunks and from which the secondary side branches are generated and even the third side branches are produced from secondary ones. The dendrite tip radius decreases quickly at the initial stage and changes slowly at the late stage, which is mainly due to the fact that more and more side branches appear and grow up. The comparisons of dendrite morphology between simulated results and investigations by others are also presented. It is proved that the dendrite morphologies are similar in trunks and arms growth, so the developed phase field program is accurate.
Key words: phase field model; numerical simulation; microstructure evolution; dendrite morphology; Al-Si alloy
1 Introduction
Early in 1966, OLDFIELD[1] proposed that the heat source term in heat transfer equation could be represented by the function of nucleation rate and growth velocity of crystal grain, and he attempted to simulate the solidification microstructure of gray casting iron. Yet the micro simulation had been developed slowly and confined by the corresponding macro simulation during the followed decades. Currently, there mainly exist three kinds of models: Deterministic Model, Stochastic Model and Phase-field Model. In this paper, the authors adopted phase-field model, and in this model the phase field variable φ was introduced to describe the morphology, curvature and movement of phase interface. Coupled with the thermal field, solute field, flow field and other outside fields, the phase field model can simulate the real solidification process.
Since 1980s, COLLINS and LEVIN[2], LANGER [3] and CAGINALP and FIFE[4] proposed the initial phase field model. Then, CAGINALP et al[5-7], FIFE and GILL[8, 9] suggested that when the interface width is near zero, PFM would be the sharp interface model, and they firstly introduced the anisotropic factor. FIX G J (1983) carried out the numerical solution of phase field equations for the first time. In 1993, KOBAYASHI[10] realized the 2-D simulation for the dendrite growth in undercooled pure melts by this model coupled with anisotropic influence. WHEELER et al[11] quantitatively simulated the solidification microstructure of pure Ni through the thermodynamically consistent phase field model proposed by WANG et al[12] and PENROSE and FIFE[13]. In 1993, WHEELER et al[14] developed the binary alloy phase field model, and predicted the solute micro segregation and the dendrite morphology. In 1996, KARMA and RAPPEL[15,16] obtained effective GIBBS-THOMSON dependence within certain interface width, and suggested that the interface width could be thicker than capillary length, thus developing a new phase field model, which can simulate deep undercooling condition and shorten the calculation time. PROVATAS et al[17] successfully simulated the single crystal grain morphology through the self-fitted grid technology. STEINBACH et al[18] first proposed the phase field concept of multi phase system and deduced the governing equations. NANILOV and NESTLER[19] presented adaptive finite element simulations of dendritic and eutectic solidification in binary and ternary alloys. Two-dimensional phase-field simulations are used by REMIREZ and BECKERMANN[20] to test standard theories for free dendritic growth of alloys.
The phase field method model becomes the research hotspot within modeling material science as soon as it has been proposed, so it is of great potential and importance[21-24].
2 Numerical model of phase field model (PFM)
At present, there are such two models for free interface of dendrite growth as sharp interface model and diffusion interface model.
Sharp interface model is shown in Fig.1, for an close space Ω, the simulated area was divided into solid states Ω-(t) and liquid state Ω+(t) by the sharp interface G(t), across which the system changes suddenly from solid state to liquid state and G(t) is taken as no thickness. So, temperature and material properties parameters of the two sides across the interface are not continuous.
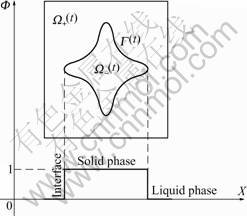
Fig.1 Sharp interface model
In diffusion interface model as shown in Fig.2, solid/liquid interface has a certain thickness, and various transmission phenomena are completed at this interface area. Solid phase, liquid phase and the interface are taken as different phases represented by a scalar, which can form a group of differential equations together with other variables. Therefore, it is not necessary to track interface and separate liquid and solid phase, whereas, use a scalar to track the phase in system. Thus, the same numerical method can be adopted in the entire simulated zone, and Ф(x, t)=1 can raise the calculation precision. Moreover, compared with the sharp interface model, the diffusion interface is more close to Ф(x, t)=0, so it has been widely applied in various phase transformation processes.
Diffusion interface model is adopted in PFM, the phase field variable Ф is introduced, which addresses the physical state (liquid or solid state) of the system with respect to time and space. Ф=1 represents solid phase, Ф=0 represents liquid phase, and Ф changes continuously from 1 to 0 at solid/liquid interface. From Fig.2, we can easily see that there is a diffusion interface layer between solid and liquid phase, Ф changes gradually from a certain constant at one side of the interface to another constant at the other side.
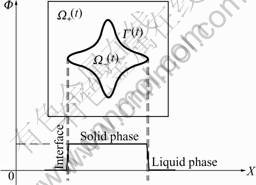
Fig.2 Diffusion interface model
There are
x?Ω-(t) (1)
x?Ω+(t) (2)
Based on GINZBURG-LANDAU free energy theory[3], the phase field equation could be deduced from the free energy F or entropy S, which has been called free energy function method or entropy function method. So the expression of phase field model is different from various addresses of free energy. In this paper, the fundamental formula of phase field model from free energy F and entropy S of the system will be presented respectively.
According to GINZBURG-LANDAU free energy theory [3], for a enclosed system with volume Ω, F is
 (3)
(3)
Based on the minimum energy principle, the variation of LYAPOUNOV function and the linear irreversible dynamics, such equations can be deduced as follows:
 (4)
(4)
 (5)
(5)
 (6)
(6)
According to GINZBURG-LANDAU entropy theory, for the same system as above, the expression of entropy S is
 (7)
(7)
Such equations can also be given
 (8)
(8)
 (9)
(9)
 (10)
(10)
where F and S are respectively the free energy density function and entropy density function; c is the alloy composition; e is the internal energy; ε and δ are the gradient coefficients of phase field and solute field gradient respectively; MΦ,  are the phase field parameters related to the interface dynamics; Mc,
  are the phase field parameters related to the solute diffusion; Mu,
  are the phase field parameters related to the heat transfer.
For a binary alloy, the model is constructed based on such conditions: 1) Energy and entropy balance equation; 2) The relationship between the thermal- dynamics driving force and field flux of all kinds of exterior field such as temperature field and concentration field follows linear laws; 3) Local entropy is positive.
Eqn.(11) is the phase field governing equation proposed by KARMA[25]:
 (11)
(11)
where t is time, by defining W(θ)=W0αS(θ) and τ(θ)=  , the interface anisotropy is introduced, W0 is the interface thickness, τ0 represents the time of atomic movement between the solid-liquid interfaces, αS(θ) is the factor of anisotropy and αS(θ)=1+γcos(k(θ, θ0)),
  denotes the crossing angle between dendrite principal axis and normal direction of interface, θ0=45? is its initial value, γ and k are the exponent and the modulus of anisotropy respectively. h(Φ) is a function constructed for the latent heat released during the process of dendrite growth and g(Φ) is a function constructed for the free energy of the system, h′(Φ) and g′(Φ) are the differential coefficients of h(Φ) and g(Φ) respectively, c is the concentration of the solute, Q is a balance coefficient.
In Eqn.(11),
h(Φ)=Φ (12)
g(Φ)=Φ2(1-Φ)2 (13)
 (14)
(14)
 (15)
(15)
where LA and LB are the latent heats of components A and B, with the melting point TmA and TmB respectively.
(16)

Eqn.(16) is the governing equation of concentration. It is assumed that solute diffuse hardly in solid phase, solute distribution is homogeneous in liquid everywhere and solute redistribution only takes place between the solid-liquid interfaces.
Here,
 (17)
(17)
 (18)
(18)
where vm is the molar volume, R is the gas constant, DS and DL are the solute diffusion coefficients of solid and liquid phase respectively, δ is a gradient coefficient of phase field.
It is assumed that the density, special heat and conductivity coefficient are constants, and equal solid and liquid thermal conductivities are assumed, then the governing equation of temperature could be given as
(19)

where DT is the thermal diffusivity coefficient, and cp is the special heat.
Eqns.(11), (16) and (19) constitute the phase field model for a single-phase binary alloy.
3 Numerical methods
3.1 Initial condition and boundary condition
It is assumed that the original nucleus radius is r0; the initial conditions are given as
When x2+y2≤
Φ=0, T=T0, c=c0 (20)
When x2+y2>
Φ=-1, T=-?T, c=c0 (21)
where T0 is the initial temperature of undercooled molten melts, ZERO-NEUMANN boundary condition is selected in calculations of phase field and temperature field.
3.2 Stability condition of difference equation
It is inevitable that some truncation errors exist in the finite difference method, which is stable if the final solution changes lightly with the small fluctuations of the initial condition and boundary condition, whereas the solution is unstable with the contrary condition. Harmonic analysis method is often adopted to discuss the stability condition: the error in initial value distribution is  , and that of next time is
  , deduced similarly in turn for the error in p, p+1 time and so on, we can get the error increase factor
  The difference equation is stable with
  ≤1, and is unstable with >1. At the same time, Δt must be taken as
?t≤ (22)
(22)
where 1/ , 1/
, 1/ , 1/
, 1/ are the space steps of the discrete unit.
In this paper, the even grid of space step(Δx=Δy) is adopted and the time step is Δt=(τΔx2)/(5ε2). The coefficient (ε2Δt)/(τΔx2) is maintained to be positive to ensure the stability.
3.3 Program flow chart
Adopting Visual FORTRAN 6.0, 2-D dendrite growth code of the aluminum alloy has been developed, and post-process program adopted Visual C++ 6.0 were also carried out to display dendrite growth process dynamically. Systematic environmental is P-IV 2.4G, memory is 1 G, hard disc is 80 G, and operating system is Win2000.
The flow chart of the dendrite growth program is shown in Fig.3.
4 Simulation for dendrite growth process of Al-Si alloy
The molten metal is in thermodynamic unstability during solidification; nuclei can nucleate and grow due to the crystallization driving force. As the crystal grows to a certain size, the solidified interface would become unstable under the solute fluctuation and heat disturbance, and primary branches of the dendrite would be formed. Similarly, the once branches interface would also become unstable during their growth process and resulted in the secondary branches. Analogously, the third branches even higher branches could appear. So, the dendrite could have complicated side branches, which represent the most complex interface evolution pattern during solidification.
Fig.4 presents the dendrite morphology evolution during its growth process. Here, t is the time step. The blue color and red color represent the liquid metal and the solidified part, respectively. It is assumed that there
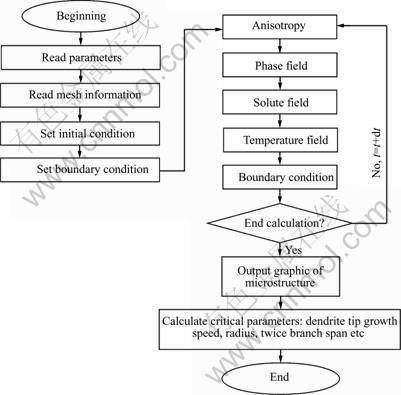
Fig.3 Flow chart of dendrite growth program

Fig.4 Simulated dendrite growth process of Al alloy at different times: (a) t=100 s; (b) t=500 s; (c) t=2 000 s; (d) t=3 000 s; (e) t=5 000 s; (f) t=15 000 s; (g) t=25 000 s; (h) t=35 000 s; (i) t=45 000 s; (j) t=55 000 s; (k) t=65 000 s; (l) t=75 000 s
has been embedded a circinal nuclei in the liquid matrix and its radius is bigger than rk.
As shown in Fig.4, at t=100 s, it is still a circle nuclei, and at t=500 s, it grows bigger and begins to transform to rectangle. From t=2 000 s to t=3 000 s, the four corners of the rectangle grow along their tip directions and thus form the four dendrite trunks. Till t= 5 000 s, some little secondary side branches appear and the trunks change thinner, which is because that the solid phase in the secondary dendrite come from its corresponding trunk. During the following solidification process till t=45 000 s, more and more secondary dendrites appear and grow up, at the same time, the dendrite trunk become thinner and thinner, the dendrite tip radius become smaller and smaller. At t=55 000, 65 000, 75 000 s, some third side branches begin to appear and grow up gradually from the secondary side branches.
Therefore, it can be concluded that, during the solidification process, the initial circle nuclei transform to the rectangle ones firstly, and then its corners develop to the four trunks and from which the secondary side branches are generated and even the third side branches are produced from secondary ones. It seems that the dendrite tip radius decreases quickly at the initial stage and changes slowly at the late stage, which is mainly due to the fact that more and more side branches appear and grow up. Similarly, the dendrite grows quickly initially and gradually changes slowly.
5 Verification of microstructure simulation with investigations by others
Fig.5 presents the comparison of microstructure between simulated results and experimental or simulated investigations by others with different methods.
From the above results, we can see that the dendrite morphology is similar in trunks and arms growth, so the developed phase field program is accurate. Of course, this study is still at the stage of theoretical exploration,
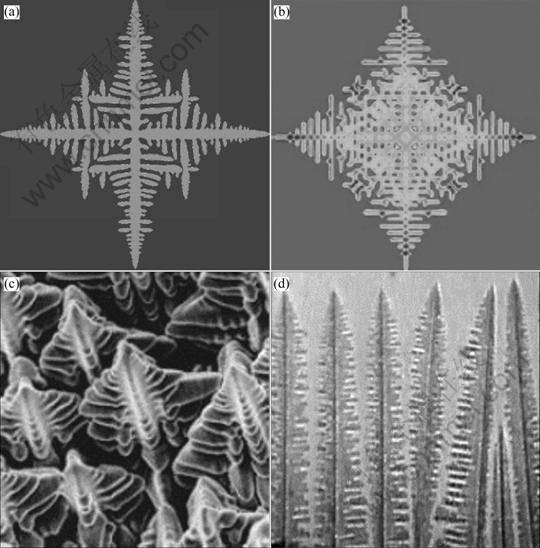
Fig.5 Verification of microstructure simulation results: (a) Illustration of simulated dendrite growth morphology in this paper; (b) Simulated dendrite morphology by CA method by Tsinghua[26]; (c) Photographs of typical free dendrite patterns taken by GLICKSMAN et al[27]; (d) Experimental result of SCN-Ac organic alloys taken by KURZ and ESAKA[28]
and it is necessary to be linked with engineering application further.
6 Conclusions
1) The phase field model, solution algorithm and the program of dendrite growth are introduced. The definition of initial condition, boundary condition and the stability condition of differential format are all included.
2) The dendrite morphology evolution: the initial circle nuclei transform to the rectangle ones firstly, and then their corners develop to the four trunks and from which the secondary side branches generated and even the third side branches produced from secondary ones. The dendrite tip radius decreases quickly at the initial stage and change slowly at the late stage, which is mainly due to the fact that more and more side branches appear and grow up.
3) The comparisons of dendrite morphology between simulated results and investigations by others are also presented. It is proved that the dendrite morphologies are similar in trunks and arms growth, so the developed phase field program is accurate.
References
[1] OLDFIELD W. A qualitative approach to casting solidification [J]. ASM Trans, 1966, 59(2): 945-960.
[2] COLLINS B, LEVIN H. Diffuse interface model of diffusion-limited crystal growth [J]. Phys Rev B, 1985, 31(9): 6119-6122.
[3] LANGER J S, GRINSTEIN G, MAXENKO G. Directions in Condensed Physics [M]. World Science, 1986.
[4] CAGINALP G, FIFE P C. Phase field methods for interfacial boundaries [J]. Phys Rev B, 1986, 33(11): 7792-7794.
[5] CAGINALP G, FIFE P C. Dynamics of layered interfaces arising from phase boundaries [J]. SIAM J of Appl Math, 1988, 48(3): 506-510.
[6] CAGINALP G, FIFE P C. High-order phase field models and detailed anisotropy [J]. Phys Rev B, 1986, 34(7): 4940-4943.
[7] CAGINALP G, et al. Type models as asymptotic limits of the phase-field equations [J]. Phys Rev A, 1989, 39(11): 5887-5890.
[8] FIFE P C, GILL G S. The phase-field description of mushy zones [J]. Phys D, 1989, 35: 267-275.
[9] FIFE P C, GILL G S. Phase-transition mechanisms for the phase-field model under internal heating [J]. Phys Rev A, 1991, 43(2): 843-851.
[10] KOBAYASHI R. Modeling and numerical simulation of dendrite crystal growth [J]. Phy S D, 1993, 63(1): 410-423.
[11] WHEELER A, MURRAY B T, SCHAEFER R J. Computation of dendrites using a phase field model [J]. Phys D, 1993, 66(10): 243-262.
[12] WANG S L, SEKERKA R F, WHEELER A A, et al. Thermodynamically consistent phase-field models for solidification [J]. Phys D, 1993, 69(10): 189-200.
[13] PENROSE O, FIFE P C. Thermodynamically consistent models of phase-field type for the kinetics of phase transitions [J]. Phys D, 1990, 43(10): 44-62.
[14] WHEELER A A, BOETTINGER W J, MCFADDEN G B. Phase-field model for isothermal phase transitions in binary alloys [J]. Phys Rev A, 1992, 45(l0): 7424-7439.
[15] KARMA A, RAPPEL W J. Phase field method for computationally efficient modeling of solidification with arbitrary interface kinetics [J]. Phys Rev E, 1996, 53(4): R3017-3020.
[16] KARMA A, RAPPEL W J. Numerical simulation of three-dimensional dendritic growth [J]. Phys Rev Lett, 1996, 77(10): 4050-4053.
[17] PROVATAS N, GOLDENFIELD N, DANTZIG J A. Adaptive arid methods in solidification microstructure modeling [A]. THOMAS B G, BECKERMAN C. Modeling of Casting, Proceedings of the Eighth International Conference on Welding and Advanced Solidification Processes VIII, Modeling of Casting, Welding and Advanced Solidification Processes VIII [C]. California, San Diego: A Publication of TMS, 1998: 533-540.
[18] STEINBACH I, PEZZOLLA F, NESTLER B et al. A phase field concept for multiphase system [J]. Phys D, 1996, 94(1): 135-147.
[19] DANILOV D, NESTLER B. Phase-field simulations of solidification in binary and ternary systems using a finite element method [J]. Journal of Crystal Growth, 2005: e177-e182.
[20] REMIREZ J C, BECKERMANN C. Examination of binary alloy free dendritic growth theories with a phase field model [J]. Acta Materialia, 2005, 53: 1721-1736.
[21] ZHAO Y H, CHEN Z, WANG Y X, LU Y L. Atomic-scale computer simulation for early precipitation process of Ni75Al10V15 alloy [J]. Progress in Natural Science, 2004, 14(3): 241-246.
[22] ZHAO Y H, HOU H, XU H, et al. Atomic-scale computer simulation for early precipitation process of Ni75Al9V16 alloy [J]. Journal of Material Science and Technology, 2003, 19(S1): 1719-19.
[23] ZHAO Y H, CHEN Z, LI X L. Computer simulation of strain-induced morphological transformation of coherent precipitates [J]. J Univ Sci Technol Beijing (M.M.M.), 2003, 10(4): 55-60.
[24] ZHAO Y H, CHEN Z, WANG Y X, et al. Computer simulation for the coarsening behaviour of coherent precipitates [J]. Rare Metal Materials and Engineering, 2004, 33(3): 234-238.(in Chinese)
[25] KARMA A, PAPPEL W J. Qantitative phase-field modelling of dendritic growth in two and three dimensions [J]. Phys Rev, 1998, E57: 4323-4349.
[26] XU Q Y, LIU B C, LIANG Z J, HWANG W-Sing. Proceedings of Modeling of Casting and Solidification Processes VI, 2004.
[27] GLICKSMAN M E, et al. Isothermal dendrite growth-a proposed micro gravity experiment [J]. Metall Trans, 1988, 19A: 1945-1953.
[28] KURZ W, ESAKA H. Solidification microstructures [J]. Praktische Metallographie, 1988, 25(5): 207-213.
(Edited by PENG Chao-qun)
Corresponding author: HOU Hua; Tel: +86-1394153099; E-mail: houhua@263.net

