DOI: 10.11817/j.ysxb.1004.0609.2021-39594
柔性隔离层下单漏斗散体矿岩力链演化特征模拟
陈庆发,秦世康,杨承业
(广西大学 资源环境与材料学院,南宁 530004)
摘 要:开展柔性隔离层下单漏斗散体矿岩力链演化特征模拟研究,对于进一步揭示柔性隔离层下散体介质流动规律的内部作用机理具有重要意义。基于大量放矿同步充填留矿法数值试验模型,利用PFC强大的数据处理及图片输出功能,结合接触力学及统计力学相关知识,对单漏斗放矿过程散体介质体系内力链长度、数量、强度、方向、准直系数等的演化特征进行量化研究。结果表明:在柔性隔离层下单漏斗放矿过程,随着放矿次数的增加强接触占比逐渐由37%减小到32%,并在放矿后期逐渐保持稳定,力链接触作为强接触自组织而成的结构,其接触占比在放矿过程稳定在17%左右。力链总数随着放矿次数的增加逐渐减少,并在放矿后期稳定在810条左右,且不同放矿次数下力链长度的概率分布几乎一致,均随着力链长度的增加呈指数式递减;随着放矿次数增大力链强度的概率分布先呈指数式上升,再呈指数式下降,在0.7 (为平均接触力)处出现一峰值。放矿初始阶段,力链主要沿垂直方向分布,力链方向分布形态近似花生状,此后随着矿石颗粒的持续放出,力链方向分布形态由花生状逐渐变为椭圆最终演变成花瓣状形态,力链分布主方向由一个演变为三个(垂直及与水平方向呈±30o夹角的方向)。力链准直系数在第9次放矿结束后达到顶峰,随后逐渐下降并保持稳定。
关键词:柔性隔离层;散体介质;力链;同步充填;离散元
文章编号:1004-0609(2021)-06-1694-12 中图分类号:TD801 文献标志码:A
引文格式:陈庆发, 秦世康, 杨承业. 柔性隔离层下单漏斗散体矿岩力链演化特征模拟[J]. 中国有色金属学报, 2021, 31(6): 1694-1705. DOI: 10.11817/j.ysxb.1004.0609.2021-39594
CHEN Qing-fa, QIN Shi-kang. YANG Cheng-ye. Simulation on evolution characteristics of force chain in granular ore rock with single funnel under flexible isolation layer[J]. The Chinese Journal of Nonferrous Metals, 2021, 31(6): 1694-1705. DOI: 10.11817/j.ysxb.1004.0609.2021-39594
在无废开采、绿色开采、协同开采等理念指导下[1-2],本文作者[3]于2010年提出了同步充填理念,并发明了一种代表性采矿方法,即“大量放矿同步充填无顶柱留矿采矿法”(简称同步充填留矿法)。新采矿法中散体介质因柔性隔离层的存在,其流动规律突破了现有放矿理论的描述范围。因此,本文作者团队在国家自然科学基金“柔性隔离层作用下散体介质流理论研究”资助下,对大量放矿同步充填过程矿石颗粒的流动规律进行了一系列研究[4-11]。研究过程发现,新采矿方法采场崩落矿石是由形状各异的固相、液相、气相颗粒结合而成的软凝聚态密集颗粒体系(即散体介质体系)。在该体系中,矿石颗粒密集排布,外载荷及自身重力使得毗邻颗粒相互挤压、接触,形成诸多传递外载荷的链状路径,即力链。而散体介质的流动特性与力链密切相关,力链网络的复杂动力学响应直接决定了散体介质体系的宏观力学行为,因此,为进一步揭示柔性隔离层下散体介质流动过程的内部作用机理,有必要对散体矿岩流力链演化特征进行更深入的研究。
散体介质体系内力链演化特征研究经历了一个漫长的阶段,近年来逐渐成为研究者们关注的热点问题。1957年,在伦敦召开的第四届土力学与基础工程国际会议上,DANTU[12]首次报道了在光弹试验中发现的颗粒体系内部接触力的传递呈树状结构及其分布非均匀现象。随后,HORNE[13]、EDWARDS等[14]学者陆续对力链的存在和形态进行了研究及报道;直到1995年,BOUCHAUD等[15]在以上研究基础上明确提出了力链的概念。之后,人们采用多种测量方法,比如高精度电子天平称重法、显色灵敏复写纸压痕法和光弹性法等,对颗粒物质之间存在的接触力进行了大量试验测量,通过检测颗粒物质中某一截面上的接触力分布情况,确认了力链的存在。近年来随着计算机技术的发展,利用离散元方法生成颗粒体系并用于研究力链结构的手段得到了越来越多的应用。例如,BAGI[16]利用离散元方法模拟了线弹性和存在摩擦颗粒间的力链演化,结果显示接触力的分布呈指数形式,颗粒刚度对接触力分布的影响较小。WANG等[17]利用三轴压缩试验及离散元数值模拟方法研究了水泥砂浆中力链的分布,发现力链分布随轴向应变的变化而变化,应变较小时力链呈网状分布,应变较大时力链呈柱状并存在于剪切带中。孙其诚等[18-20]阐述了颗粒物质多尺度力学的研究框架,并利用离散元方法生成颗粒体系,模拟了点荷载、刚性块体压入试件、单轴压缩、双轴压缩试验过程中力链的演化规律及颗粒的传力特性,根据传力大小、传力路径、能量分布及接触力网络结构特点把力链分为强力链和弱力链,指出强力链决定了颗粒体系的宏观力学行为,并计算了力链的概率分布及其长度概率分布、接触力与重力之间的夹角等指标。
以上研究证明了力链的存在,并且对散体介质体系内接触力大小、方向及力链形态等进行了初步研究,但是这些研究均处在一个初步探索阶段,对于力链的定义、识别及量化表征等都没有统一的标准,并且以上研究均未涉及放矿领域。本文在前人研究基础上,对柔性隔离层下单漏斗放矿过程散体矿岩内力链长度、数量、强度、方向等演化特征进行了量化表征,以期为金属矿放矿学理论研究提供一种新思路,并推动颗粒物质力学的进一步发展。
1 离散元模型构建及试验设计
利用离散元模拟软件PFC构建同步充填留矿法试验模型,如图1所示。本次放矿试验选用的接触模型为抗滚动线性接触模型,颗粒生成采用自重堆积法[21]。为实现柔性隔离层下同步充填放矿过程,颗粒的生成以如下3个步骤进行。
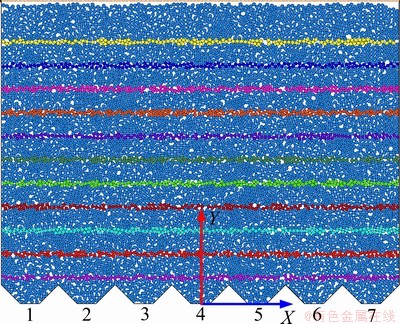
图1 同步充填留矿法数值试验模型
Fig. 1 Numerical test model of synchronous filling shrinkage method
1) 初始颗粒的生成:通过ball generate命令在墙体模型y轴方向0.08 cm到130 cm范围生成若干矿石颗粒,这些矿石颗粒的重力加速度g=9.81 m/s2,其细观力学参数如表1所示[22]。为使散体介质体系内矿石颗粒尽快充填密实,初始颗粒的接触模型设置为线性接触模型,颗粒之间的摩擦因数取为0.3;同时为方便观察放矿过程矿石颗粒流动现象,待模型平衡后,以10cm为间隔将颗粒赋予不同的颜色,并删除128 cm水平以上的矿石颗粒。
2) 柔性隔离层的生成:为模拟柔性隔离层,利用Cubic命令,在生成的矿石颗粒上方生成一排长250 cm半径为1.5×10⁻³ cm的细小颗粒,这些颗粒采用平行黏结,并赋予隔离层如表2所示的细观力学参数。
3) 计算颗粒的生成:为模拟矿石颗粒大小及形状不同所带来的影响,将颗粒接触模型由线性接触模型变为抗滚动线性接触模型,此时散体介质体系内颗粒的细观力学计算参数如表3所示。删除编号为4的底墙后,放矿口被打开,矿石颗粒从放矿口放出,矿石流动随即开始。放矿过程中,每计算若干时步,关闭4号放矿口,并在矿石颗粒面上生成适量的充填废石颗粒(其细观力学参数与计算过程矿石颗粒细观力学参数相同),以实现同步充填效果,待模型在自重作用下解算平衡后,删除多余的充填颗粒,并再次打开4号放矿口,进入下一循环的计算,直至矿石颗粒全部放出。
表1 墙体及初始矿石颗粒的力学参数
Table 1 Mechanical parameters of wall and initial ore particles

表2 隔离层的力学参数
Table 2 Mechanical parameters of isolation layer

表3 矿石颗粒的力学参数
Table 3 Mechanical parameters of ore particles
2 力链的程序识别
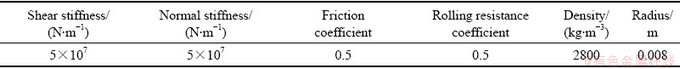
颗粒密集排布的散体介质体系中,力经由颗粒间接触从一个颗粒传递至另一个颗粒,这一传力过程在可视化后表现为链状结构,称之为力链,如图2所示[23]。
基于前人研究可知[23-24],力链形成需要满足三个条件:1) 接触力大小必须大于体系内平均接触力大小;2) 相邻接触之间的夹角必须小于等于角度阈值θc;3) 组成力链的颗粒个数必须大于等于3。
根据以上三个成链条件,对于力链识别设置三个判据。
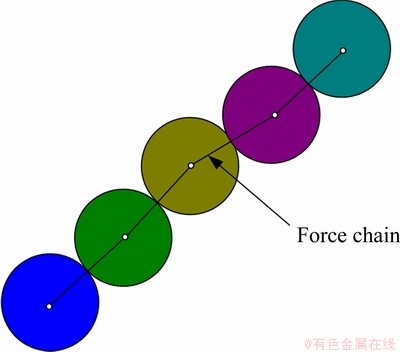
图2 力链结构示意图
Fig. 2 Schematic diagram of force chain structure
1) 接触力判据
散体介质体系内平均接触力大小:
 (1)
(1)
式中: 为平均接触力的大小;N为颗粒总数;
 为模型内颗粒接触力的总和。
接触力判据为
F≥ (2)
2) 接触角判据
图3 力链角度示意图
Fig. 3 Schematic diagram of force chain angle
在离散元模型中,接触为颗粒中心点之间的连线,如图3所示。颗粒A、B、C之间存在两个接触,颗粒A、B之间的接触为AB,其法向量为 (xAB,yAB),颗粒B、C之间的接为触BC,其法向量为(xBC,yBC),则接触AB与接触BC之间的夹角 :
:
 (3)
(3)
颗粒成链的角度阈值 :
:
 (4)
(4)
式中: 为模型内颗粒的平均配位数。
颗粒成链的接触角判据为
≤ (5)
3) 力链长度判据
一条力链上颗粒的个数必须大于等于3,接触的个数必须大于等于2,所以颗粒成链的长度判据为
 ≥3 (6)
式中:L为力链的长度,即一条力链上所含颗粒的个数;N为接触的个数,即一条力链上所含接触的个数。
利用PFC2D中的Fish语言输出不同放矿次数下散体介质体系内接触编号、大小、位置坐标等信息。基于以上三个判据,编制力链识别程序,遍历散体介质体系内所有接触,实现力链的自动检索及识别,力链识别过程如图4所示。
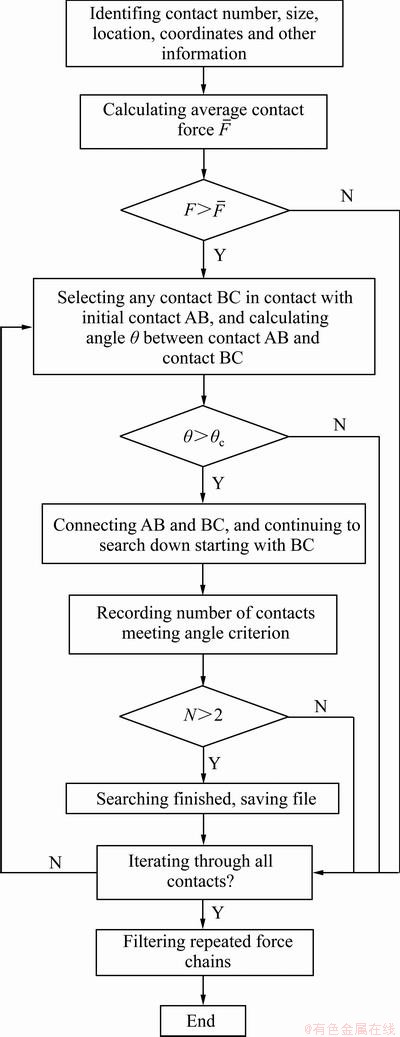
图4 力链识别流程
Fig. 4 Identification process of force chain
3 散体介质体系内力链演化机制
3.1 力链宏观分布特征
基于同步充填留矿采矿法数值试验模型,利用PFC编制Fish语言模拟柔性隔离层下单漏斗放矿过程,每放出一定量的矿石颗粒,记录并输出一次矿石颗粒信息,并利用PFC2D中的Geometry命令,将散体介质体系内的强接触进行可视化。
图5所示为不同放矿次数下散体介质体系中力链的分布情况。图中蓝色线条为颗粒接触力大于散体介质体系平均接触力的接触。由于颗粒接触力大于散体介质体系平均接触力的接触仅仅满足颗粒成链的接触力大小判据,所以图中显示的力链较实际情况偏多;但是这对散体介质体系内力链的宏观分布特征影响较小,因此其可以代表大量放矿同步充填过程散体介质体系内力链的整体分布特征。
由图5可知,初始时刻力链分布较为均匀,力链网络空隙较大,主要集中在模型的下部;随着矿石颗粒的持续放出,力链逐渐由模型的中部向模型的两侧移动,最终在两侧漏斗口附近沿着边壁向上蔓延,力链网络空隙越来越小,局部应力集中效应明显;放矿后期,隔离层上部力链数目逐渐增多,隔离层下部力链主要集中在模型两侧边壁,力链呈现出明显的方向性,主要沿着垂直隔离层的方向分布。
3.2 力链数量和长度变化规律
根据颗粒成链的三个判据可知,强接触不一定能够组成力链。

图5 力链宏观分布特征
Fig. 5 Macroscopic distribution characteristics of force chain
图6所示为放矿过程强接触与力链接触数量在总接触数量上的占比。从图6可以看出,随着放矿次数的增加强接触占比逐渐由37%减小到32%,并在放矿后期逐渐保持稳定;整个放矿过程力链接触占比均稳定在17%左右,上下波动幅度不超过2%。
图7所示为放矿过程力链总数变化规律。由图7可以看出,随着放矿次数的增加力链总数逐渐减少,并在放矿后期稳定在810条左右。
因此结合图6和7可知,随着放矿次数的增加,散体介质在隔离层、自身重力及放矿口等效荷载等共同作用下,游离的强接触颗粒逐渐减少,荷载被更多的力链承担;放矿后期,随着体系内荷载逐渐稳定,强接触及力链接触占比逐渐趋于稳定。
将每次放矿结束后散体介质体系内力链数目进行归一化处理,计算体系内力链长度的概率分布,最终结果分别如图8和图9所示(不考虑长度大于15的力链,因为其在力链总数中所占概率较小)。
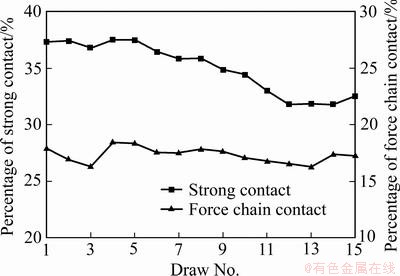
图6 强接触与力链接触占比
Fig. 6 Percentage of strong contact and force chain contact
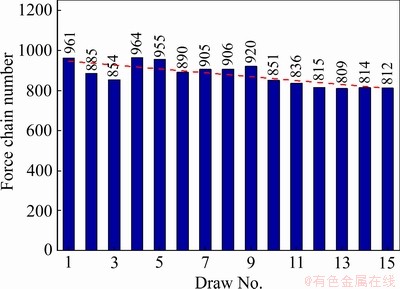
图7 放矿过程散体介质体系内力链数目变化规律
Fig. 7 Change law of force chains number in bulk medium system during ore drawing
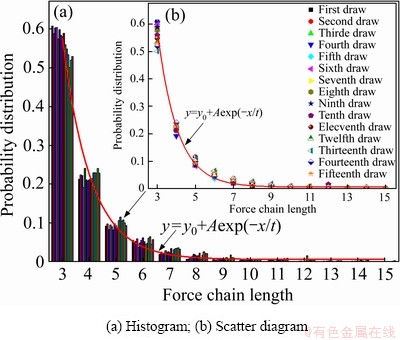
图8 力链长度的概率分布
Fig. 8 Probability distribution of force chain length
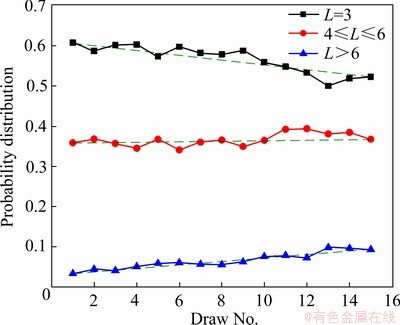
图9 不同长度力链的概率分布
Fig. 9 Probability distribution of force chains with different lengths
由图8可知,力链越长,数目越少,两者呈指数分布,这与文献[23]得到的研究结果相吻合。对第1次放矿结束后散体介质体系内力链长度分布进行拟合,拟合相关系数 0.996,拟合函数为
 (7)
(7)
式中:y0=0.006,A=9.978,t=0.043。
利用以上拟合公式对其他放矿次数下的力链长度进行拟合,拟合程度均较好,相关系数均大于0.99。
由图8和9可知,不同放矿次数下力链长度的概率分布几乎一致,均随着力链长度的增加呈指数式递减;其中长度为3的力链数目最多,约占力链总数的60%,其个数随着放矿次数的增加逐渐减少;长度处在4~6之间的力链数目约占力链总条数的35%,其个数随着放矿次数的增加不断波动,但基本保持不变;长度大于6的力链数目较少,约占力链总数的5%,其个数随着放矿次数的增加逐渐增加。这主要是因为大量放矿同步充填过程,冲击荷载作用会导致长力链的断裂和弯曲形成短力链。放矿初期,体系原始应力被打破,冲击荷载使得原本稳定的力链网络遭到破坏,长力链断裂弯曲成为短力链。可见,放矿初期散体介质体系内短力链数目较多,长力链数目较少;随着放矿的持续推进,体系内荷载逐渐稳定,新的力链分布网络逐渐形成,荷载逐渐被长力链分担。因此,随着放矿次数的增加长力链数目逐渐增多,短力链数目逐渐减少;而在整个放矿过程中,中等长度力链不断断裂重组,因此其比例基本保持不变。
3.3 力链强度演变规律
根据放矿过程力链演化特点将整个放矿过程分为三个阶段,分别为放矿前期、放矿中期、放矿后期。其中第1~7次放矿过程为放矿前期,第8~11次放矿过程为放矿中期,第12~15次放矿过程为放矿后期。各个阶段散体介质体系内力链强度演变规律如图10所示。
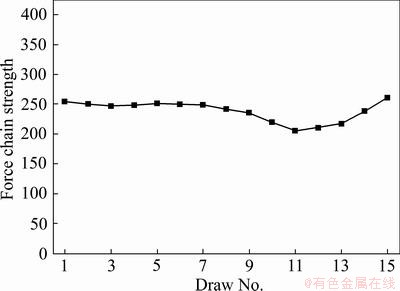
图10 力链强度演化规律
Fig. 10 Evolution law of force chain strength
由图10可知力链强度在放矿前期基本保持不变,放矿中期力链强度出现缓慢下降,放矿后期力链强度又逐步上升。
根据每次放矿结束后散体介质体系内力链强度统计结果,计算体系内力链强度的概率分布,最终结果如图11所示。
由图11可知,不同放矿次数下力链强度的概率分布先呈指数式上升再呈指数式下降,在0.7处出现一峰值。对第8次放矿结束后散体介质体系内力链长度分布进行拟合,拟合相关系数 0.999,拟合函数为
 (8)
(8)
式中:A=2.955,B=3.855,C=6.659,D=0.470。
利用以上拟合公式对其他放矿次数下的力链强度进行拟合,拟合程度均较好,相关系数均大于0.99。
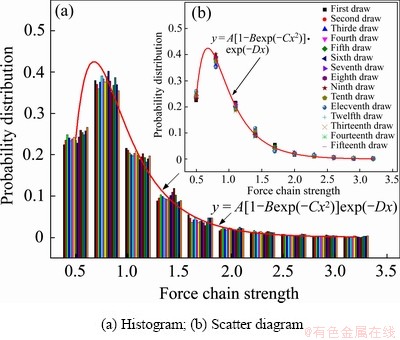
图11 力链强度的概率分布
Fig. 11 Probability distribution of force chain strength
3.4 力链方向分布特征
将360°等分为36个区间,对每个区间内的力链数目及强度进行统计,进而求出每个区间内力链的平均强度,最终得到放矿过程力链方向分布如图12所示(图片较多,只选择了几张具有代表性的)。
同时为了定量描述大量放矿同步充填过程中散体介质体系内部力链细观结构特征的演化规律,采用ROTHENBURG等[25]提出的颗粒间接触力角度分布描述函数对放矿过程散体介质体系内力链强度与力链方向统计结果进行拟合:
 (9)
(9)
式中:fn(θ)为散体介质体系内力链强度分布函数;f0为散体介质体系内所有力链强度的平均值;an傅里叶级数,其值表示散体介质体系内力链方向分布的各向异性程度;θn为散体介质体系内力链分布的主方向。
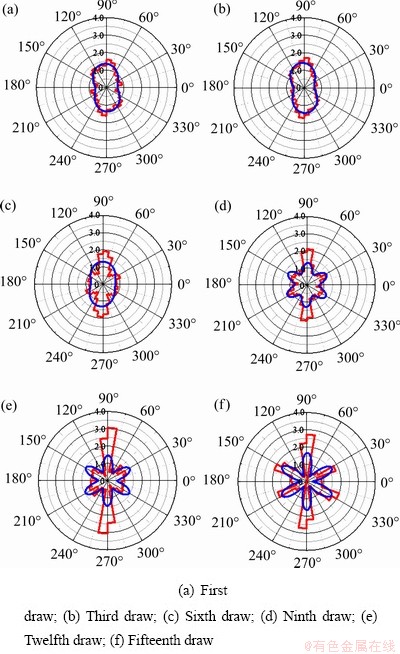
图12 力链方向演化规律
Fig. 12 Evolution law of force chain direction
根据式(9)对大量放矿同步充填过程散体介质体系内力链强度与力链方向分布进行拟合。拟合过程发现:前8次放矿过程中力链方向分布可以采用式(9)进行拟合,且拟合效果较好(通过图12中红色与蓝色线条轮廓的相似程度即可看出),最终获得的拟合参数如表4所示;从第9次放矿开始,力链强度及力链方向的分布关系发生较大变化,不再满足式(9)所表示的数值关系。
表4 第1~8次放矿过程力链方向分布的拟合结果
Table 4 Fitting results of direction distribution of force chain during 1-8 th ore drawing process
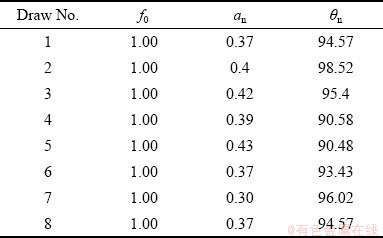
通过观察第8次放矿之后力链方向分布的统计结果可知,放矿中后期,随着矿石颗粒的持续放出,矿石颗粒在上覆荷载及隔离层的共同作用下,散体介质体系内力链主要沿着垂直隔离层方向分布,体系内与水平方向之间夹角呈30o方向的力链强度逐渐增加,因此,放矿中后期力链主要集中在铅直及与水平方向呈±30o夹角的方向。利用三角函数对后7次放矿过程力链方向分布进行拟合,由于后7次放矿过程力链方向分布存在6个波峰,最小正周期为60o,所以我们可以定义三角函数对其进行拟合:
 (10)
(10)
式中:fn(θ)为散体介质体系内力链强度分布函数;f0 为散体介质体系内所有力链强度的平均值;an为三角函数振幅,其值表示散体介质体系内力链方向分布的各向异性程度;θn为散体介质体系内力链分布的主方向。
根据式(10)对放矿中后期力链强度与力链方向之间的分布进行拟合。通过对比图12中蓝色线与红色线轮廓的相似程度可以看出,除了铅直方向外,总体效果拟合较好,最终获得的拟合参数如表5所示。
对式(9)和式(10)进行统一化处理,可得单漏斗放矿过程力链方向分布拟合公式:
 (11)
(11)
式中:fn(θ)为散体介质体系内力链强度分布函数;f0为散体介质体系内所有力链强度的平均值;an为三角函数振幅即傅里叶系数,其值表示散体介质体系内力链方向分布的各向异性程度;θn为散体介质体系内力链分布的主方向;w为三角函数频率控制系数,三角函数的最小正周期T=2π/(π/w)=2w。
表5 第9~15次放矿过程力链方向分布的拟合结果
Table 5 Fitting results of direction distribution of force chain during 9-15 th ore drawing process
综合图12、表4和表5,由不同放矿次数下力链方向分布对比分析可得,前8次放矿过程散体介质体系内力链方向分布的变化规律具有一致性,后7次放矿过程力链方向分布变化规律具有一致性。放矿初始阶段,散体介质体系处于初始固结状态,系统受自身重力影响较大,力链主要沿铅垂方向分布,故散体介质体系内力链分布主方向θn在90o左右,力链方向分布形态近似花生状;此后随着矿石颗粒的持续放出,受回填废石上覆荷载及隔离层形状的影响,散体介质体系内部力链方向分布形态发生明显变化,分部形态由花生状逐渐变为椭圆最终演变成花瓣状形态,力链分布主方向由一个演变为三个(铅垂及与水平方向呈±30o夹角的方向)。对于力链分布各向异性程度表征参数an而言,第8次放矿之前,体系内颗粒主要受自身重力及放矿口等效荷载的影响,而这两种荷载在放矿过程为一定值,所以各向异性程度an基本保持不变,第8次放矿之后,隔离层上覆荷载影响越来越大,且上覆荷载随着废石充填逐渐增大,所以体系内力链各向异性程度an逐渐增大。对于体系内力链平均强度f0而言,其经过归一化处理,所以其一直保持在1.00。
3.5 力链准直系数分布特征
力链准直性可以保证力链不发生屈曲,保证外部荷载在散体介质体系中顺利传递,同时确保整个力链网络的稳定,因此对于力链准直性进行研究具有重要意义[26]。
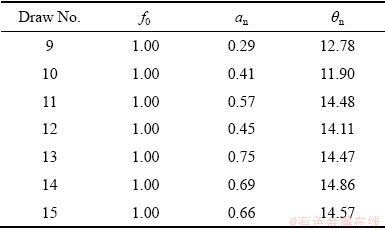
将体系内所有力链的准直系数进行累加求和,并根据力链数目进行几何平均,得到每次放矿结束后散体介质体系内力链准直系数,如图13所示。
图13 力链准直系数变化规律
Fig. 13 Change law of collimation coefficient of force chains
由图13可知,力链准直系数在放矿前期比较稳定;在放矿中期开始缓慢上升,直至第9次放矿结束达到顶峰,并开始逐渐下降;放矿后期力链准直系数再次达到稳定,但是和放矿前期相比略有上升。力链准直系数的变化趋势整体呈高斯形态分布,利用函数12对其进行拟合,结果如图13中的红色曲线所示。拟合系数为0.945,拟合效果较好。
 (12)
(12)
式中:y0=0.874,A=0.127,xc=9.033,w=0.833。
如果力链强度较大,准直性较好,就会使更多的颗粒连接在一起,因此长力链一般准直性较好、强度较大,短力链一般长度较小、强度也较小。结合放矿过程力链长度、数量、强度、方向等的变化规律可知,放矿初期,散体介质体系主要受自身重力及放矿口等效荷载的影响,荷载分布均匀,每个力链所承受的荷载较小,所以放矿前期力链长度较短,数目较多,力链准直系数较小;随着大量放矿同步充填的持续进行,隔离层上方回填废石越来越多,相应的上覆载荷越来越大,所以隔离层下方力链长度逐渐增强,准直系数也逐渐增加,直至第9次放矿结束力链准直系数达到顶峰;第9次放矿结束之后,隔离层上覆荷载对两侧散体介质的挤压效果逐渐显现,力链逐渐由一个主方向向三个主方向过渡,散体介质体系内部力链断裂重组频繁,垂直方向力链强度及数量逐渐减小,与水平方向夹角为±30o的力链强度及数量逐渐增大,直至达到新的平衡,所以放矿后期力链准直系数逐渐减小之后并最终保持稳定。
4 结论
1) 随着放矿次数的增加,强接触占比逐渐由37%减小到32%,并在放矿后期逐渐保持稳定。力链接触作为强接触自组织而成的结构,其接触占比在放矿过程稳定在17%左右(上下波动幅度不超过2%),表明随着放矿次数的进行,散体介质在隔离层、自身重力及放矿口等效荷载等的共同作用下,游离的强接触颗粒逐渐减少,荷载更多的被力链承担;放矿后期,随着体系内荷载逐渐稳定,强接触及力链接触占比也逐渐趋于稳定。
2) 力链总数随着放矿次数的增加逐渐减少,并在放矿后期稳定在810条左右。不同放矿次数下力链长度的概率分布几乎一致,均随着力链长度的增加呈指数式递减;其中长度为3的力链数目最多,约占力链总数的60%,其个数随着放矿次数的增加数逐渐减少;长度处在4~6之间的力链数目约占力链总数的35%,其个数随着放矿次数的增加不断波动,但基本保持不变;长度大于6的力链数目较少,约占力链总数的5%,其个数随着放矿次数的增加逐渐增加。
3) 力链强度在放矿前期基本保持不变,放矿中期力链强度出现缓慢的下降,放矿后期力链强度又逐步上升。不同放矿次数下力链强度的概率分布先呈指数式上升再呈指数式下降,在0.7处出现一峰值。
4) 前8次放矿过程散体介质体系内力链方向分布变化规律一致,后7次放矿过程力链方向分布变化规律一致。放矿初始阶段,力链主要沿铅垂方向分布,力链方向分布形态近似花生状,各向异性程度表征参数an基本保持不变;此后随着矿石颗粒的持续放出,力链方向分布形态由花生状逐渐变为椭圆最终演变成花瓣状形态,力链分布主方向由一个演变为三个(垂直及与水平方向呈±30o夹角的方向),此阶段an随着放矿次数的增加逐渐增大。对于体系内力链平均强度f0而言,放矿过程其一直保持在1.00。
5) 力链准直系数在放矿前期比较稳定;放矿中期缓慢上升,第9次放矿结束后达到顶峰,并开始逐渐下降;放矿后期力链准直系数再次达到稳定。
REFERENCES
[1] FINNIE B, STUART J, GINSON L, et al. Balancing environmental and industry sustainability: A case study of the US gold mining industry[J]. Journal of Environmental Management, 2009, 90(12): 3690-3699.
[2] 钱鸣高. 绿色开采的概念与技术体系[J]. 煤炭科技, 2003, 24(4): 1-3.
QIAN Ming-gao. Technological system and green mining concept[J]. Coal Science and Technology Magazine, 2003, 24(4): 1-3.
[3] 陈庆发. 隐患资源开采与采空区治理协同研究[D]. 长沙: 中南大学, 2009: 1-133.
CHEN Qing-fa. Study on synergism of hiddern danger resources mining and goafs treatment[D]. Changsha: Central South University, 2009: 1-133.
[4] CHEN Q F, QIN S K, CHEN Q L. Numerical simulation of ore particle flow behaviour through a single drawpoint under the influence of a flexible barrier[J]. Geofluids, 2019, 2019(1): 6127174.
[5] CHEN Q F, QIN S K, CHEN Q L. Stress analysis of ore particle flow behaviour under the influence of a flexible barrier[J]. Arabian Journal of Geosciences, 2019, 12(15): 472-486.
[6] CHEN Q F, ZHAO F Y, CHEN Q L. Orthogonal simulation experiment for flowing characteristics of ore-rocks in ore drawing and its influencing factors in single funnel under the flexible isolation layer[J]. JOM, 2017, 69(12): 2485-2491.
[7] 陈庆发, 陈青林, 王玉丁, 等. 多漏斗放矿柔性隔离层界面移动规律及其拉力特性[J]. 应用基础与工程科学学报, 2018, 26(5): 1101-1109.
CHEN Qing-fa, CHEN Qing-lin, WANG Yu-ding, et al. Study of the movement law and tensile force character of flexible isolation layer interface in multiple funnels[J]. Journal of Basic Science and Engineering, 2018, 26(5): 1101-1109.
[8] 陈庆发, 陈青林, 钟 毓, 等. 柔性隔离层下多漏斗矿岩流动特性及影响因素正交模拟试验[J]. 中国科学(技术科学), 2017, 47(9): 923-932.
CHEN Qing-fa, CHEN Qing-lin, ZHONG Yu, et al. Orthogonal simulation test for following characteristics of ore-rock and influence factor in ore drawing from multiple funnels under flexible isolation layer[J]. Chinese Science (Technical Science), 2017, 47(9): 923-932.
[9] 陈庆发, 陈青林, 仲建宇, 等. 柔性隔离层下单漏斗散体矿岩流动规律[J]. 工程科学学报, 2016, 38(7): 893-898.
CHEN Qing-fa, CHEN Qing-lin, ZHONG Jian-yu, et al. Flow pattern of granular ore rock in a single funnel under a flexible isolation layer[J]. Chinese Journal of Engineering, 2016, 38(7): 893-898.
[10] 陈庆发, 陈青林, 仲建宇, 等. 单漏斗放矿柔性隔离层界面形态演化规律[J]. 中国有色金属学报, 2016, 26(6): 1332-1338.
CHEN Qing-fa, CHEN Qing-lin, ZHONG Jian-yu, et al. Evolution law of interface morphology of flexible isolation layer under ore drawing from single funnel[J]. The Chinese Journal of Nonferrous Metals, 2016, 26(6): 1332-1338.
[11] 陈庆发, 赵富裕, 陈青林, 等. 基于室内试验的多漏斗放矿柔性隔离层材料受力特性分析[J]. 工程力学, 2018, 35(11): 240-248.
CHEN Qing-fa, ZHAO Fu-yu, CHEN Qing-lin, et al. Mechanical properties analysis for a flexible isolation layer material in multiple funnels synchronous ore drawing based on a indoor model experiment[J]. Engineering Mechanics, 2018, 35(11): 240-248.
[12] DANTU P A. Contribution to the mechanical and geometrical study of non-cohesive masses[C]// Proceedings of the 4th International Conference on Soil Mechanics and Foundations Engineering. London: Butterworths Scientific Publications, 1957, 1(1): 144-148.
[13] HORNE M R. The behaviour of an assembly of rotund, rigid, cohesionless particles. Ⅱ[J]. Proceedings of the Royal Society A (Mathematical, Physical and Engineering Science), 1965, 286(1404): 79-97.
[14] EDWARDS S F, OAKESHOTT R. The transmission of stress in an aggregate[J]. Physica D (Nonlinear Phenomena), 1989, 38(13): 88-92.
[15] BOUCHAUD J P, CATES M E, CLAUDIN P. Stress distribution in granular media and nonlinear wave equation[J]. Journal de Physique I, 1995, 5(6): 639-656.
[16] BAGI K. Statistical analysis of contact force components in random granular assemblies[J]. Granular Matter, 2003, 5(2): 45-54.
[17] WANG Y H, LEUNG S C. Characterization of cemented sand by experimental and numerical investigations[J]. Journal of Geotechnical and Geoenvironmental Engineering, 2008, 134(7): 992-1004.
[18] 孙其诚, 王光谦. 静态堆积颗粒中的力链分布[J]. 物理学报, 2008, 57(8): 4667-4674.
SUN Qi-cheng, WANG Guang-qian. Force distribution in static granular matter in two dimensions[J]. Acta Physica Sinica, 2008, 57(8): 4667-4674.
[19] 孙其诚, 王光谦. 颗粒流动力学及其离散模型评述[J]. 力学进展, 2008, 38(1): 87-90.
SUN Qi-cheng, WANG Guang-qian. Review on granular flow dynamics and its discreate element method[J]. Advance in Mechanics, 2008, 38(1): 87-90.
[20] 辛海丽, 孙其诚, 刘建国, 等. 刚性块体压入颗粒体系时的受力及力链演变[J]. 岩土力学, 2009, 30(S1): 88-93.
XIN Hai-li, SUN Qi-cheng, LIU Jian-guo, et al. Evolution of force chains in a granular assembly based on indentation test[J]. Rock and Soil Mechanics, 2009, 30(S1): 88-93.
[21] 胡 洲, 刘小燕, 武伟宁. 基于数据驱动的非球形散体颗粒休止角智能建模方法[J]. 中国有色金属学报, 2020, 30(1): 227-234.
HU Zhou, LIU Xiao-yan, WU Wei-ning. Data driven intelligent modeling method for angle of reponse of non-spherical discrete particles[J]. The Chinese Journal of Nonferrous Metals, 2020, 30(1): 227-234.
[22] 刘 迪, 卢才武, 连民杰, 等. 基于粒径效应影响的尾矿毛细特性试验[J]. 中国有色金属学报, 2020, 30(11): 2746-2757.
LIU Di, LU Cai-wu, LIAN Min-jie, et al. Experiment on tailings capillary characteristics based on particle size effect[J]. The Chinese Journal of Nonferrous Metals, 2020, 30(11): 2746-2757.
[23] 付龙龙, 周顺华, 田志尧, 等. 双轴压缩条件下颗粒材料中力链的演化[J]. 岩土力学, 2019, 40(6): 2427-2434.
FU Long-long, ZHOU Shun-hua, TIAN Zhi-rao, et al. Force chain evolution in granular materials during biaxial compression[J]. Rock and Soil Mechanics, 2019, 40(6): 2427-2434.
[24] 张 炜, 周 剑, 于世伟, 等. 双轴压缩下颗粒物质接触力与力链特性研究[J]. 应用力学学报, 2018, 35(3): 530-538.
ZHANG Wei, ZHOU Jian, YU Shi-wei, et al. Investigation on contact force and force chain of granular matter in biaxial compression[J]. Chinese Journal of Applied Mechanics, 2018, 35(3): 530-538.
[25] ROTHENBURG L, BATHURST R J. Analytical study of induced anisotropy in idealized granular materials[J]. Géotechnique, 1989, 39(4): 601-614.
[26] 张 炜, 周 剑, 于世伟, 等. 离散元法金属粉末高速压制过程中力链特性量化研究[J]. 机械工程学报, 2018, 54(10): 85-92.
ZHANG Wei, ZHOU Jian, YU Shi-wei, et al. Quantitative investigation on force chains of metal powder in high velocity compaction by using discrete element method[J]. Journal of Mechanical Engineering, 2018, 54(10): 85-92.
Simulation on evolution characteristics of force chain in granular ore rock with single funnel under flexible isolation layer
CHEN Qing-fa, QIN Shi-kang. YANG Cheng-ye
(School of Resources, Environment and Materials, Guangxi University, Nanning 530004, China)
Abstract: It is of great significance to carry out the simulation on the evolution characteristics of the force chain in granular ore rock with a single funnel under a flexible isolation layer so as to further reveal the internal mechanism of the flow law of the granular medium under the flexible isolation layer. Based on the numerical test model of the mass draw and synchronous filling with shrinkage stoping method, the evolution characteristics of the force chain length, quantity, intensity, direction and collinear coefficient in the granular medium system with a single funnel during ore drawing process are quantitatively studied by using the powerful data processing and image output functions of PFC and combining with the relevant knowledge of contact mechanics and statistical mechanics. The results show that in the ore drawing process with a single funnel under a flexible isolation layer, the ratio of strong contact gradually decreases from 37% to 32% with the increase of ore drawing times, and gradually remains stable in the later stage of ore drawing. As a structure of strong contact self-organization, the contact ratio of force chain contact is stable at about 17% in the ore drawing process. The total number of force chains gradually decreases with the increase of the number of ore drawing, and stabilizes at about 810 in the later period of ore drawing. The probability distribution of force chain length under different times of ore drawing is almost the same, which decreases exponentially with the increase of the length of the force chain. The probability distribution of force chain strength under different times of ore drawing firstly increases exponentially and then decreases exponentially, and a peak value appears at 0.7( is the average contact force). In the initial stage of ore drawing, the force chain is mainly distributed along the vertical direction, and its distribution pattern is similar to that of peanut, with the increase of ore particles sustained drawn, the direction of the force chain distribution from peanut shape gradually into elliptical form eventually evolved into a petal shape form, and the main direction of force chain distribution evolved from one to three (the vertical direction and the direction with ±30o angle to the horizontal direction). The collimation coefficient of the force chain reached its peak after the 9th ore drawing, and then gradually declined and remained stable.
Key words: flexible isolation layer; granular media; force chain; synchronous filling; discrete element
Foundation item: Project(51964003) supported by the National Natural Science Foundation of China
Received date: 2019-09-30; Accepted date: 2020-01-07
Corresponding author: CHEN Qing-fa; Tel: +86-771-3233186; E-mail: chqf98121@163.com
(编辑 龙怀中)
基金项目:国家自然科学基金资助项目(51964003)
收稿日期:2019-09-30;修订日期:2020-01-07
通信作者:陈庆发,教授,博士;电话;0771-3233186;E-mail:chqf98121@163.com

