
J. Cent. South Univ. (2018) 25: 482-489
DOI: https://doi.org/10.1007/s11771-018-3752-5

Bubble behavior in aluminum reduction cell with inert anode
ZHOU Yi-wen(������)1, 2, ZHOU Jie-min(������)1, CHEN Shou-hui(����)2,LIU Zhi-ming(��־��)2, BAO Sheng-zhong(������)2
1. School of Energy Science and Engineering, Central South University, Changsha 410083, China;
2. Zhengzhou Non-ferrous Metals Research Institute Co. Ltd. of CHALCO, Zhengzhou 450041, China
 Central South University Press and Springer-Verlag GmbH Germany, part of Springer Nature 2018
Abstract: The bubble behavior is one of the key factors for the design and the process of aluminum reduction cell using inert anode. A see-through cell is constructed to investigate the bubble flow behavior and the electrolyte flow pattern induced by bubbles. The test results show that the electrolyte is driven by the bubble to move around the cathode, and also some vortices occur in local areas. The bubble generated at the anode bottom undergoes the processes of formation, growth, sliding, detachment and coalescence. However, the bubble generated at the middle of anode detaches rapidly from the anode surface and moves upward and collides with other bubbles, which results in coalescence or break-up. Most bubbles are released into the atmosphere at the liquid surface, while some other bubbles taken by the electrolyte flush to the height higher than the mean horizontal level of the liquid and then drop down and move horizontally and they are released finally. Some bubbles are kept unbroken and are sliding on the electrolyte surface. The diameter of bubble generated at inert anode is smaller than that of bubble generated at graphite anode. Moreover, the bubbles on inert anode are spherical, which was different from those in tubular or disk form on graphite anode.
Key words: inert anode; bubble; diameter; releasing
Cite this article as: ZHOU Yi-wen, ZHOU Jie-min, CHEN Shou-hui, LIU Zhi-ming, BAO Sheng-zhong. Bubble behavior in aluminum reduction cell with inert anode [J]. Journal of Central South University, 2018, 25(3): 482�C489. DOI: https://doi.org/10.1007/s11771-018-3752-5.
1 Introduction
Aluminum is a fundamental material for national economic activities. However, its pollution is also an arising concern worldwide. 1.5 t of carbon dioxide equivalent per ton of aluminum produced has been directly released in the primary aluminum production process since the Hall�CHeroult process was invented in 1886.The possible solution to the high pollution is the new inert anode technology. A lot of achievements on inert anode technology have been made by the main aluminum producers in the world, such as Aluminum Corporation of America [1, 2], Rio Tinto Alcan Inc. [3], United Company Rusal [4], Moltech Systems Ltd, and many other research institutes and universities [5�C10]. However, overall success of the inert anode technology is based on the systematical breakthrough in inert material, new cell design and new electrolysis process. Practically, bubbles generated in the electrolysis process are one of the key factors for new cell structure design and for electrolysis process operation since the bubble motion and the electrolyte movements induced by bubbles have great influence on alumina concentration equilibrium in cell as well as on current efficiency. Hence, it is of significance to investigate the bubble behavior in aluminum reduction cell.
XU et al [11] observed the bubble formation on metallic inert anode in a two-compartment see-through quartz cell at 850 ��C. The anode was 22.30 mm in width and 7 mm in thick and the compartment was 20 mm in width, 40 mm in length and 80 mm in height. The bubble formation was filmed by a video camera.The test results showed that oxygen was not released from the anodic surface until a higher current density. It also showed that bubbles grew, coalesced to a bigger one and then were set free at the anodic surface. The diameter of released bubbles decreased with the increasing of current density. EIGELDINGER et al [12] recorded the bubble population and the diameter of the adhering bubbles in a visual field of 4.65 mm��4.65 mm in hydrogen-evolving electrolysis cell with circular working electrode of 35 mm. The experiment was carried out at room temperature and the flow of bubble was recorded from the top of optical set-up.The results showed the bubble coverage on the anode surface decreased as the flow velocity increased. The fractional bubble coverage obtained from the stagnant electrolyte was not applicable to industrial reactors. VOGT [13, 14] theoretically analyzed the gas- evolution efficiency. It was controlled not only by the bubble coverage but also by the impact of macro-convective and micro-convective mass transfer. HYDE et al [15] measured the bubble resistance in a low melting electrolyte cell at 450 ��C with anode of 8 cm in length using the ceramic beads as bubbles. WANG et al [16] established a full scale water model to investigate the bubble movement in aluminum reduction cells with gas evolution simulated by air injecting. XUE et al [17] developed a one-anode-scale cell by the electrolysis of CuSO4. MORSHED et al [18] investigated the bubble behavior in a 1/4 scale model of Hall- Heroult cell by the electrolysis of CuSO4 at 45�C50 ��C. The average bubble cross-sectional diameter and thickness of the departing bubbles from the edge of the anode surface were measured using the high speed camera.
In conclusion, previous research indicates that it is the effective way to investigate the bubble behavior by filming with video camera. The bubble can be generated by physical modeling by air injection or by gas-evolving electrolysis in the aqueous solution, or by bench-scale experiment of electrolysis with small electrodes. However, QIAN et al [19, 20] pointed out that the bubbles generated by electrolysis are smaller than those formed by forcing air through tubes or porous plate. Moreover, in the bench-scale experiments, the anodes are too small (10�C40 mm) and only a few bubbles are generated. Hence, it is difficult for bubble flow to be fully developed. What��s more, as for inert anode cell, a few pilot experiments were carried out in the world. But few results were released for they were kept as commercial secrets. Therefore, the aim of this work is to obtain the understanding of the electrolytic bubble formation and movement in a vertical inert anode cell with bubbles generated by actual electrolysis using the proposed large scale anode. What happened in the electrolysis process in the see-through cell is filmed by a video camera.
2 Experiment set-up and operation procedure
As the aluminum reduction process is conducted in a strong corrosive electrolyte at high temperate, it is difficult to directly observe electrolysis phenomenon in industrial cell. Hence, as shown in Figure 1, a big see-through cell is constructed.
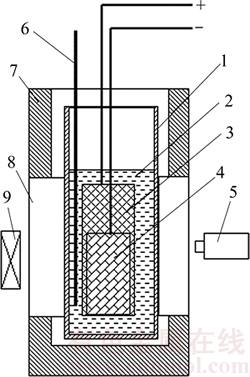
Figure 1 Schematic diagram of experimental apparatus (1�CQuartz crucible; 2�CElectrolyte; 3�CAnode; 4�CCathode; 5�CVideo camera; 6�CThermocouple; 7�CFurnace; 8�C Observation window; 9�CLamp)
The main specifications are listed below: effective size of the furnace, 300 mm��350 mm�� 460 mm; size of the observation window in furnace, 50 mm��200 mm; size of quartz crucible, 220 mm�� 240 mm��280 mm; size of anode, 45 mm��110 mm�� 200 mm; size of cathode, 40 mm��90 mm��120 mm; height of the electrolyte, 230 mm; operating temperature, 850 ��C; speed of the video camera, 50 frames per second; current density, 0.741 A/cm2; anode, 10NiO-NiFe2O4 based cermet [21]; cathode, graphite with coated TiB2; electrolyte [22], KF 44.5%, AlF3 49% (mass fraction), Al2O3 6.5%, CR=1.31.
The solid electrolyte was prepared and turned into molten state in another furnace. The temperature of the see-through cell and molten electrolyte was monitored through a thermocouple. When both of the temperatures reached the expected value, the molten electrolyte was poured into the see-through cell and then the electrodes were installed as soon as possible. Then the power supply was turned on and set to the desired current density to commence the electrolysis. A strong light source was set at one side of the cell and the video camera was set at the other side to film the bubble formation and movement.
3 Results and discussions
After the electrolyte was transferred into the see-through cell, the electrodes could not be clearly observed in the vague electrolyte because of the rapid decrease of temperature. About 3 min after the power supply was turned on, the electrolyte turned clearly and the bubble formation and movements could be observed and filmed.
3.1 Bubbles at anode bottom
The bubble was nucleated at the anode surface right after the power was on. The nucleation points uniformly distributed. The bubble grew at the nucleation point until it reached the neighbor bubbles. Then the coalescence occurred and then a larger bubble was formed. After the bubbles inflated to a certain volume, the bubbles detached from the nucleation points and slid along the anode surface. At the nucleation site, small new bubbles were emerging again, which is quite different from the existing of clear areas in physical modeling [16, 23, 24]. As observed by MORSHED [18], Figure 2 also shows that although small bubbles generate on the entire anode surface, the bubbles grow bigger only at a limited number of nucleation sites. On the anode surface, the sliding bubbles will collide with bubbles and engulf the small bubbles on the way and subsequently they become even bigger. However, when the sliding bubbles are colliding with big bubbles, some of the sliding bubbles coalesce with those bubbles, and some of the sliding bubbles adhere to those bubbles and move along the anode surface together with those bubbles. The moving velocity of the big bubbles on the anode surface is in the range of 0.006�C0.344 m/s. At last the sliding bubbles detach from the anode surface and are released into the electrolyte. They move upward because of the buoyancy. It is observed that the shape of the detached bubbles is spherical and they keep spherical during ascending with minor deformation. It takes the sliding bubble at the lowest location of the anode (Point A in Figure 2(0.00 s)) at about 1.4 s to slide from its starting point to the releasing location. Less time is needed for other bubbles. It takes the bubbles at the one quarter of the thickness of the anode (Point B in Figure 2 (0.00 s)) at about 0.06 s. For bubbles at the left side of point B, they move too fast for the filmed data to distinguish the time interval between the start of sliding and end of releasing.
3.2 Bubbles at middle of anode
Different from the traditional electrode in aluminum reduction cell, the working surface of the electrode in this study was vertical. Theoretically, the bubbles are formed at the nucleation sites and then detach from anode surface because of the flow of bubble and electrolyte. Unlike a sliding procedure along the anode surface at the anode bottom, the bubbles generated at the middle of the anode went directly in the electrolyte.
The bubbles rose vertically along the space adjacent to the anode surface. They diffused a little from the anode side to the cathode side. Figure 3 shows that the number of bubbles decreased with the increasing of distance from the anode surface.
Different bubbles collided during rising due to their different moving speed. Three kinds of phenomena were observed as the colliding occurred. In the first case, the collided bubbles adhered to each other and rose together at the same speed, but they all were kept as different bubbles. In the second case, the collided bubbles coalesced and turned into one larger bubble. In the third case, both coalescence and breakup occurred.
It was also noticed that the bubble flow along the anode was not a laminar flow, which was owing to the different bubble size, number and moving speed at different height. As a result, transitional flow was formed at the space adjacent to the anode surface.
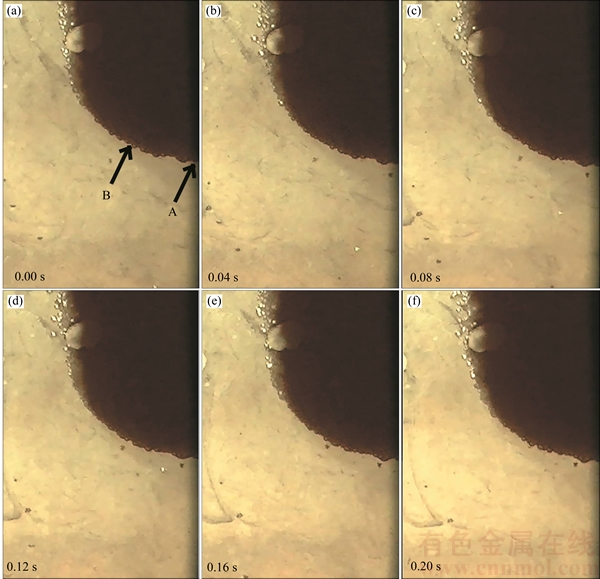
Figure 2 Bubble formation at bottom of anode
3.3 Bubbles near liquid surface
Similar to the bubbles generated at the middle of the anode, the bubbles generated near the liquid surface detached from the anode surface right after they left the nucleation site. Most of the bubbles in the electrolyte were released into atmosphere as they reached the liquid surface. However, a small part of the bubbles far away from the anode surface didn��t reach the liquid surface and they flowed horizontally along with electrolyte. Meanwhile, the electrolyte flow was totally induced by bubble movement and it ran to the height higher than the mean liquid level where bubbles were released and then the electrolyte dropped down by gravity as shown in Figure 4. The way of the rising and dropping looks like a parabolic curve. The unreleased bubbles were taken by the electrolyte to flow horizontally with a little diving movement. The diving depth was measured by processed image using image processing software. The maximum diving depth was 0.024 m. Consequently, it should be noted that the cathode should be placed at least 3 cm below the liquid level in the design of new cell. Finally, the unreleased bubble went to the liquid surface and released into the air owing to the buoyancy. Figure 4 also indicates that some bubbles didn��t break immediately after they are released from the electrolyte. They are sliding on the electrolyte surface for a few seconds before it broke.
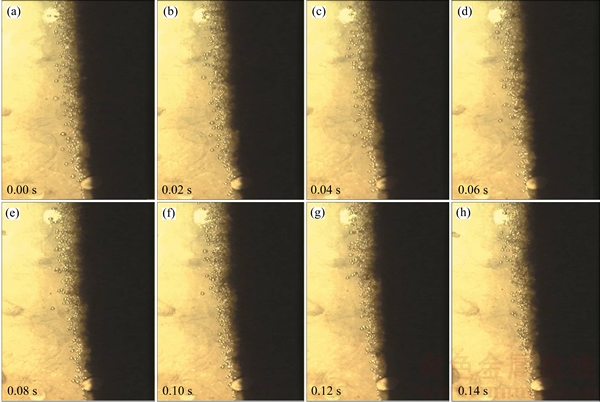
Figure 3 Bubble flow at middle part of anode

Figure 4 Bubble flow at top of anode
3.4 Electrolyte movement
The electrolyte was induced by the bubble movement and rose with the bubbles, the movement of which is shown in Figure 5. The outline of the anode is shown as the solid line in Figure 5 (0.04 s) and the dashed line is the outline of mixture flow of bubbles and electrolyte. The main path of the movement of electrolyte on the anode surface indicates as the line is shown in Figure 5 (0.02 s). The line is flat at the anode bottom and it turns into a swaying curve at the middle of anode. Hence, it shows that at the anode bottom, the electrolyte flow was a laminar flow, but it turned into a transitional flow at the middle of the anode. As aforementioned, the electrolyte went upheaval at the liquid surface near anode owing to the inertial effect. And then it flowed horizontally to the opposite surface of the working cathode surface. After it went downward, it went through under the cathode and reached the area near the anode bottom. Hence, the major circulation of electrolyte was formed in the cell as the line shown in Figure 5 (0.00 s).
Apart from the major circulation of the electrolyte around the cathode, some electrolyte vortexes occurred in the local areas, such as the intersection area of rising bubble and horizontal bubble flow as the circle at the upper-right corner shown in Figure 5 (0.06 s). The circle is fixed at this location with a minor deviation. The diameter of this circle is 3.6 cm. Also eddy flow occurred in the area next to the cathode surface and between the anode and cathode as the dotted line at the lower-left corner shown in Figure 5 (0.06 s). This vortex has no fixed shape and its moving is in the manner of spiral uprising and it weakens and gradually becomes disappeared.
It should be noticed that the flow of electrolyte in pilot experiment will be different from that in this work as just one anode and one cathode are placed in this cell and several anodes and cathodes are placed in the pilot cell.
3.5 Bubble diameter
The bubble diameter was measured by processed image. HYDE et al [15] reported that the bubble diameter generated in aluminum reduction cell ranged from 5.3 mm to 12.5 mm. And at the beginning of electrolysis, the shapes of the bubbles were spherical and then slowly turned into ellipsoid as they grew bigger, and at last they it converted to the disk plate under the anode.MORSHED et al [18] reported that the measured mean bubble cross-section diameter was 10.76 mm with a standard deviation of 4.47 mm at 1�� of anode inclination angle in electrolysis of CuSO4. However, the diameter of detached bubble measure by CASSAYRE et al [25] was 18 mm at current density of 0.2 A/cm2 and was 7 mm at current density of 1.6 A/cm2 using graphite anode. The diameter of bubbles before coalescence using inert anode (tin, copper or copper-nickel) is as small as 0.1 mm.
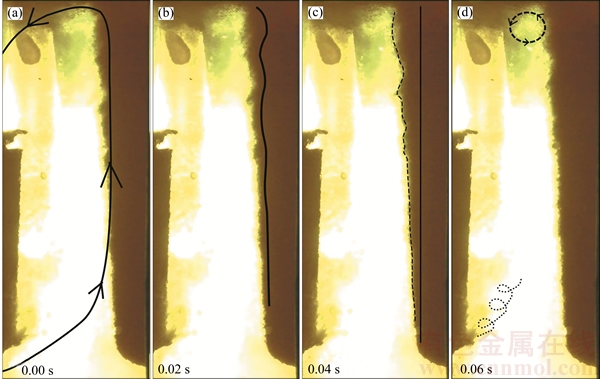
Figure 5 Electrolyte movement
The experiment of this work was operated at 0.741 A/cm2 of the practical current density of smelting cell. Large quantities of bubbles were generated and were moving fast. With the low speed camera, it was difficult to capture bubbles before coalescence as the bubbles were prone to coalesce. Therefore, only the diameter of detached bubbles or coalesced bubble was measured in this work. The results are listed in Table 1.
Table 1 Diameter of bubble
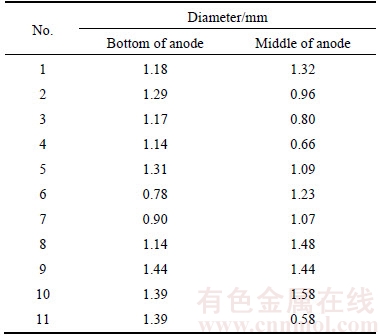
Compared with the results made by HYDE, MORSHED and CASSAYRE, the diameter of this work is much smaller than that generated at graphite anode. Theoretically, the bubble will leave the nucleation site when the buoyancy force was large enough to overcome the surface tension and drag force. And it is more likely to generate small bubble by using vertical anode in this work than that by using horizontal anode. However, the diameter of this work is greater than that obtained by CASSAYRE using horizontal inert anode. It is probably owing to the coalescence, leading to the bigger bubble. The other reason is ascribed to the different inert anode material as pointed out by CASSAYRE that the bubble characteristics could be affected by anode properties.
4 Conclusions
In this work, a large see-through cell of aluminum reduction with inert anode is presented. And the phenomena of bubble generation, growth, sliding, detaching, coalescence and break-up are observed during electrolysis. The experimental results bring the following conclusions. Firstly, the bubble behavior varies with the locations in the cell. Secondly, the diameter of bubble generated at inert anode is smaller than that of at graphite anode. Thirdly, on the basis of experimental results it shows that the electrolyte is driven by the bubble moves around the cathode, and there are some vortices in local areas.
References
[1] LIU Xing-hua, DIMILIA R A, DYNYS J M, MARTELLO J S. Systems and methods of protecting electrolysis cells: USA, US9340887[P]. 2016�C05�C17.
[2] DIMILIA R A, LIU Xing-hua, WEIRAUCH J D. Stable anodes including iron oxide and use of such anodes in metal production cells: USA, US7507322[P]. 2009�C03�C15.
[3] CHRISTIAN B, SYLVIE B, ARMAND G, VERONIQUE L, ARIANE M. Electrode material and use thereof for the manufacture of an inert anode: France, WO2015198128[P]. 2015�C06�C23.
[4] OLEGOVICH G A, VIKTOROVICH A E, VLADIMIROVICH I V, VASILEVICH B V. Electric contact unit of inert anode for obtaining aluminium fused salt and method for its erection: Russia, RU20090119067[P]. 2009�C05�C21.
[5] WANG Biao, LIANG Feng, WANG Yu-dong, PENG Kun. Pilot test of aluminum electrolysis by the NiFe2O4-M inert anode [C]//WILLIAMS E. Light Metals 2016. Hoboken, New Jersey: John Wiley & Sons, 2016: 429�C431.
[6] LAI Yan-qing, HUANG Li-feng, TIAN Zhong-liang, WANG Jia-wei, ZHANG Gang, ZHANG Yong. Effect of CaO doping on corrosion resistance of Cu/(NiFe2O4-10NiO) cermet inert anode for aluminum electrolysis[J]. Journal of Central South University of Technology, 2008, 15(6): 743�C747.
[7] SHI Kai-hua, ZHOU Ke-chao, ZHANG Lei, LI Zhi-you. Microstructure characterization of NiFe2O4-NiO solid-solid diffusion couple [J]. Journal of Central South University, 2012,19(9): 2411�C2415.
[8] TIAN Zhong-liang, LAI Yan-qing, LI Jie, LIU Ye-xiang. Electrical conductivity of Cu/��10NiO-NiFe2O4�� cermet inert anode for aluminum electrolysis [J]. Journal of Central South University of Technology, 2007, 14(5): 643�C646.
[9] LI Jie, WANG Zhi-gang, LAI Yan-qing, LIU Wei, YE Shao-long. Effect of working condition on thermal stress of NiFe2O4-based cermet inert anode in aluminum electrolysis [J]. Journal of Central South University of Technology, 2007, 14(4): 478�C484.
[10] ZHAN Shui-qing, LI Mao, ZHOU Jie-min, YANG Jian-hong, ZHOU Yi-wen. CFD simulation of effect of anode configuration on gas�Cliquid flow and alumina transport process in an aluminum reduction cell [J]. Journal of Central South University, 2015, 22(7): 2482�C2492.
[11] XU Jun-li, SHI Zhong-ning, GAO Bing-liang, QIU Zhu-xian. Bubble behavior on metal anode of aluminum electrolysis [J]. The Chinese Journal of Nonferrous Metals, 2004, 14(2): 298�C301. (in Chinese)
[12] EIGELDINGER J, VOGT H. The bubble coverage of gas-evolving electrodes in a flowing electrolyte [J]. Electrochimica Acta, 2000, 45(27): 4449�C4456.
[13] VOGT H. On the gas-evolution efficiency of electrodes I�C eheoretical [J]. Electrochimica Acta, 2011, 56: 1409�C1416.
[14] VOGT H. On the gas-evolution efficiency of electrodes II�C numerical analysis [J]. Electrochimica Acta, 2011, 56: 2404�C2410.
[15] HYDE T M, WELCH B J. The gas under anodes in aluminium smelting cells part I: Measuring and modelling bubble resistance under horizontally oriented electrodes [C]// HUGLEN R. Light Metals 1997. Hoboken, New Jersey: John Wiley & Sons, 1997: 333�C340.
[16] WANG Y, ZHANG L, ZUO X. Fluid flow and bubble behaviour in the aluminium electrolysis cell [C]// GEOFF B. Light Metals 2009. Hoboken, New Jersey: John Wiley & Sons, 2009: 581�C586.
[17] XUE Yu-qing, ZHOU Nai-jun, BAO Sheng-zhong. Normal temperature analogue experiment of anode bubble's behavior in aluminum electrolysis cells [J]. The Chinese Journal of Nonferrous Metals, 2006, 16(10): 1823�C1828. (in Chinese)
[18] MORSHED A, MORSI Y, YANG W. Investigation of electrolytic bubble behavior in aluminium smelting cell [C]// SADLER B A. Light Metals 2013. Hoboken, New Jersey: John Wiley & Sons, 2013: 591�C596.
[19] QIAN K, CHEN J J J, MATHEOU N. Visual observation of bubbles at horizontal electrodes and resistance measurements on vertical electrodes [J]. Journal of Applied Electrochemistry, 1997, 27(4): 434�C440.
[20] QIAN K, CHEN Z D, CHEN J J J. Bubble coverage and bubble resistance using cells with horizontal electrode [J]. Journal of Applied Electrochemistry, 1998, 28(10): 1141�C 1145.
[21] ZHANG Gang. Densification and strengthening of Fe2O4-10NiO based cermet inert anode for aluminum electrolysis [D]. Changsha: Central South University, 2007, 48�C57. (in Chinese)
[22] YANG J H, HRYN J N, KRUMDIC G K. Aluminum electrolysis tests with inert anodes in KF-AlF3-based electrolytes [C]// GALLOWAY T J. Light Metals 2006. Hoboken, New Jersey: John Wiley & Sons, 2006: 421�C424.
[23] FORTIN S, GERHARDT M, GESING A J, Physical modelling of bubble behaviour and gas release from aluminum reduction cell anodes [C]// MCGEER J P. Light Metals 1984. Hoboken, New Jersey: John Wiley & Sons, 1984: 721�C741.
[24] ZORIC J, SOLHEIM A. On gas bubbles in industrial aluminium cells with prebaked anodes and their influence on the current distribution [J]. Journal of Applied Electrochemistry, 2000, 30(7): 787�C794.
[25] CASSAYRE L, UTIGARD T, BOUVET S. Visualizing gas evolution on graphite and oxygen-evolving anodes [J]. Journal of Metals, 2002, 54(5): 41�C45.
(Edited by YANG Hua)
���ĵ���
���������������ڵ�������Ϊ
ժҪ�����ݵ���Ϊ�Ƕ���������������ƺ��տ��Ʊ��뿼�ǵ���Ҫ���ء�Ϊ���о����ݵ���Ϊ�͵���ʵ�������̬�����������������Խ��й۲졣��������������������������������ڵ����Χ��������ѭ���˶������ھֲ������γ����С�����������������ƺʹ�ֱ�����档���������ƣ��ܹ��۲쵽���ݵ��γɡ������ƺ����������Ȼ����������ֱ�����������������Ѹ�����룬Ȼ�������˶���;������������ײ���������ݵIJ��ۻ����顣�����ݴﵽҺ��ʱ�����ݳ��������У��ٲ������ݱ����ˮƽҺ��ĵ����Я���ż��������˶����γ�һ�����壬Ȼ����ˮƽ�˶��������ݳ����ڵ���ʱ��棬���������ܱ��ֲ����ѣ����ڵ�����ϻ�����ͨ���Աȷ��������������ϲ��������ݱ�ʯī�����ϲ������ݵ�ֱ��С�����⣬ʯī�����ϵ����ݲ������Σ�����Բ��״���ƽ״�����������ϵ���������Ƴ���״��
�ؼ��ʣ��������������ݣ�ֱ�����ݳ�
Foundation item: Projects(51304216, 51371161) supported by the National Natural Science Foundation of China
Received date: 2016-07-12; Accepted date: 2017-12-20
Corresponding author: ZHOU Yi-wen, PhD; Tel: +86�C13838184452; E-mail: singingalone@sina.com; ORCID: 0000-0001-6037-7940

