J. Cent. South Univ. (2012) 19: 1212-1218
DOI: 10.1007/s11771-012-1131-1
Quantitative structure-activity relationship of 2-alkyl-4-(biphenylylmethoxy) pyridine derivatives with AT1 receptor antagonistic activity
JIANG Yu-ren(������), CHEN Yu-ling(������), YANG Yan-yan(������), LIU qiang(��ǿ)
College of Chemistry and Chemical Engineering, Central South University, Changsha 410083, China
? Central South University Press and Springer-Verlag Berlin Heidelberg 2012
Abstract: The quantitative structure-activity relationship (QSAR) of 2-alkyl-4-(biphenylylmethoxy) pyridine derivatives was studied. Three different alignment methods were used to get the models of the comparative molecular field analysis (CoMFA), the comparative molecular similarity indices analysis (CoMSIA), and the hologram quantitative structure-activity relationship (HQSAR). The statistical results from the established models show believable predictivity based on the cross-validated value (q2>0.5) and the non-validated value (r2>0.9). The analysis on contour maps of CoMFA and CoMSIA models suggests that hydrophobic and hydrogen-bond acceptor fields are important factors that affect the AT1 antagonistic activity of 2-alkyl-4-(biphenylylmethoxy) pyridine derivatives besides the steric and electrostatic fields. The structural modification information from different atom contributions in the HQSAR model is in agreement with that in the 3D-QSAR models.
Key words: comparative molecular field analysis (CoMFA); comparative molecular similarity indices analysis (CoMSIA); hologram quantitative structure-activity relationship (HQSAR); AT1 antagonistic activity
1 Introduction
The renin-angiotensin-aldosterone system (RAAS) plays an integral role in the preservation of hemodynamic stability through the regulation of extracellular fluid volume, sodium balance, and cardiac and vascular tropic effects. In addition, overactivity of the RAAS is associated with the development of atherosclerosis, hypertension, left ventricular hypertrophy, and cardiovascular events, such as myocardial infarction, stroke, congestive heart failure, and nephrosclerosis [1].
The AT1 receptor plays a major role in the pressor and tropic actions of the Ang II, and much effort has been spent in developing non-peptide antagonists for this receptor for the treatment of hypertension and congestive heart failure [2]. Compared with the angiotensin- converting enzyme (ACE) and renin inhibitors, AT1 receptor antagonists are not associated with side effects, such as coughing and angioedema [3]. For this reason, it was particularly important when AT1 receptor antagonists were developed as a new class of antihypertensives used in the treatment of hypertension, heart failure, and renal diseases [4].
Although there are some reports on the development of a 3D-pharmacophore and 3D-QSAR (CoMFA) model for non-peptide AT1-receptor antagonists [4-6], the quantitative structure-activity relationship (QSAR) studies of these inhibitors have rarely been reported.
Three QSAR methods, comparative molecular field analysis (CoMFA), comparative molecular similarity indices analysis (CoMSIA) and hologram quantitative structure-activity relationship (HQSAR), were used to develop QSAR models for 23 2-alkyl-4- (biphenylylmethoxy) pyridine derivatives with AT1 receptor antagonistic activity. The third method, to the best of our knowledge, has never been applied to AT1-receptor antagonists. HQSAR is a modern 2D-QSAR technique that eliminates the need of 3D structure determination, conformational search and molecular alignment [7]. Compared with the 3D-QSAR technique, such as CoMFA and CoMSIA, HQSAR can also easily and rapidly generate QSAR models with high predictive ability for both small and large data sets. Therefore, it is believed that these three QSAR models would provide some new useful information for designing new AT1 antagonists with simpler structure and better biological activity.
2 Experimental
2.1 Material
Data of 23 compounds (structures and associated biological activities are given in Table 1 and their common structure is shown in Fig. 1(a)) were taken from Ref. [8]. In vitro activity values (IC50) were converted into pIC50 according to the formula pIC50=-lg(IC50), and the pIC50 values ranged from 6.52 to 8.40. All molecular modeling and QSAR studies were performed by SYBYL 7.3. And the last optimization of all molecular models was performed by Discovery Studio 2.1with a CFF force field [9].
Table 1 Structure of studied compounds, experimental IC50, pIC50, predicted pIC50 and residual values of molecular used in training and test sets for CoMFA, CoMSIA and HQSAR models
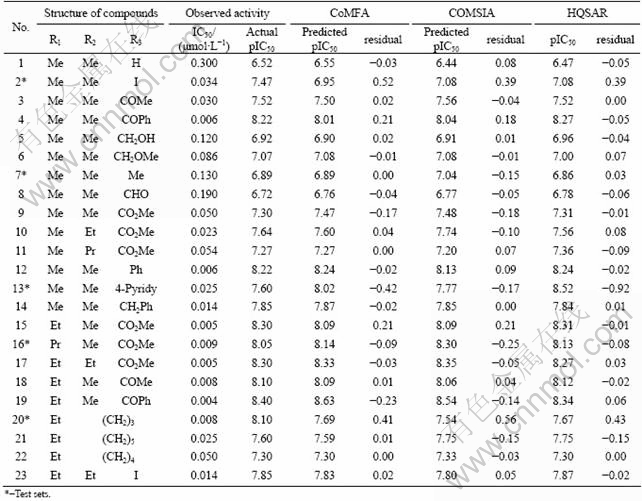
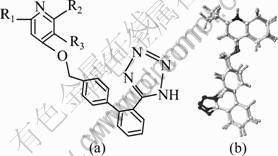
Fig. 1 Common structure of studied compounds (a) and alignment of Compound 22 optimized and unoptimized (b)
2.2 Methods
The pIC50 values were used as dependent variables in the CoMFA and CoMSIA analyses. The total set of AT1 receptor antagonists was divided into training (18 compounds) and test (5 compounds, marked with ��*�� in Table 1) sets in the approximate ratio of 4:1. Training and test sets were selected manually so that structurally diverse molecules possessing activities of wide range were included in both sets [10].
2.2.1 Molecular structure building and database alignment
The active conformation is the best choice for building good 3D-QSAR models, but it is difficult to determine their true active conformations with lack of the protein-ligand crystal structure. Usually, small molecule extracted from the active conformation of receptor-ligand complex can be used as the active conformation. If there is no crystal complex, the crystal structure of small molecule or an energetically minimized conformation can also be assumed to be active [11]. The crystal structure of Compound 22 [8] was obtained from the Cambridge Crystallographic Data Centre (CCDC). After molecular mechanics optimization, the structures were superimposed (Fig. 1(b)). The RMSD value is 0.408 971, indicating that the crystal structure before and after the structural change in energy was not obvious. And the optimized structure can be used as the template to build three-dimensional structures of the remaining small molecules. Molecular mechanics optimization parameters were set as follows: Tripos force field, Gasteiger-Huckel charge, distance-dependent dielectric constant, setting the energy convergence value to be 0.042 kJ/(mol��?), first 500 steps with steepest descent optimization, and then using the conjugate gradient method to optimize the molecule to the energy convergence [12]. All the structures of small molecules adopted the above optimization method. To get better CoMFA and CoMSIA models, all small molecules were imported into Discovery Studio 2.1, assigned CFF force field [9], and optimized again using Smart Minimize method.
Molecular alignment is considered as one of the most sensitive parameters in CoMFA analysis [13]. Once the active conformation is determined, pharmacophore or common substructure alignments are carried out. Three different alignment methods, namely, database, multifit, as well as atomfit alignments, were carried out and common substructure of the compounds was used for molecular superimposition. The compounds were fitted on the template molecule (Compound 19) making use of the heavy atoms of the common functionality presented in all compounds of this series.
2.2.2 CoMFA and CoMSIA 3D-analyses
CoMFA [14] and CoMSIA [15] were used for 3D-QSAR. CoMFA fields were generated using sp3 carbon probe atom carrying +1 charge to generate steric (Lennard-Jones 6-12 potential) and electrostatic (Coulomb potential) fields at each grid point. The steric and electrostatic energy values in CoMFA were truncated at 126 kJ/mol. The CoMFA fields were scaled by the CoMFA-STD method in SYBYL. The steric, electrostatic, hydrophobic, hydrogen bond donor and acceptor CoMSIA fields were derived [15]. The default value of 0.3 was used as the attenuator factor.
2.2.3 Hologram QSAR
HQSAR [7] module provides 12 default hologram length (53, 59, 61, 71, 83, 97, 151, 199, 257, 307, 353 and 401), which are prime numbers, in order to minimize the possibility of fragment collision. Statistical significant HQSAR models are derived from a training set and produced by Partial least squares (PLS) analysis. Cross-validation was done by means of Leave-one-out (LOO) procedure. The optimum number of components is obtained by performing LOO analysis with SAMPLS [16]. Through this procedure, each compound is systematically excluded once from the data set, and its predicted activity is obtained by the model derived from the remaining compounds. The predicted activities of the ��left out�� compounds are used to calculate the q2 and cross-validated standard error.
3 Results and discussion
CoMFA and CoMSIA 3D-QSAR models were derived using a series of 2-alkyl-4-(biphenylylmethoxy) pyridine derivatives [8]. The predictive power of the 3D-QSAR models derived using training set were assessed by predicting biological activities of the test set molecules. Generally, a high value of this statistical characteristic (q2>0.5) is considered as a proof of the high predictive ability of the model [17].
3.1 CoMFA analysis
Three CoMFA models using database, multifit, and atomfit alignments were considered in the final analysis. The statistical details are summarized in Table 2. The cross-validated q2 values for database and multifit are similar (0.640 and 0.601), while it is lower (0.576) in case of atomfit. The conventional r2 values for three alignments are similar (0.964, 0.969 and 0.964) with four, five and five components, respectively. The standard error of estimation value (SEE) for multifit is better (0.122) than that of database and atomfit alignments (0.126 and 0.130, respectively). The steric and electrostatic field contributions of all the three models are almost similar (~70:30), indicating more requirement of steric field in ligand-receptor interactions. Based on above observations, the best CoMFA model obtained by using multifit alignment was chosen for further analysis. The actual and predicted pIC50 values of training and test sets are listed in Table 1.
Compound 19 with the highest activity was selected as a reference molecule, and Stedev Coeff method was used to obtain steric and electronic field contours. The CoMFA steric and electrostatic field contour maps obtained from multifit alignment are shown in Figs. 2(a) and (b). The steric interactions are represented by green- and yellow-colored contours, while electrostatic interactions are represented by red- and blue-colored contours.
In Fig. 2(a), the substituents R1, R3, and the pyridine ring are covered with large yellow areas, indicating that large groups should not be introduced in these positions. In addition, R1 and R3 are covered with green areas, showing that introduction of large groups in these two positions can increase the compound activity, but considering that the yellow area is also covered in these two positions, the group introduced should not be much large. Table 1 shows that, when R2 and R3 are substituted by the same groups, the activity for the compound replaced by ethyl or propyl is better than that by methyl, such as Compounds 9 (pIC50=7.30), 15 (pIC50=8.30), and 16 (pIC50=8.05), and the activity for compound substituted by ethyl is best. Figure 2(b) shows that a large blue area near both the pyridine ring and R3 indicates that electropositive groups increase activity; while the carbonyl group is attached to methyl, methoxy and phenyl, and the activity for these compounds also increases. When the hydrogen in aldehyde group is substituted by methyl or phenyl, the activity significantly increases. The activity for compounds with methylene groups gets worse than that with carbonyl groups, such as Compound 14 (pIC50=7.85) and 4 (pIC50=8.22); 6 (pIC50=7.07) and 9 (pIC50=7.30).
Table 2 Results of various CoMFA and CoMSIA analyses
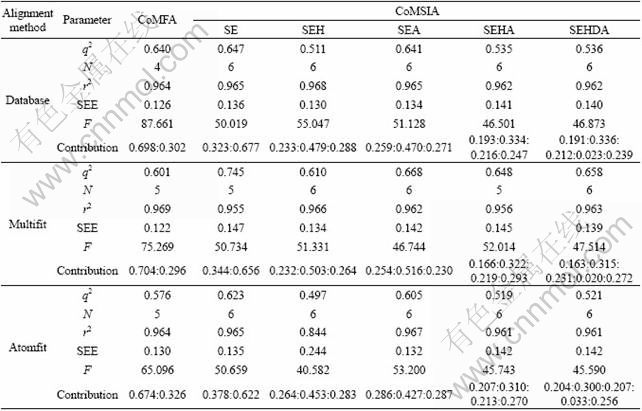
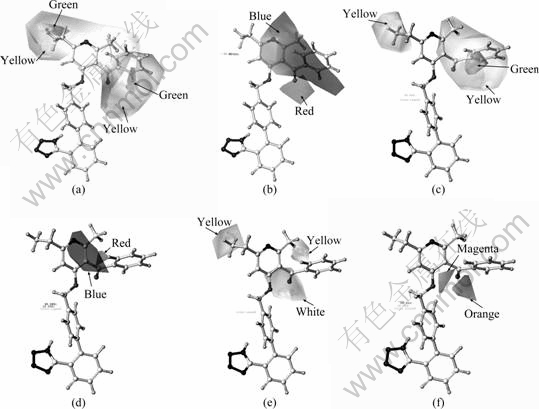
Fig. 2 Stereoview of contour plots of CoMFA (a and b) and CoMSIA (c-f): (a) Steric fields (green, bulky substitution favored; yellow, bulky substitution disfavored); (b) Electrostatic fields (blue, electropositive group favored; red, electronegative group favored; (c) Steric fields (green, bulky substitution favored; yellow, bulky substitution disfavored); (d) Electrostatic fields (blue, electropositive group favored; red, electronegative group favored); (e) Hydrophobic fields (yellow, favored; white, disfavored); (f) Hydrogen bond acceptor fields (magenta, favored; orange, disfavored)
3.2 CoMSIA analysis
PLS analyses of various CoMSIA models obtained using three different alignments and with different combinations of fields are listed in Table 2. The CoMSIA model that includes S, E, and A fields performs better than the other field combinations in the case of database (CoMSIA 1) and atomfit (CoMSIA 3) alignment methods. In contrast, the model with five fields performs better in the case of multifit (CoMSIA 2) alignment. The cross-validated q2 values for these three models are 0.641, 0.658, and 0.605, respectively. The conventional r2 values for these three models are almost similar (0.965, 0.963, and 0.967, respectively) with six components, while the standard errors of estimation values are also similar (0.134, 0.139, and 0.132, respectively). There are no significant differences between CoMSIA 1 and CoMSIA 3, but more fields are included in CoMSIA 2 and the PLS statistics are slightly better for CoMSIA 2. Hence, CoMSIA 2 was chosen for further analysis. The actual and predicted pIC50 values of the training and test sets for CoMSIA 2 are listed in Table 1.
In CoMSIA method, the steric fields are represented by green- and yellow-colored contours; the electrostatic fields are indicated by red- and blue-colored contours; the hydrophobic fields are represented by yellow- and white-colored contours; the hydrogen bond donor fields are indicated by cyan- and purple-colored contours; the hydrogen bond acceptor fields are denoted by magenta and orange contours.
The CoMSIA steric and electrostatic field contour plots obtained from multifit alignment employing S, E, H, D, and A fields are shown in Fig. 2. These plots (Figs. 2(c) and (d)) are more or less similar to the corresponding CoMFA plots (Figs. 2(a) and (b)), except that there are no green contours near the methyl at R1 which are presented in the corresponding CoMFA plot. The hydrophobic, hydrogen bond acceptor contours are shown in Figs. 2(c) and (d), respectively. The yellow hydrophobic contour near the methyl at R1 (Fig. 2(e)) matches with the yellow steric contour (Fig. 2(c)). This suggests that any small group with lipophilic characteristic is favorable at this position. The white hydrophobic contour near ��CO�� matches with the red electrostatic contour (Fig. 2(d)), and the orange hydrogen bond acceptor contour (Fig. 2(f)). This indicates that any small group with electronegative, hydrophilic and hydrogen bond donor characteristic is preferred at this position.
3.3 CoMFA versus CoMSIA
The predictive power of CoMFA and CoMSIA 2 3D-QSAR models was evaluated by using the test set of five molecules. The PLS statistics of both CoMFA and CoMSIA 3D-QSAR models indicate that CoMSIA is somewhat better than CoMFA. In two models, the predictive values fall close to the actual pIC50 values. (Figs. 3). In summary, multifit alignment method gets the best models for both CoMFA and COMSIA, and the differences between CoMFA and CoMSIA are not striking and both models demonstrate good predictive ability.
3.4 Hologram QSAR analysis
For the training set of 2-alkyl-4-(biphenylylmethoxy) pyridine derivatives, the fragment sizes (1-3, 4-7, 8-10) were employed to obtain the statistical values with the default A+B+C combination of fragment distribution parameters. The statistical results for the series of compounds are not shown. In order to improve the statistical results, different combinations of fragment distribution parameters with the fragment size of that model having the highest statistical values (the cross-validated value q2 is 0.713, the optimum number of components is 5, the best length is 59, and the best fragment size is 8-10) was applied. The statistical results of compounds with different fragment distribution parameters are summarized in Table 3. Finally, the optimal HQSAR model for the derivatives using atoms, bonds, and donor/acceptor as fragment distribution and 8-10 as fragment size displays q2=0.740 and r2=0.994. To obtain the derived HQSAR models, biological activities of an external test set were predicted using the models derived from the training set. In summary, the predicted pIC50 values for the series of compounds match well with the actual pIC50 values. And the differences between the predicted values and actual values are almost in the range of the allowable error, which indicates that the HQSAR model demonstrates a good prediction ability.
The result of the HQSAR analysis can be graphically displayed as a color-coded structure diagram, in which the color coding of each atom reflects the contribution of that atom to the overall activity of the molecule. The red end of the spectrum (red, red orange, and orange) represents the unfavorable or negative contribution to the activity, while the green end (yellow, green blue and blue) denotes favorable or positive contribution. Atoms with intermediate contribution to the activity are colored white. The common backbones (maximal common structures) are colored cyan. The individual atomic contributions of the three most active compounds are displayed in Fig. 4.
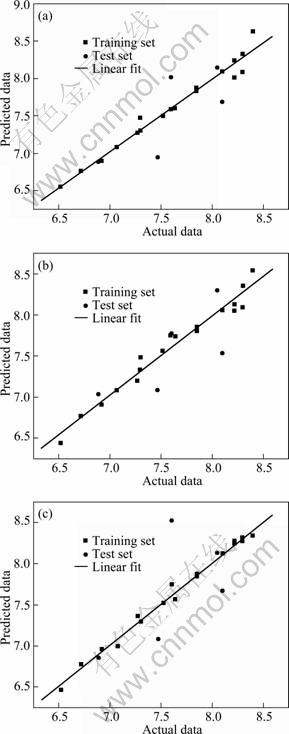
Fig. 3 Actual versus predicted pIC50 of training set and test set (a) CoMFA (multifit alignment); (b) CoMSIA2; (c) HQSAR model
Table 3 Influence of various fragment type parameters on HQSAR model
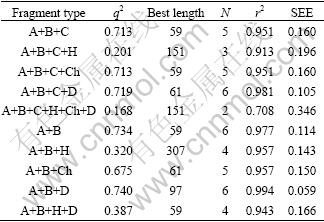

Fig. 4 Color coding figure of HQSAR model of Compounds 15 (a), 17 (b) and 19 (c)
In Fig. 4, the color-coded diagrams of Compounds 15, 17 and 19 show that the atoms on the methyl at R1 present green, indicating that they have positive contribution to the activity enhancement of these compounds. Hydrogen atoms on the methyl at R2 of Compounds 15 and 19 appear green and yellow, while the carbon atoms on the ethyl at R2 of Compound 17 present green and yellow, also indicating their favorable contribution to the activity enhancement. It is also concluded that methyl and ethyl groups at R2 have similar effect on the compound activity, which is consistent with the result from Ref. [8] (pIC50(15)=8.30, pIC50(17)=8.30). Hydrogen atoms on the ethyl at R2 of Compound 17 appear white, which indicates that they have neutral effect on the activity. Herein, in chemical synthesis process, the ethyl at R1 should be retained, which is consistent with the conclusions from the CoMFA and CoMSIA models that R1 should not be too large. The reason for that may be the only right size as an ethyl can get a better target binding. Taking the steric requirement and synthesis difficulty into account, methyl at R2 should be retained as far as possible because methyl and ethyl substituents have the similar effect on the activity. At R3, carbon and hydrogen atoms on the methyl of Compound 15, oxygen atoms on the carbonyl of Compound 17, and carbon atoms on the phenyl of Compound 19 present green and yellow, indicating their positive contributions to the activity enhancement, while the remaining atoms appear white, indicating their neutral effect on the activity. It is summarized that suitable substituents connected to carbonyl with greater steric hindrance are preferred at R3 position.
4 Conclusions
1) Three QSAR methods, CoMFA, CoMSIA and HQSAR, are used to investigate the relationship between the structures of 18 2-alkyl-4-(biphenylylmethoxy) pyridine derivatives and their activities in order to get new clues to develop new potent AT1 antagonists. Three different alignment methods are used to get the molecular conformations. And the 3D-QSAR models using conformations from the multifit alignment are better than those from database and atomfit alignments.
2) The high q2 from these QSAR methods suggest that three rational and predictive QSAR models have been successfully got. Predictions made with CoMFA and CoMSIA models on five compounds of the test set are in good agreement with the actual pIC50 values. Moreover, information derived from CoMFA and CoMSIA models can identify specific molecular factors responsible for differing activities in a group of molecules.
3) QSAR models generated through the HQSAR technique have comparable quality to CoMFA and CoMSIA. The HQSAR method also shows good agreement with both experiment and CoMFA, CoMSIA in the prediction of the five compounds of the test set. Furthermore, because HQSAR employs counts of substructural molecular fragments as descriptors and requires no 3D structures or molecular alignment, it is both fast and reproducible.
References
[1] FERRARIO C M, STRAWN W B. Role of the rennin-angiotensin- aldosterone system and proinflammatory mediators in cardiovascular disease [J]. The American Journal of Cardiology, 2006, 98: 121-128.
[2] MORSING P, VAUQUELIN G. How can the differences among AT1-receptor antagonists be explained [J]. Cell Biochemistry and Biophysics, 2001, 35: 89-102.
[3] KOSTIS J B, SHELTON B, GOSSELIN G, GOULET C, HOOD W B, KOHN R M, KUBO S H, SCHRON E, WEISS M B, WILLIS III P W, YOUNG G B, PROBSTFIELD J. Adverse effects of enalapril in the studies of left ventricular dysfunction (SOLVD) [J]. American Herat Journal, 1996, 131: 350-355.
[4] TUCCINARDI T, CALDERONE V, RAPPOSELLI S, MARTINELLI A. Proposal of a new binding orientation for non-peptide AT1 antagonists: homology modeling, docking and three dimensional quantitative structure-activity relationship analysis [J]. Journal of Medicinal Chemistry, 2006, 49: 4305-4316.
[5] DARTA P A, DESAI P V, COUTINHO E C. A 3D-QSAR of angiotensin II (AT1) receptor antagonists based on receptor surface analysis [J]. Journal of Chemistry Information and Computer Science, 2004, 44: 210-22.
[6] PARATE A, CHATURVEDI S C. Structural insights for 3H-1, -2, -4 triazolinones as angiotensin II receptor antagonists using QSAR techniques [J]. Medicinal Chemistry Research, 2010, 19(4): 375-391.
[7] TONG W, LOWIS D R, PERKINS R, CHEN Y, WELSH W J, GODDETTE D W, HERITAGE T W, SHEEHAN D M. Evaluation of quantitative structure-activity relationship method for large-scale prediction of chemicals binding to the estrogen receptor [J]. Journal of Chemistry Information and Computer Science, 1998, 38: 669-677.
[8] BRADBURY R H, ALLOTT C P, DENNIS M, GIRDWOOD J A, KENNY P W, MAJOR J S, OLDHAM A A, RATCLIFFE A H, RIVETT J E, ROBERTS D A, ROBINS P J. New nonpeptide angiotensin II receptor antagonists. 3. Synthesis, biological properties, and structure-activity relationships of 2-alkyl-4-(biphenylylmethoxy) pyridine derivatives [J]. Journal of Medicinal Chemistry, 1993, 36: 1245-1254.
[9] TSAI K C, CHEN Y C, HSIAO N W, WANG C L, LIN C L, LEE Y C, LI M, WANG B. A comparison of different electrostatic potentials on prediction accuracy in CoMFA and CoMSIA studies [J]. European Journal of Medicinal Chemistry, 2010, 45: 1544-155.
[10] KAUR K., TALELE T T. Structure-based CoMFA and CoMSIA study of indolinone inhibitor of PDK1 [J]. Journal of Computer- Aided Molecular Design, 2009, 23: 25-26.
[11] ZHU Li-li, XU Xiao-jie. 3D-QSAR analyses of melatonin antagonists [J]. Acta Physico-Chimica Sinica, 2002, 18(12): 1087-1092. (in Chinese)
[12] HAN Xiao-feng, LIU Ying, GAO Ying, LAI Lu-hua. Comparative molecular field analysis of non-peptidic inhibitors of thrombin [J]. Acta Physico-Chimica Sinica, 2003, 61(7): 1136-1139. (in Chinese)
[13] MACCARI R, OTTAN? R, CURINGA C, VIGORITA MG, RAKOWITZ D, STEINDL T, LANGER T. Structure-activity relationships and molecular modeling of 5-arylidene-2, 4-thiazolidinediones active as aldose reductase inhibitors [J]. Bioorganic & Medicinal Chemistry, 2005, 13: 2809-2823.
[14] KELLOGG G E, SEMUS S F, ABAHAM D J. HINT: A new method of empirical hydrophobic field calculation for CoMFA [J]. Journal of Computer-Aided Molecular Design, 1997, 5: 545-552.
[15] KLEBE G, ABRAHAM U, MIETZNER T. Molecular similarity indices in a comparative analysis (CoMSIA) of drug molecules to correlate and predict their biological activity [J]. Journal of Medicinal Chemistry, 1994, 37: 4130-4146.
[16] BUSH B L, NACHBAR R B. Sample-distance partial least squares: PLS optimized for many variables, with application to CoMFA [J]. Journal of Computer- Aided Molecular Design, 1993, 7: 587-619.
[17] GOLBRAIKH A, TROPSHA A. Beware of q2 [J]. Journal of Molecular Graphics ad Modeling, 2002, 20: 269-276.
(Edited by YANG Bing)
Foundation item: Project(20876180) supported by the National Natural Science Foundation of China
Received date: 2011-03-01; Accepted date: 2011-04-26
Corresponding author: JIANG Yu-ren, Professor, PhD; Tel: +86-731-86781389; E-mail: jiangyr@csu.edu.cn

