J. Cent. South Univ. (2012) 19: 93-100
DOI: 10.1007/s11771-012-0977-6
Estimation of surface tension of organic compounds using quantitative structure-property relationship
DAI Yi-min(戴益民)1, 2, 3, LIU You-nian(刘又年)1, LI Xun(李浔) 2, 3,
CAO Zhong(曹忠)2, 3, ZHU Zhi-ping(朱志平)2, 3, YANG Dao-wu(杨道武)2, 3
1. School of Chemistry and Chemical Engineering, Central South University, Changsha 410083, China;
2. Hunan Provincial Key Laboratory of Materials Protection for Electric Power and Transportation,
Changsha University of Science and Technology, Changsha 410004, China;
3. School of Chemistry and Biological Engineering,Changsha University of Science and Technology, Changsha 410004, China
? Central South University Press and Springer-Verlag Berlin Heidelberg 2012
Abstract: A novel quantitative structure-property relationship (QSPR) model for estimating the solution surface tension of 92 organic compounds at 20 °C was developed based on newly introduced atom-type topological indices. The data set contained non-polar and polar liquids, and saturated and unsaturated compounds. The regression analysis shows that excellent result is obtained with multiple linear regression. The predictive power of the proposed model was discussed using the leave-one-out (LOO) cross-validated (CV) method. The correlation coefficient (R) and the leave-one-out cross-validation correlation coefficient (RCV) of multiple linear regression model are 0.991 4 and 0.991 3, respectively. The new model gives the average absolute relative deviation of 1.81% for 92 substances. The result demonstrates that novel topological indices based on the equilibrium electro-negativity of atom and the relative bond length are useful model parameters for QSPR analysis of compounds.
Key words: surface tension; quantitative structure-property relationship (QSPR); topological indice; organic compound
1 Introduction
Surface tension is an important property in the fields of physics, chemistry and application science. Surface tension, like normal boiling point or chromatographic retention, is a physical property which is closely related to the molecular composition and structure. Surface tension of organic compound has also been identified as a key property in seeking the “green” cleaning agents [1-4]. Surface tension of liquid can usually be measured directly and a large amount of data is available. However, lack of resources and facilities makes the laboratory determination of the liquid surface tension of all of the ever increasing number of chemicals impractical. Hence, if it is not always possible to find reliable experimental values in practice, the estimation method of surface tension of organic compounds is required. For the estimation methods found in the literature, there are function methods, group contribution methods and quantitative structure-property relationship (QSPR) [5-10]. Some researchers have proposed theoretical methods of calculating surface tension based on thermodynamics [7]. These methods may be complex and require additional chemical properties and simplified assumptions to complete the calculation. Several quantitative structure-property relationships have been derived for the prediction of surface tension [8-10]. EGEMEN et al [8] proposed a group contribution method to predict the surface tension of liquid organic solvents. STANTON and JURS [9] used three multivariate linear regression methods to predict alkane, ester, and alcohol datasets, and got promising results. Each model was useful to predict the surface tension of the unique variety of compound. KAUFFMAN and JURS [10] used multiple linear regression and computational neural network to predict surface tension and got promising results. For these models, the model correlation coefficient between the experimental surface tension values and predicted values were lower than 0.95. Though considerable efforts had been devoted into these fields, and many QSPR monographs, articles and reviews were published, it was still an unsolved problem to correlate and predict the physicochemical property of compound from their molecular structure [11]. A major step in constructing the QSPR models was finding a set of molecular descriptors that represent variation in the properties of the molecule. The topological descriptor of the molecular structure, based on graph theory format, was particularly useful in characterizing the structure of organic compounds. Many topological indices had been proposed since the pioneering work of WIENER [12]. Some topological indices were widely used to account for isomeric variations of many physicochemical properties of organic compounds [13-14]. However, most of them could not reveal real connection among atoms, and were not suitable for multiple-bond organic compounds [6]. Hence, we try to use the relative topological distance to show the effect of the linking mode of each functional group, which can reflect the contribution of the same functional group for the surface tension. Regression model was used to predict the surface tension of 92 organic compounds using the YC and WC descriptors calculated from molecular structure. This method had a better performance in finding the relation between the physical properties of compound and its composition compared with a traditional topological index method.
2 Methodology
2.1 Calculation of molecular descriptors
As one of the main properties of atoms, electro- negativity represents the ability of atoms to obtain or lose electrons. The larger the electro-negativity of an atom is, the stronger the ability of the atom to attract electrons is. Based on the Pauling electro-negativity, the group electro-negativity, χG, can be calculated by the method of step-wise addition, which can be expressed as follows [15-16].
The equilibrium of the first level:

The equilibrium of the second level:


The equilibrium of the k-th level:

Then, group electro-negativity is defined as
 (1)
(1)
where n is the sum of atom or group directly attached to the ground atom, which is the left atom next to the dotted line labeled 1, 2, 3, …, k, … of each level in Fig. 1, and
 is the sum of electro-negativity of atom or group
directly attached to the ground atom. The electro- negativity is changed in the formation of a molecule. As long as a molecule is formed, the electro-negativity of atom in the molecule is fixed, that is to say, the electro- negativity is in the state of equilibrium, which is called the equilibrium electro-negativity of atom. The definition of equilibrium electro-negativity for atom i is
 (2)
(2)
where χiA is the Pauling electro-negativity for atom i, χG is the electro-negativity of group directly attached to atom i calculated by Eq. (1), and l is the group number directly attached to atom i. Equilibrium electro- negativity can efficiently characterize the electro- negativity of each atom in a molecule, and the equilibrium electro-negativity of atom can closely reflect the chemical environment of atom. Therefore, the equilibrium electro-negativity can effectively reflect the chemical information at the atom and group levels. Accordingly, the equilibrium electro-negativity matrix X is defined to reflect every chemical environmental change of a molecule. It is worth mentioning that χi could make up for the absence of hydrogen atom in a carbon skeleton graph because the equilibrium electro-negativity of hydrogen atoms is fully taken into account.
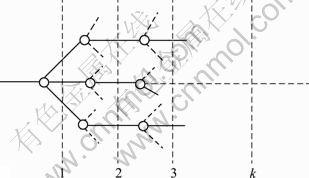
Fig. 1 Plot of group structure
On the other hand, the relative bond length of two adjacent vertices is used to distinguish saturated and unsaturated bond. Here, Lij is the shortest distance between vertices i and j, and is calculated by summing the bond length between two adjacent vertices in the shortest path. If we employ C―C bond length LC-C= 0.154 nm as 1, then the relative bond length between vertices i and j is calculated as dij=ΣLij/LC-C; for example, C=C relative bond length is 0.134/0.154= 0.870 1 [17].
The results of the equilibrium electro-negativity of atom and the relative bond length between two adjacent vertices are used to represent the properties and interaction of vertices in a molecule. The distance matrix D of n atoms in a molecule, a symmetric matrix, could be expressed as D=[dij]n×n, where dij is the relative bond length of the shortest path between the vertices i and vertices j. In addition, addition matrix S, vertex matrix R and electro-negativity matrix X are defined in order to distinguish the level of branching of the molecule from the atomic species. According to these definitions, matrixes D, S, R and X are expressed as
 ,
,  ,
,  ,
,
 ,
, 
By taking them into account, two new topological indices YC and WC are respectively defined as
 (3)
(3)
 (4)
(4)
The equilibrium electro-negativity of atom and relative bond length of vertices are employed to define novel atom-type topological indices YC and WC, which can code the structural environment of each atomic type in a molecule.
Path number is initially put forward by WIENER which could effectively elucidate chemical information of degree of branching and shape of a molecule [18]. Correspondingly, here P3 is used to denote the sum of three-bond paths between all pairs of non-hydrogen atoms in a molecule, and it encodes the shape of a molecule.
As an illustration, Fig. 2 depicts the molecular carbon skeleton graph of 2-methyl-2-butylene.

Fig. 2 Carbon skeleton graph of 2-methyl-2-butylene
The distance matrix D, addition matrix S, vertices matrix R and equilibrium electro-negativity matrix X are expressed as
 ,
,
 ,
,  ,
, 
Consequently, topological indices YC and WC for 2-methyl-2-butylene according to the above definition are calculated as
YC=lg (7.740 2×1×2.308 9+4.740 2×3×2.367 7+
5.610 3×2×2.353 1+8.610 3×1×2.305 0+
7.740 2×1× 2.308 9) = 2.063 2
WC =(7.740 2+4.740 2+5.610 3+8.610 3+7.740 2)/
(5×4)=1.722 1
P3 = 2
2.2 Data set
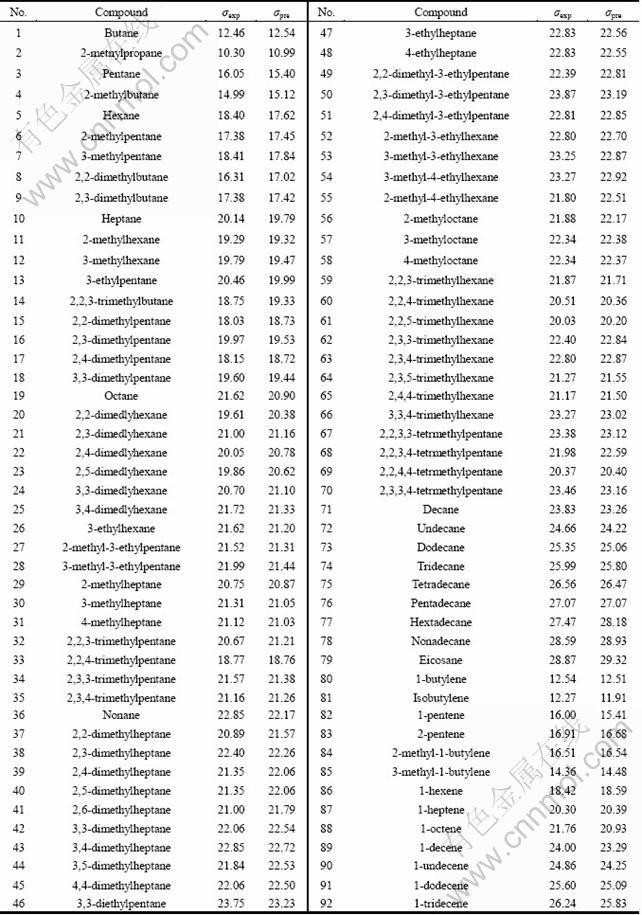
In this work, experimental data of solution surface tension of 92 organic compounds at 20 °C are extracted from Ref. [19]. The data set contains non-polar liquids and polar liquids, and saturated and unsaturated compounds. Table 1 gives the compounds and topological descriptors.
3 Results and discussion
3.1 Regression analysis
In the current QSPR study, we initially calculated novel atom-type topological structural descriptors as mathematical representation of chemical structure. A statistical technique was required to forge the link between the physicochemical properties and molecular structure descriptors. Multiple linear regression analysis using the novel YC, WC and P3 topological indices was performed for obtaining the model of solution surface tension of 92 organic compounds at 20 °C. The final model is obtained:
Pi = a・YC + b・WC + c・P3 +d (5)
where a, b, c refer to coefficients of regression equation, and d is a constant. Each coefficient of the regression equation can effectively reflect the relative contributions to solution surface tension of organic compounds. By viewing topological indices YC, WC and P3 to be compound independent, and 92 surface tensions of organic to be independent variables, the result indicating the surface tension can be described as
σ = 9.515 3YC-1.500 7WC +0.210 2P3-2.389 6 (6)
where n=92, R=0.991 4, Radj=0.991 1, S=0.455 4, PRESS=18.247 9, SSD=1 064.364 3, F=1 681.62, RCV =0.991 3, p<0.0000, SDEP=0.020 9. n is the number of data points; R is the correlation coefficient; Radj, S, PRESS, SSD, F, RCV, p and SDEP are adjusted correlation coefficient, standard error of estimate, predicted residual sum of squares, total sum of squares, value of the Fisher statistic, cross-validated correlation coefficient, associated p value and standard deviation error of prediction, respectively. Particularly, if the correlation coefficient, the Fisher criterion and the cross-validated correlation coefficient are high, the descriptors are better to explain the solution surface tension of organic compounds. In this way, the three-parameter correlation model is obtained from the training set of 92 compounds, which has the correlation coefficient R=0.991 4, the Fisher criterion F=1 681.62 and the cross-validated coefficient RCV=0.991 3. The high correlation coefficient and cross-validated correlation coefficient demonstrate that the new proposed QSPR model is more robust and has increased predictive power. Table 2 gives the predicted (σpre) and experimental (σexp) values of the surface tension of the organic compounds, and Figure 3 illustrates the linear relationships between them.
Table 1 Values of topological index YC, WC and number of path P3 for 92 organic compounds [19]

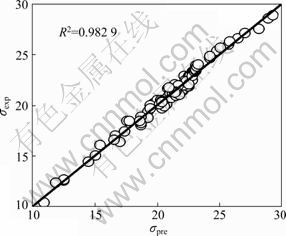
Fig. 3 Predicted values versus observed values of surface tension for Eq.(6) (n=92)
The analysis of plots has shown to be very useful to confirm the quality of a model or to detect the anomalies. The plot of observed values versus the predicted values of surface tension is presented in Fig. 3, which shows that experimental versus predicted surface tension obtained with Eq. (6) follows a straight line. From Fig. 3 and the correlation coefficient R of Eq. (6), one can say that the correlation of Eq. (6) is excellent. In order to investigate the error distribution, the plot of the predicted values versus residuals of the surface tension is present in Fig. 4. The propagation of residuals in both sides of the zero line indicates that there is no outlier in the calculated surface tension in the development of model. It is revealed that the deviations are randomly distributed and do not follow any kind of pattern. As can be seen from Fig. 4, the residuals exceed seldom the standard deviation of ±2S. Therefore, no systematic characteristics exist in the errors, which is in agreement with the general multiple linear theory [20]. The absence of data clustering suggests that our quantitative structure property relationship model is satisfactory.
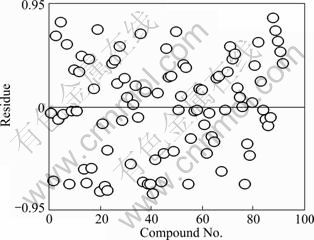
Fig. 4 Dispersion plot of residues for Eq. (6) (n=92)
Now, our model is compared with others previously reported by other groups. YANG and ZHONG [2] proposed a surface tension model including 209 compounds and eleven molecular structure descriptors, and the model gave the average absolute relative deviation of 4.21%. EGEMEN et al [8] proposed a group contribution method to predict the surface tension of liquid organic solvents. For this model, the experimental surface tension values and the predicted values by this method agreed only with R2=0.75 and R2=0.89, for the training set and the external test set, respectively. ESCOBEDO and MANSOORI [21] developed a predicted surface tension method with an error of higher than 3.0% compared with experimental data. Though our model could not absolutely be compared with foregoing emphasize models due to the difference of methodology and datasets, our three-descriptor model gives only the average absolute deviation of 1.81% for 92 substances. The correlation coefficient (R) and the leave-one-out cross-validation correlation coefficient (RCV) of multiple linear regression model are 0.991 4 and 0.991 3, respectively. Furthermore, our model does not require critical temperature of liquid or vapor density, which is more convenient to apply.
Table 2 Predicted values and experimental values of surface tension for 92 organic compounds
3.2 Regression model cross-validation
All predictive models require validation to decide whether they can be used to make predictions. If a QSPR model cannot be used to make a prediction, then it is of no practical use. On the other hand, it is worth mentioning that the models having the best correlation potential need not have the best predictive value [22]. As a result, validation of the model is the other major bottleneck in QSPR. Generally, cross validation (CV) method, one of the most popular validation criteria, is of practice and reliability for evaluating the validity of a model by how well it predicts data rather than how well it fits data. The analysis uses a “leave-one-out” (LOO) scheme, a model built with n-1 compounds and the n-th compound is predicted. Each compound is left out of the model derivation and predicted in turn. Then, the prediction residual error sum of square (PRESS, SE) and the sum of the squared deviation from the mean (SSD, SD) are calculated for each regression equation. The correlation coefficient for cross-validation (RCV) is then calculated by the following equation [23]:
 (7)
(7)
 (8)
(8)
 (9)
(9)
where n is the number of compounds included in the model, yi,obs and yi,pred are the experimental and predicted surface tensions of the left-out compound i, respectively, and yi,avg is the average experimental surface tension of left-in compounds different from i. The RCV value can be considered as a measure of the predictive power of a model. Though RCV can always be increased artificially by adding more parameters, RCV decreases if a model is over-parameterized, and then it is a more meaningful summary statistic for predictive model.
Cross-validated parameters for proposed model are obtained: RCV =0.991 3, SE=18.247 9, SD=1 064.364 3, SE/SD=0.017 1. Usually, the ratio SE/SD can be used to calculate the approximated confidence interval of prediction [23]. The PRESS lower than SSD indicates that model predicts better than chance and can be considered statistically significant. Similarly, to be a reasonable QSPR model, this ratio should be smaller than 0.4, and the value of this ratio smaller than 0.1 indicates that the model has an excellent predictive potential [24]. In conclusion, QSPR model is adopted as validation criterion with the one stating that all the conditions are simultaneously satisfied.
4 Conclusions
1) Two novel topological descriptors YC and WC efficiently encode the information of chemical environment from the aspect of the equilibrium electro-negativity and the relative bond length by revising the traditional distance matrix.
2) Based on the novel topological indices, quantitative structure-property relationship model is built to study the surface tension of organic compounds by the MLR method. Excellent structure-property model shows the efficiency of these indices in QSPR studies. In addition, the final model is validated to be statistically reliable and predictive using the general leave-one-out method. The overall average absolute relative error between the predicted surface tensions of organic compounds and their measured values is less than 1.81%. The results show that most of the predicted values of surface tension of organic compounds agree with the experimental values, within the range of experimental error.
3) This new QSPR model using YC and WC topological indices can be successfully used to correlate the surface tension with the molecular of hydrocarbon, and can also enable initial estimation of surface tension for new hydrocarbon compounds or for other hydrocarbons for which experimental values are unknown.
References
[1] BORTOLOTTI M, BRUGNARA M, DELLA VOLPE C, MANIGLIO D, SIBONI S. Molecular connectivity methods for the characterization of surface energetics of liquids and polymers [J]. J Colloid Interface Sci, 2006, 296(1): 292-308.
[2] YANG Chun-sheng, ZHONG Chong-li. A new model for prediction of surface tension of pure fluids [J]. Chinese J Chem Eng, 2004, 12: 85-91.
[3] ENDERS S, KAHL H, WINKELMANN J. Surface tension of the ternary system water plus acetone plus toluene [J]. J Chem Eng Data, 2007, 52(3): 1072-1079.
[4] WANG Jie, DU Hong-ying, LIU Huan-xiang, YAO Xiao-jun, HU Zhi-de, FAN Bo-tao. Prediction of surface tension for common compounds based on novel methods using heuristic method and support vector machine [J]. Talanta, 2007, 73: 147-156.
[5] REN Yue-ying, LIU Huan-xiang, YAO Xiao-jun, LIU Man-cang, HU Zhi-de, FAN Bo-tao. The accurate QSPR models for the prediction of nonionic surfactant cloud point [J]. J Colloid Interface Sci, 2006, 302: 669-672.
[6] DAI Yi-min, HUANG Ke-long, LI Xun, CAO Zhong, ZHU Zhi-ping, YANG Dao-wu. Simulation of 13C NMR chemical shifts of carbinol carbon atoms by using quantitative structure-spectrum relationships [J]. Journal of Central South University of Technology, 2011, 18(2): 323-340.
[7] REID C R, SHERWOOD T K. The properties of gases and liquids [M]. New York: McGraw-Hill, 1966: 398-400.
[8] EGEMEN E, NIRMALAKHANDAN N, TREVIZO C. Prediction of surface tension of organic liquids using artificial neural networks [J]. Environ Sci Technol, 2000, 34: 2596-2600.
[9] STANTON D T, JURS P C. Computer-assisted study of the relationship between molecular structure and surface tension of organic compounds [J]. J Chem Inf Comput Sci, 1992, 32: 109-115.
[10] KAUFFMAN G W, JURS P C. Prediction of surface tension, viscosity, and thermal conductivity for common organic solvents using quantitative structure-property relationships [J]. J Chem Inf Comput Sci, 2001, 41: 408-418.
[11] GAO Shuo, CAO Chen-zhong. Extending bond orbital-connection matrix method to the QSPR study of alkylbenzenes: Some thermochemical properties [J]. J Mol Struct: Theochem, 2006, 778: 5-13.
[12] WIENER H. Structural determination of paraffin boiling points [J]. J Am Chem Soc, 1947, 69: 17-20.
[13] MOHAJERI A, HEMMATEENEJAD B, MEHDIPOUR A, MIRI R. Modeling calcium channel antagonistic activity of dihydropyridine derivatives using QTMS indices analyzed by GA-PLS and PC-GA-PLS [J]. J Mol Graph Model, 2008, 26: 1057-1065.
[14] DAI Yi-min, WEN Song-nian, NIE Chang-ming, LI Zhong-hai. A novel quantum topological index and predicting physical-chemical properties of the lanthanide [J]. Chin J Inorg Chem, 2005, 21(8): 1015-1019.
[15] DAI Yi-min, LI Xun, CAO Zhong, YANG Dao-wu, HUANG Ke-long. Modeling flash point scale of hydrocarbon by novel topological electro-negativity indices [J]. CIESC Journal, 2009, 60(10): 2420-2425.
[16] DAI Yi-min, LI Xun, LIANG Bo, CAO Zhong, YANG Dao-wu, HUANG Ke-long. Quantitative relationship between 13C nuclear magnetic resonance chemical shift and structural parameters of acyclic alcohol [J]. Chin J Anal Chem, 2009, 37(12): 1754-1758.
[17] WEAST R. CRC handbook of chemistry and physics [M]. 70th ed, Boca Raton, FL: CRC Press, 1989-1990.
[18] ZHOU Cong-yi, CHU Xi, NIE Chang-ming. Predicting thermodynamic properties with a novel semi- empirical topological descriptor and path numbers [J]. J Phys Chem B, 2007, 111: 10174-10179.
[19] JAPER J J. The surface tension of pure liquid compounds [J]. J Phys Chem Ref Data, 1972, 1: 841-1010.
[20] KATRITZKY A R, SLAVOV S H, DOBCHEV D A, KARELSON M. Rapid QSPR model development technique for prediction of vapor pressure of organic compounds [J]. Comput Chem Eng, 2007, 31: 1123-1130.
[21] ESCOBEDO J, MANSOORI G A. Surface tension prediction for pure fluids [J]. AIChE J, 1996, 42: 1425-1433.
[22] GOLBRAIKH A, TROPSHA A. Beware of q2 [J]. J Mol Graph Model, 2002, 20: 269-276.
[23] AGRAWAL V K, BANO S, KHADIKAR P V. QSAR study on 5-Lipoxygenase inhibitors using distance-based topological indices [J]. Bioorg Med Chem, 2003, 11: 5519-5527.
[24] CHATERJEE S, HADI A S, PRICE B. Regression analysis by examples [M]. 3rd ed, Wiley: New York, 2000: 21-50.
(Edited by YANG Bing)
Foundation item: Projects(20775010, 21075011) supported by the National Natural Science Foundation of China; Project(2008AA05Z405) supported by the National High Technology Research and Development Program of China; Project(09JJ3016) supported by Hunan Provincial Natural Science Foundation, China; Project(09C066) supported by Scientific Research Fund of Hunan Provincial Education Department, China; Project(2010CL01) supported by the Foundation of Hunan Provincial Key Laboratory of Materials Protection for Electric Power and Transportation, China
Received date: 2010-11-22; Accepted date: 2011-04-28
Corresponding author: LIU You-nian, Professor, PhD; Tel: +86-731-88879616; E-mail: liuyoun@csu.edu.cn

