��������DMNRģ�͵�1060������������
��Դ�ڿ����й���ɫ����ѧ��(Ӣ�İ�)2016���4��
�������ߣ����� ��� �ܿ� ���¿� ���
����ҳ�룺1079 - 1095
�ؼ��ʣ�1060����������DMNR(���ض�Ԫ������)�������̣�������Ϊ���༶�������༶�������༶����������
Key words��1060 pure aluminum; modified DMNR (double multiple nonlinear regression) constitutive equation; flow behaviour; multilevel series rules, multilevel parallel rules; multilevel series & parallel rules
ժ Ҫ��Ϊ���о���ҵ�����Ŀɼӹ��ԣ����������ŵ��ȼӹ����ղ�����ͨ��Gleeble-1500��ģ��ѹ�������о����¶�Ϊ523~823 K��Ӧ������Ϊ0.005~10 s-1 ��Χ�ڴ������ȱ�����Ϊ��ͬʱ�о�Ӧ�䡢Ӧ�����ʺ��¶ȵȼӹ������Դ�������Ӧ����Ӱ�졣�Ż����ɲ��ϲ������ɵľŸ��������غ�����Ӧ��Ȩ��ϵ���������˶༶�������༶�����Ͷ༶����������ı������̣��������ϵ��R�ֱ���0.992��0.988��0.990��ƽ������������ֱ���6.77%��8.70%��7.63%����֤���������������ܺܺõ�Ԥ�ⴿ��������Ӧ����
Abstract: In order to study the work-ability and establish the optimum hot formation processing parameters for industrial 1060 pure aluminum, the compressive deformation behavior of pure aluminum was investigated at temperatures of 523-823 K and strain rates of 0.005-10 s-1 on a Gleeble-1500 thermo-simulation machine. The influence rule of processing parameters (strain, strain rate and temperature) on flow stress of pure aluminum was investigated. Nine analysis factors consisting of material parameters and according weights were optimized. Then, the constitutive equations of multilevel series rules, multilevel parallel rules and multilevel series & parallel rules were established. The correlation coefficients (R) are 0.992, 0.988 and 0.990, respectively, and the average absolute relative errors (AAREs) are 6.77%, 8.70% and 7.63%, respectively, which proves that the constitutive equations of multilevel series rules can predict the flow stress of pure aluminum with good correlation and precision.
Trans. Nonferrous Met. Soc. China 26(2016) 1079-1095
Pan LI, Fu-guo LI, Jun CAO, Xin-kai MA, Jing-hui LI
State Key Laboratory of Solidification Processing, School of Materials Science and Engineering, Northwestern Polytechnical University, Xi��an 710072, China
Received 26 March 2015; accepted 28 December 2015
Abstract: In order to study the work-ability and establish the optimum hot formation processing parameters for industrial 1060 pure aluminum, the compressive deformation behavior of pure aluminum was investigated at temperatures of 523-823 K and strain rates of 0.005-10 s-1 on a Gleeble-1500 thermo-simulation machine. The influence rule of processing parameters (strain, strain rate and temperature) on flow stress of pure aluminum was investigated. Nine analysis factors consisting of material parameters and according weights were optimized. Then, the constitutive equations of multilevel series rules, multilevel parallel rules and multilevel series & parallel rules were established. The correlation coefficients (R) are 0.992, 0.988 and 0.990, respectively, and the average absolute relative errors (AAREs) are 6.77%, 8.70% and 7.63%, respectively, which proves that the constitutive equations of multilevel series rules can predict the flow stress of pure aluminum with good correlation and precision.
Key words: 1060 pure aluminum; modified DMNR (double multiple nonlinear regression) constitutive equation; flow behaviour; multilevel series rules, multilevel parallel rules; multilevel series & parallel rules
1 Introduction
Industrial pure aluminum inherits general characteristics of aluminum, for example, small density, good thermal conductivity property, high causticity resistance and excellent plastic processing performance. Therefore, industrial pure aluminum is widely used in wire, cable and electronic parts, as well as household appliances, cooking utensils and so on [1,2]. In addition, an important application of pure aluminum is intricate shape forming because of its low strength and high ductility. It is well known that the deformation behavior of industrial pure aluminum is sensitive to the processing parameters such as temperature, strain and strain rate [3,4]. It is essential to make a relatively comprehensive research of the hot deformation behavior of industrial pure aluminum.
Constitutive equation, which plays a vital role in the numerical simulation of material processing, is used to describe the flow stress varying with strain, temperature and strain rate [5]. Nowadays, two methods of phenomenological and physically-based constitutive models [6] have been proposed to predict constitutive behavior in a wide range of metals and alloys. For most of these physical models [7,8], the flow rule is based on the Orowan equation, and the hardening rule is associated with the theory of thermodynamics and thermally activated dislocation movement [5]. The phenomenological constitutive models, which consist of some mathematical functions, provide a definition of flow stress based on empirical observation, but they are usually used in limited application fields and exhibit less flexibility. Among them, JC constitutive model enjoyed much success because of its simplicity and availability of parameters for various materials [9]. Besides, the Zerilli- Armstrong (Z-A) model [10] has been applied to different body-centered cubic (BCC) materials and face-centered cubic (FCC) materials at certain temperatures between room temperature and 0.6Tm (Tm is the melting point). While Z-A model is superior to the JC model when the coupled effect of temperature and strain rate is considered, therefore, it has been widely used by commercially available FE software. Compared with other phenomenological models, Arrhenius constitutive model is widely applied to describing the relation among strain, strain rate, temperature and flow stress. REZAEI ASHTIANI et al [11] have established constitutive equations for elevated temperature flow behavior of purity aluminum (considering the compensation of strain). Nowadays, a constitutive equation named double multiple nonlinear regression (DMNR) with high precision was proposed [12]. However, six analysis factors are not enough, and not all of them exert a great influence on the flow stress. As a consequence, it is significant to focus on the research of DMNR constitutive equation.
The purpose of this study is to establish the constitutive equation formed only by the major analysis factors. To achieve that, we did a series of thermal simulation compression tests on a Gleeble-1500 thermo- mechanical simulator at different deformation temperatures (523-823 K), strain rates (0.005-10 s-1) and true strain (0.9). Finally, constitutive equations about multilevel parallel rules and multilevel series & parallel rules were established according to the modified DMNR constitutive equation (multilevel series rules).
2 Experimental
2.1 Material and procedures
The nominal chemical composition of 1060 pure aluminum used in this experiment is shown in Table 1. The compression specimens were processed into cylinder with diameter of 8 mm and height of 12 mm. Heat treatment prior to isothermal compressing was applied by annealing at 573 K for 2 h in order to remove residual stress and followed by furnace-cooling. The microstructure of the original sample is shown in Fig. 1. Besides, in order to minimize the friction between the specimen and fixture during the compression tests, two flat ends of the test specimen in the process were painted with a layer of nickel-based lubricant, and sticked on a piece of graphite foil with 0.0254 mm in thickness.
Table 1 Chemical composition of 1060 pure aluminum (mass fraction, %)

The samples were protected by argon gas in the process of whole test, and the experiment adopted self-resistance heating in large current with heating rate of 10 K/s. The deformation temperature was measured by thermocouples which were welded to the center region of the specimen surface. As shown in Fig. 2, prior to hot compression, the specimens were heated to the deformation temperature and soaked for 3 min to ensure a homogenous temperature distribution. In addition, considering that the melting point of 1060 pure aluminum is 933 K, the isothermal hot compression experiments were carried out at deformation temperatures of 523, 573, 623, 673, 773 and 823 K and strain rates of 0.005, 0.01, 0.1, 1, 5 and 10 s-1, respectively. The isothermal compression reaches the true strain of 0.9. Then, the Gleeble-1500 thermal simulator automatically controlled the deformation conditions (temperature, displacement, displacement velocity) and collected the data of true stress and true strain throughout the experiment. After the test of each sample, the argon gas was removed rapidly and the sample was water-quenched to room temperature in order to keep the deformed microstructure. The load- stroke curves obtained from the compression tests were finally converted into true stress-true strain curves. Finally, the specimens were mechanically polished and then electro-polished at 30 V and -25 ��C using a 5% perchloric acid solution. The evolution of the grain morphology at selected positions along the numerically determined material flow line was analyzed using EBSD [13].

Fig. 1 Microstructure of original sample

Fig. 2 Experimental procedure for hot compression tests
2.2 Results and analysis
Although the lubricant was used to reduce friction, the friction between specimen and indentor will affect the deformation of the specimen, and then it will become more and more obvious as the area of contact between the sample and the pressure head increases. As a result of uneven deformation, the measured stress needs correcting to reduce friction error. Figure 3 shows a simple representation of solid compression test before and after compression.
ROEBUCK et al [14] proposed a friction correction criterion as follows:
 (1)
(1)
where B is a barreling coefficient, h is the height of the sample after deformation, and Rm is the maximum radius of samples after deformation, h0 and R0 are the height and radius of the sample before deformation, respectively, and RT is the top radius of samples after deformation in Fig. 3. When 11.1, the measured stress curve needs to correct it.

Fig. 3 Simple representation of solid compression test
Table 2 shows the calculated values of B under different deformation conditions, and according to the above criterion, none of the deformation samples need to correct the friction.
Table 2 Calculated B at various deformation temperatures and strain rates

At homologous temperatures above 0.4Tm, plastic deformation is strongly influenced by thermally activated process, thus, the flow stress heavily depends on the temperature and strain rate [15]. Figure 4 describes the flow stress-strain curves of pure aluminum obtained from the isothermal hot compression tests at different temperatures and strain rates. In the initial stage, the flow stress increases almost linearly with strain up to the maximum, and reaches a peak value. Subsequently, some flow stress increases continuously to a higher state, whereas others decrease slowly to a steady state which shows a dynamic flow softening phenomenon [16].
Actually, the shape of the flow stress-strain curve is the external appearance of micro structural evolution. The initial rapid increase of stress is associated with the dislocation sliding, rapid proliferation and dislocation interaction. Then, the dynamic recovery (DRV) and dynamic recrystallization (DRX) weaken the effect of work hardening, as a result, a plateau is achieved. In the end, the flow stress entering the steady state region is attributed to the balance between work hardening and flow softening. Compared with static recrystallization (SRX), DRX is more frequently observed at elevated temperatures, but it is also observed in pure metals at relatively low temperature, such as temperature about 0.3Tm [17]. Thus, DRX could occur in pure aluminum deformation at room temperature. The evolution of volume fraction of DRX is described as follows: for a fixed strain rate, the strain required for the same amount of volume fraction of DRX increases with decreasing the deformation temperature; whereas, for a fixed temperature, the strain required for the same amount of volume fraction of DRX increases with increasing the strain rate [18]. Combined with the flow stress-stain curves, we found that lower strain rate and higher temperature are beneficial to the occurrence of DRX. That is due to the fact that low strain rate and high temperature provide longer time for energy accumulation and higher motility at boundaries for the nucleation, growth of dynamically recrystallized grains and dislocation annihilation [19].
Figure 5 shows the EBSD microstructure of pure aluminum under different deformation conditions. The angles of boundary below 15�� are delineated in black. The histograms show that most of the boundaries are low angle boundaries (<15��) in the materials [20]. Figure 5(a) presents the EBSD results of the sample compressed at 623 K and strain rate of 5 s-1. The grain elongates perpendicular to the direction of compression, and grain boundary shows the sawtooth shape, which is attributed to dynamic recovery during deformation. In this process, screw dislocation gliding and edge dislocation climbing occur and lead to dislocation cancellation, as well as grain multilateral process. Figure 5(b) presents the EBSD results of the sample compressed at 623 K and strain rate of 1 s-1, most of the grain boundaries become more irregular zigzag, and some new small grains form near deformation zone. Figure 5(c) presents the EBSD results of the sample compressed at 573 K and strain rate of 1 s-1. There are many equiaxial and approximately equiaxial crystal structures. The grain boundaries are less obvious, only those grain boundaries distributed near the original grain boundary are obvious. Figure 5(d) presents the EBSD results of the sample compressed at 573 K and strain rate of 0.005 s-1. Fine grains fill the original grain, thus, dynamic recrystallization takes place and fine grains are achieved.

Fig. 4 Flow stress-strain curves of pure aluminum at strain rates of 0.005 s-1(a), 0.01 s-1(b), 0.1 s-1(c), 1 s-1(d), 5 s-1(e) and 10 s-1(f)
It reveals that the flow stress decreases with increasing the temperature when the strain rate is constant, which is obvious in the flow stress-temperature curves shown in Fig. 6. While the trend of flow stress dropping with increasing the temperature in high temperature region is smaller than that in low temperature region [21], and the temperature reaching a certain flow stress shifts to higher value as the strain rate increases. The result indicates that hot deformation is controlled by the interaction between moving dislocations and point defects in the dislocation core area. Atomic average kinetic energy increases and critical shear stress decreases with increasing the temperature. Both of them are beneficial to crystal slip and can reduce the block of dislocation movement. In addition, it is easier for dynamic recovery and recrystallization to occur at a high temperature, which can lower the dislocation density. The work hardening process is constantly offset by the processes of recovery and recrystallization in the state of thermal plasticity. As shown in Fig. 6, when the strain rate ranges from 0.005 to 5 s-1, the maximum stress continues to increase with increasing the strain rate. While the maximum stress drops precipitously as the strain rate ranges from 5 to 10 s-1. In fact, it is the thermal softening that results in a part of the flow stress reduction when the strain rate is relatively high (10 s-1), which leads to the consequence that the developed constitutive models cannot accurately predict the flow behaviors [21].

Fig. 5 EBSD microstructure of pure aluminum at strain of 0.9
The influence of strain rate on flow stress includes two factors: deformation time and deformation heat effect. At the constant temperature, every material possesses its own special strain rate where the softening process can be performed fully. However, below the special strain rate, reducing the strain rate has no effect on the softening process. While above the special strain rate, yield stress will rise as there is no enough time to realize the softening process. What is more, the increasing speed of yield stress decreases with increasing the strain rate. When strain rate is very high, the heat generated in the deformation has no time to dissipate, and yield stress will decrease because the deformation temperature of metal rises. When the deformation temperature is a constant, the flow stress increases with increasing the strain rate, as shown in Fig. 7, which indicates that the experiments are conducted above the special strain rate of pure aluminum. At high strain rates, the work hardening ability is enhanced remarkably on account that the increment rate of dislocation rises rapidly. Moreover, the flow stress- curves are scattered, and the flow stress varies in a relatively wide range at low temperature.
Comparing Figs. 6 with 7, both the stress-temperature curves and  curves are approximately parallel to each other, since the strain has less impact on the flow stress. Besides, the stress-temperature curves vary more severely than the curves, owing to that the material mechanical property is strongly temperature-dependent and weakly strain rate-dependent [22]. Therefore, the order of primary and secondary test factors affecting flow stress are temperature, strain rate and strain.

Fig. 6 Flow stress-temperature curves of pure aluminum at strain rates of 0.005 s-1(a), 0.01 s-1(b), 0.1 s-1(c), 1 s-1(d), 5 s-1(e) and 10 s-1(f)
3 Constitutive equation of pure aluminum
The deformation behavior of pure aluminum represented by the constitutive equation consists of flow stress and influence parameters. As shown in Fig. 8, xi are test factors of ��,  , T; yi are material parameters, mainly describing the single effect (solid line) and the interactive effect (dotted line) of test factors on the shape of flow stress curves; Ki are the corresponding weights of material parameters yi, reflecting the single effect (solid line) and the interactive effect (dotted line) of test factors on the amplitude of flow stress curves; fj are the analysis factors, j=1, 2, ��, 9, reflecting the influence function of the single and the interactive effect of analysis factors on flow stress; �� represents the flow stress which is set as objective function, and it is a pan-function of test factors xi and weight-function of analysis factors fj, ��=P(xi)=W(fj); ��j are converged weights, representing the contributions of functions fj to the objective function ��. The influence rules of test factors (��, , T) on flow stress are complicated, while the simple influence rules on flow stress can be obtained based on the analysis factors. Consequently, we build the analysis factors according to test factors, which is convenient to establish the accurate constitutive equation.
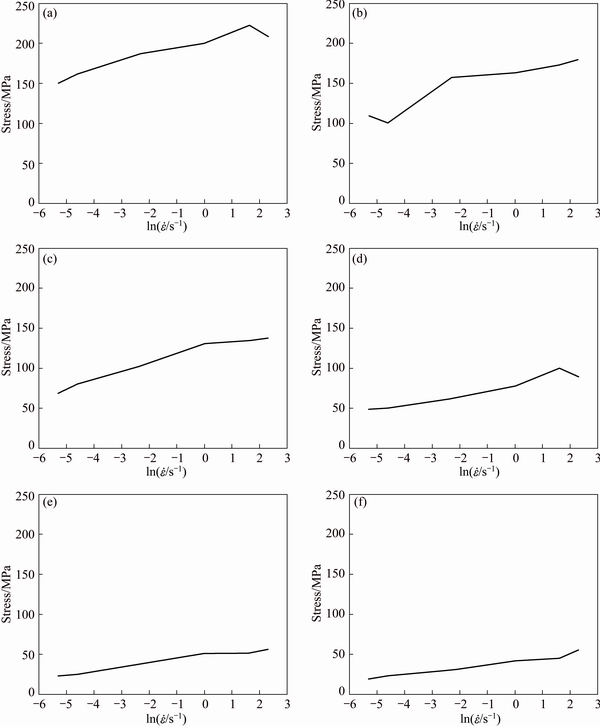
Fig. 7 Flow stress- curves of pure aluminum at temperatures of 523 K (a), 573 K (b), 623 K (c), 673 K (d), 773 K (e) and 823 K (f)
Analysis factors fj consist of material parameters yi and corresponding weights Ki, both of which are the functions of test factors xi. The objective function �� is obtained from the contribution function W(fj), where the acquisition of the analysis factors fj is based on the physical theory of plastic deformation. In fact, material parameters yi (n, m, s) and corresponding weights Ki (N, M, S) are derived from the following equations:
 (2)
(2)
 (3)
(3)
 (4)
(4)
where Q is the deformation activation energy (J/mol), R is the mole gas constant (8.314 J/(mol��K)). We define s��=mQ/R.

Fig. 8 Flow diagram about relation of test factors, analysis factors and flow stress
Furthermore, the primary analysis factors have to be selected. Then, the contribution function is acquired by the nonlinear regression based on the test data scatter plot, and weights ��j are acquired using the multivariate nonlinear regression based on the least square algorithm. Therefore, the construction method for the constitutive equation can be called as modified double multivariate nonlinear regression (DMNR). The so-called DMNR refers to the nonlinear regression of contribution function W(fj) and objective function ��. The specific process of establishing the constitution model is shown in Fig. 9.
3.1 Determination of material parameters
As described above, we get the data at strain of 2%, 4%, 6%, 8%, 10%, 20%, 30%, 40%, 50%, 60%, 70%, 80% and 90%, strain rates of 0.005, 0.01, 0.1, 1, 5 and 10 s-1, and temperatures of 523, 573, 623, 673, 773 and 823 K, respectively. Thus,  represents the stress at certain strain, strain rate and temperature.
Take experimental factors ��, and T for examples, and assume there are three levels for each test factor, as shown in Table 3, the mean stress values of  and ��(��,T) at different levels could be acquired as follows:
 (5)
(5)
 (6)
(6)
where is the mean value of stress at all temperatures, ��(��,T) is the mean value of stress at all strain rates, and  is the flow stress corresponding to the processing parameters.
The mean stress value of ��(��) at different levels could be acquired as follows:
 (7)
(7)
where ��(��) is the mean value of stress at all temperatures and strain rates.
The corresponding data list of  can be obtained in the same way, and then the mean stress values of
  ,
,  and
and  at different levels can be acquired. Eventually, by establishing the table of
  , the mean stress values of
  ,
,  and
and  at different levels can be acquired. Equations (1)-(3) can be transformed into another forms by taking logarithm of both sides.
 (8)
(8)
 (9)
(9)
 (10)
(10)
The values of n and N can be obtained from the slope and intercept of lines in ln��-ln�� plot according to Eq. (8), respectively. Similarly, m and M can be got from the slope and intercept of lines in plot according to Eq. (9), respectively. Then, s�� and S can be acquired from the slope and intercept of lines in ln��-1/T plot according to Eq. (10), respectively, and s can be obtained as defined as s=s��/T. According to Table 3, we get the mean stress value of ��(��), and the value of n varying with strain can be derived from the slope of the lines in ln��-ln��. Subsequently, the value of n varying with strain rate and temperature can be derived from the slopes of lines in
  and
and  , respectively. It is quite clear that m and s varying with strain, strain rate and temperature can also be obtained in the same way, as shown in Fig. 10. Meanwhile, N, M and S as the weights of strain hardening exponent, strain rate sensitive exponent and temperature sensitive exponent can be obtained from the intercept of Eqs. (8), (9) and (10), respectively, as shown in Fig. 11.

Fig. 9 Procedure of constitution model based on modified DMNR of major analysis factors
Table 3 Experimental program of three factors with three levels


Fig. 10 n, m and s changing with strain, strain rate and temperature
Table 4 Coefficients of polynomial about n, m, s and N, M, S

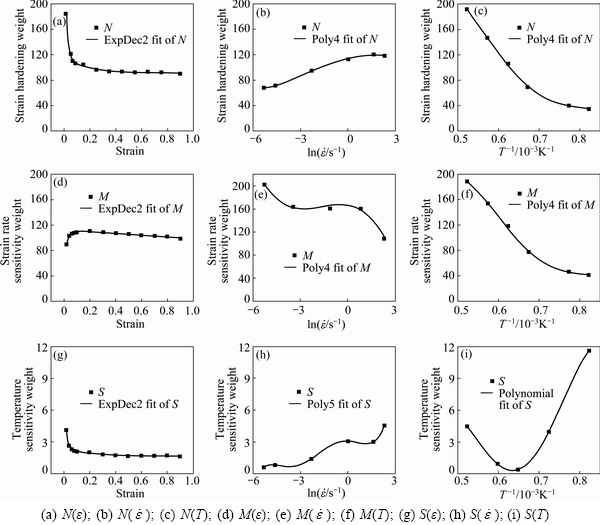
Fig. 11 N, M and S changing with strain, strain rate and temperature
Almost all the n, m, s and N, M, S varying with strain, strain rate and temperature can be expressed by polynomial, except N(��), M(��), S(��) and s(��). The coefficients of the polynomial are shown in Table 4. C0 is the constant term, C1, C2, C3, C4 and C5 are the coefficients of the first degree term, quadratic term, cubic term, biquadratic term and quintic term, respectively.
N(��), M(��), S(��) and s(��) can be fitted in equation of ExpDec2 (two-phase exponential decay function), as shown in the following equations:


3.2 Determination of major analysis factors
3.2.1 Determination of all analysis factors
Above all, n, m and s varying with strain, strain rate and temperature influence the shape of flow stress curves, meanwhile N, M and S changing with strain, strain rate and temperature affect the amplitude of flow stress curves. According to Eqs. (1)-(3), analysis factors fj consist of material parameters yi and corresponding weights Ki, both of which varying with strain, strain rate and temperature were obtained. The whole analysis factors can be expressed as follows:


3.2.2 Primary and secondary analysis factors
Analysis factors are composed of material parameters and corresponding weights. However, some have major impacts on the flow stress while others make relatively small contributions. Thus, it is essential to figure out the primary-secondary analysis factors. As we know, the mean value and standard deviation value are digital characteristics of statistics. The mean value represents overall level, and the standard deviation as arithmetic square root of variances reflects the discrete degree of a data set. Besides, another statistic CV (coefficient of variance), which can better reflect the discrete degree of data, was introduced to measure the data fluctuation. CV is the ratio of mean value to standard deviation value. The order of CV about analysis factors is shown in Table 5.
Table 5 Ordering of CV about analysis factors

As shown in Table 5, CV about analysis factors is selected in descending order. In order to evaluate the accuracy of the developed constitutive equation, standard statistical parameters, such as correlation coefficient R and average absolute relative error (AARE) A are adopted. They are expressed as follows:
 (11)
(11)
 (12)
(12)
where Ei is the experimental flow stress, Pi is the predicted flow stress,  and
and  are the mean values of experimental flow stress and predicted flow stress, respectively, N is the total number of selected flow stress data.
Figure 12 shows the correlation coefficient R and average absolute relative error (AARE) based on the modified DMNR constitution model with the analysis factors ranging from 9 to 1. Obviously, when the number of analysis factor is 6, the value of R is relatively high and AARE is relatively low. Therefore, when CV is greater than 10%, analysis factors play an important part in the flow stress. As a result, fT,  f��-T,
  ,
, ,
, are selected as the major analysis factors.
3.3 Determination of converged weights
3.3.1 Constitutive equation of multilevel series rules
Taking the example of current distributing regularity in series circuits, the entirety is going to be zero when an item is zero. Similarly, the former DMNR constitutive model is defined as a function multiplied by every analysis factor, while the modified DMNR (constitutive equation of multilevel series rules) can be determined by the major analysis factors fj mentioned above, as shown in Fig. 13(a).

Fig. 12 Correlation coefficient (a) and average absolute relative error (b) based on modified DMNR constitution model with analysis factors ranging from 9 to 1

Fig. 13 Relation of analysis factors and flow stress of different constitution models
On the basis of the orthogonal experiment and variance analysis, a comprehensive constitutive equation incorporating the effects of strain, strain rate and deformation temperature was established [8]:
 (13)
(13)
where ��0 is the initial yield stress of the material, f��, and fT are the influence functions of strain, strain rate and deformation temperature, respectively. To simplify the calculation, the interaction among the single factors was ignored. However, ignoring some primary interaction among the single factors affects the accuracy of constitutive equation. Based on the analysis of the relation among analysis factors fj (ranking from primary to secondary) and regression function ��, Eq. (13) can be modified as
 (14)
(14)
By considering the converged weights ��j, Eq. (14) can be modified as
 (15)
(15)
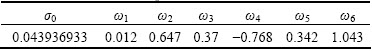
where ��j is the converged weights. By taking the logarithm on both sides of Eq. (15), one can obtain

 (16)
(16)
After the least-squares regression with independent variable and dependent variable ln��, ��0 and contribution weights ��j are obtained by multivariate linear regression, as shown in Table 6.
Table 6 Values of ��0 and ��j according to multilevel series rules
3.3.2 Constitutive equation of multilevel parallel rules
Researchers carried out enormous studies about constitutive equation constructed by adding each of the major analysis factors. Just like current distributing regularity in parallel circuits, the entirety is zero only when all the items are zero, as shown in Fig. 13(b). Taking the converged weights ��j into consideration, multilevel parallel rules can be described as follows:

 (17)
(17)
��0 and ��j are obtained by multivariate linear regression, as shown in Table 7.
Table 7 Values of ��0 and ��j according to multilevel parallel rules

3.3.3 Constitutive equation of multilevel series & parallel rules
Both of multilevel series rules and multilevel parallel rules were introduced in this study, and multilevel series & parallel rules were also employed, as shown in Fig. 13(c). Multilevel series & parallel rules are fitted step by step, which is quite different from the single multilevel series rules and multilevel parallel rules. By considering the converged weights ��j, multilevel series & parallel rules can be described as follows:
 (18)
(18)
 (19)
(19)
 (20)
(20)
In other words, analysis factors of strain-hardening and analysis factors of strain rate-strengthen are added together, both of which are in series with the analysis factors of deformation temperature. Then, ��0 and ��j are obtained by multivariate linear regression, as shown in Table 8.
Table 8 Values of correction coefficient ��0 and contribution weights ��j according to multilevel series & parallel rules

3.4 Verification of constitutive model
The predicted flow stress data were obtained by inputting strain, strain rate and temperature into Eqs. (16)-(20). According to multilevel series rules, multilevel parallel rules and multilevel series & parallel rules at constant strain rate, the comparisons between the experimental and predicted flow stress data are shown in Figs. 14-16.
As we know, correlation coefficient R is a statistical parameter representing correlation between the experimental and predicted flow stress data, ranging from 0 to 1. However, a higher value of R does not mean that the predicted flow stress shows a better agreement with the experimental flow stress, as the tendency of the model may be biased towards higher or lower values. Therefore, introducing average absolute relative error (AARE) is necessary, and the relative errors among each of them are also analyzed. Thus, AARE as an impartial statistic could accurately verify the constitutive equation.

Fig. 14 Comparison between experimental and predicted flow stress data according to multilevel series rules at strain rates of 0.005 s-1(a), 0.01 s-1(b), 0.1 s-1(c), 1 s-1(d), 5 s-1(e) and 10 s-1(f)

Fig. 15 Comparison between experimental and predicted flow stress data according to multilevel parallel rules at strain rates of 0.005 s-1(a), 0.01 s-1(b), 0.1 s-1(c), 1 s-1(d), 5 s-1(e) and 10 s-1(f)
As shown in Fig. 17, the correlation coefficients R of multilevel series rules, multilevel parallel rules and multilevel series & parallel rules are 0.992, 0.988 and 0.990, respectively, and the corresponding average absolute relative error (AARE) are 6.77%, 8.70% and 7.63%, respectively. It is clear that the prediction accuracy of multilevel parallel rules is slightly lower than other two constitutive equations and the predicted flow stress is significantly lower than the experimental flow stress in the low stress region, while the predicted flow stress of multilevel parallel rules is in a better agreement with the experimental flow stress at low temperature. On the contrary, the multilevel series rules constitutive model owns the highest prediction precision through a comprehensive analysis of the shape variation of predicted flow stress curves, as described in Fig. 14, but it is in less agreement with the experimental flow stress at low temperature. What is more, the prediction precision of multilevel series & parallel rules constitution model is in the intermediate level, and its predicted flow stress fits well with the experimental flow stress not only at low temperature but also at high temperature. That is because the multilevel series & parallel rules constitution model adopts series & parallel method which considers the influence of temperature on both strain hardening exponent n and strain rate sensitivity exponent m. Therefore, n and m varying with temperature have a significant impact on the shape of flow stress curves, as shown in Fig. 18. As described in Fig. 16, no matter what a high or low temperature, the flow stress curves of predicted and experimental agree well with each other. This indicates that multilevel series rules constitution model is more specifically suited to describe influence law in the single Z region of flow stress at higher temperature, as temperature contributes more to the rheological effect (strain rate strengthening) of material deformation��s intercrystalline mechanism. Oppositely, the multilevel parallel rules constitution model is more appropriate for describing influence law in the single Z region of flow stress at a lower temperature, since temperature has significant impact on the deformation effect (strain-hardening) of material deformation��s intracrystalline mechanism. In addition, further studies are expected in the future.

Fig. 16 Comparison between experimental and predicted flow stress data according to multilevel series & parallel rules at strain rates of 0.005 s-1(a), 0.01 s-1(b), 0.1 s-1(c), 1 s-1(d), 5 s-1(e) and 10 s-1(f)

Fig. 17 Correlation between experimental and predicted flow stress data

Fig. 18 Strain hardening exponent n and strain rate sensitivity exponent m changing with temperature
4 Conclusions
1) It is noticeable that the flow stress increases with increasing the strain rate and decreases with increasing the temperature. Moreover, according to the flow stress-temperature curves and flow stress-strain rate curves, the order of primary and secondary test factors affecting flow stress are temperature, strain rate and strain.
2) Based on the basic equations of material, the variation trends of strain hardening exponent (n), strain rate sensitivity exponent (m), temperature sensitivity exponent (s) and corresponding weights N, M, S with increasing the strain, strain rate and temperature were obtained. In addition, the analysis factors composed of the material parameters (n, m, s) and the corresponding weights (N, M, S) were optimized.
3) The constitutive equations based on multilevel series rules, multilevel parallel rules and multilevel series & parallel rules were proposed, regardless of secondary analysis factors. The predictability of the developed constitutive equations was quantified in terms of correlation coefficient (R) and average absolute relative error (AARE). The correlation coefficients R of multilevel series rules, multilevel parallel rules and multilevel series & parallel rules are 0.992, 0.988 and 0.990, respectively, and the AAREs are 6.77%, 8.70% and 7.63%, respectively, which indicate that the constitutive equation based on multilevel series rules has a fairly good ability to predict the flow stress.
4) Analyzed by variation trends of predicted flow stress curves, the multilevel series rules constitution equation has a low accuracy at low temperature. On the contrary, the multilevel parallel rules constitution equation has a high precision at low temperature. While the multilevel series & parallel rules constitution equation whose prediction precision is in the intermediate level, can accurately predict the flow stress over a wide temperature range.
References
[1] TOTTEN G E, MACKENZIE D S. Handbook of aluminum: Physical metallurgy and processes [M]. Vol. 1. Boca Raton: CRC Press, 2003.
[2] ROY R K, DAS S. New combination of polishing and etching technique for revealing grain structure of an annealed aluminum (AA1235) alloy [J]. Journal of Materials Science, 2006, 41(1): 289-292.
[3] PICUA R C, VINCZEB G, OZTURKA F, GRACIOB J J, BARLATB F, MANIATTYA A M. Strain rate sensitivity of the commercial aluminum alloy AA5182-O [J]. Materials Science and Engineering A, 2005, 390(1): 334-343.
[4] ABEDRABBO N, POURBOGHRAT F, CARSLEY J. Forming of aluminum alloys at elevated temperatures�CPart 1: Material characterization [J]. International Journal of Plasticity, 2006, 22(2): 314-341.
[5] LIN Y C, CHEN X M. A critical review of experimental results and constitutive descriptions for metals and alloys in hot working [J]. Materials and Design, 2011, 32(4): 1733-1759.
[6] SAMANTARAY D, MANDAL S, BHADURI A K, VENUGOPAL S, SIVAPRASAD P V. Analysis and mathematical modelling of elevated temperature flow behaviour of austenitic stainless steels [J]. Materials Science and Engineering A, 2011, 528(4): 1937-1943.
[7] ROTERS F, RAABE D, GOTTSTEIN G. Work hardening in heterogeneous alloys��A microstructural approach based on three internal state variables [J]. Acta Materialia, 2000, 48(17): 4181-4189.
[8] BARLAT F, GLAZOV M V, BREM J C, LEGE D J. A simple model for dislocation behavior, strain and strain rate hardening evolution in deforming aluminum alloys [J]. International Journal of Plasticity, 2002, 18(7): 919-939.
[9] LIANG R Q, KHAN A S. A critical review of experimental results and constitutive models for BCC and FCC metals over a wide range of strain rates and temperatures [J]. International Journal of Plasticity, 1999, 15(9): 963-980.
[10] HE An, XIE Gan-lin, ZHANG Hai-long, WANG Xi-tao. A modified Zerilli�CArmstrong constitutive model to predict hot deformation behavior of 20CrMo alloy steel [J]. Materials and Design, 2014, 56: 122-127.
[11] REZAEI ASHTIANI H R R, PARSA M H, BISADI H. Constitutive equations for elevated temperature flow behavior of commercial purity aluminum [J]. Materials Science and Engineering A, 2012, 545: 61-67.
[12] YUAN Zhan-wei, LI Fu-guo, QIAO Hui-juan, XIAO Mei-li, CAI Jun, LI Jiang. A modified constitutive equation for elevated temperature flow behavior of Ti-6Al-4V alloy based on double multiple nonlinear regression [J]. Materials Science and Engineering A, 2013, 578: 260-270.
[13] GUZEL A, JAGER A, PARVIZIAN F, LAMBERS H G, TEKKAY A E, SVENDSEN B, MAIERC H J. A new method for determining dynamic grain structure evolution during hot aluminum extrusion [J]. Journal of Materials Processing Technology, 2012, 212(1): 323-330.
[14] ROEBUCK B,LORD J D,BROOKS M,LOVEDAY M S,SELLARS C M,EVANS R W. Measurement of flow stress in hot axisymmetric compression tests [J]. Materials at High Temperatures, 2006, 23(2): 59-83.
[15] VERLINDEN B, DRIVER J, SAMAJDAR I, DOHERTY R D. Thermo-mechanical processing of metallic materials [M]. Amsterdam: Elsevier, 2007.
[16] XIAO Mei-li, LI Fu-guo, ZHAO Wei, YANG Gen-lin. Constitutive equation for elevated temperature flow behavior of TiNiNb alloy based on orthogonal analysis [J]. Materials and Design, 2012, 35: 184-193.
[17] KASSNER M E, BARRABES S R. New developments in geometric dynamic recrystallization [J]. Materials Science and Engineering A, 2005, 410: 152-155.
[18] QUAN Guo-zheng, MAO Yuan-ping, LI Gui-sheng, LV Wen-quan, WANG Yang, ZHOU Jie. A characterization for the dynamic recrystallization kinetics of as-extruded 7075 aluminum alloy based on true stress�Cstrain curves [J]. Computational Materials Science, 2012, 55: 65-72.
[19] WU Horng-yu, YANG Jie-chen, ZHU Feng-jun, WU Cheng-tao. Hot compressive flow stress modeling of homogenized AZ61 Mg alloy using strain-dependent constitutive equations [J]. Materials Science and Engineering A, 2013, 574: 17-24.
[20] LI Luo-xing, WANG Guan,LIU Jie,YAO Zai-qi. Flow softening behavior and microstructure evolution of Al-5Zn-2Mg aluminum alloy during dynamic recovery [J]. Transactions of Nonferrous Metals Society of China, 2014, 24(1): 42-48.
[21] LIN Y C, ZHANG J, ZHONG J. Application of neural networks to predict the elevated temperature flow behavior of a low alloy steel [J]. Computational Materials Science, 2008, 43(4): 752-758.
[22] NEMAT-NASSER S, GUO W G, NESTERENKO V F, INDRAKANTI S S, GU Y B. Dynamic response of conventional and hot isostatically pressed Ti-6Al-4V alloys: Experiments and modeling [J]. Mechanics of Materials, 2001, 33(8): 425-439.
�� �ʣ�������� �������¿������
������ҵ��ѧ ����ѧԺ ���̼��������ص�ʵ���ң����� 710072
ժ Ҫ��Ϊ���о���ҵ�����Ŀɼӹ��ԣ����������ŵ��ȼӹ����ղ�����ͨ��Gleeble-1500��ģ��ѹ�������о����¶�Ϊ523~823 K��Ӧ������Ϊ0.005~10 s-1��Χ�ڴ������ȱ�����Ϊ��ͬʱ�о�Ӧ�䡢Ӧ�����ʺ��¶ȵȼӹ������Դ�������Ӧ����Ӱ�졣�Ż����ɲ��ϲ������ɵľŸ��������غ�����Ӧ��Ȩ��ϵ���������˶༶�������༶�����Ͷ༶����������ı������̣��������ϵ��R�ֱ���0.992��0.988��0.990��ƽ������������ֱ���6.77%��8.70%��7.63%����֤���������������ܺܺõ�Ԥ�ⴿ��������Ӧ����
�ؼ��ʣ�1060����������DMNR(���ض�Ԫ������)�������̣�������Ϊ���༶�������༶�������༶����������
(Edited by Mu-lan QIN)
Foundation item: Project (51275414) supported by the National Natural Science Foundation of China; Project (2015JM5204) supported by the Natural Science Foundation of Shaanxi Province, China; Project (Z2015064) supported by the Graduate Starting Seed Fund of the Northwestern Polytechnical University, China; Project (130-QP-2015) supported by the Research Fund of the State Key Laboratory of Solidification Processing (NWPU), China
Corresponding author: Fu-guo LI; Tel: +86-29-88474117; Fax: +86-29-88492642; E-mail: fuguolx@nwpu.edu.cn, fuguolx@163.com
DOI: 10.1016/S1003-6326(16)64205-X

