J. Cent. South Univ. (2017) 24: 2114-2120
DOI: https://doi.org/10.1007/s11771-017-3620-8

Experimental investigation of particle-induced pressure loss in solid–liquid lifting pipe
SONG Yue-wen(宋跃文)1, ZHU Xiao-jun(朱小军)1, SUN Zhi-qiang(孙志强)1, TANG Da-sheng(唐达生)2
1. School of Energy Science and Engineering, Central South University, Changsha 410083, China;
2. State Key Laboratory of the Exploration and Utilization of Deep-sea Mineral Resources
(Changsha Research Institute of Mining and Metallurgy Co. Ltd.), Changsha 410083, China
 Central South University Press and Springer-Verlag GmbH Germany 2017
Abstract: In order to investigate the characteristics of particle-induced pressure loss in the solid–liquid lifting pipe, a series of experiments were conducted in 200 mm diameter lifting pipe. Simulation manganese nodules with five different mean diameters of 10 mm, 20 mm, 30 mm, 40 mm and 50 mm were used, both in isolation and a combination in equal fraction by mass. The flow velocities in the lifting pipe ranged from 0.12 m/s to 1.61 m/s, and the mass of particles employed was 10 kg for each particle diameter. Three regimes, wavy bed, partly fluidization, and fully fluidization, were observed over the flow velocity. The solid–liquid pressure drop data were measured by differential pressure transmitter, and pressure drop caused by the solid particles was calculated and analyzed. The results show that the evolutions of the pressure loss due to solid particles are relevant to the solid–liquid flow regimes, and they are distinctly influenced by fluid velocity and particle size.
Key words: lifting pipe; pressure loss; simulation manganese nodules; flow regimes
1 Introduction
Pressure loss is one of the most important parameters to be evaluated when designing a pipeline slurry transportation system. Appropriate determination of the resistance along the transport system ensures the safety of the pipeline system and economic benefit [1, 2]. Extensive studies have been conducted to uncover the effects of flow conditions on hydraulic drop in pipelines, and these studies were mainly focused on particle size, particle density, solid concentration and pipe diameter [3-6].
Though a lot of researches have been implemented, the pressure loss behaviors for different solid-liquid regimes in vertical pipe have not yet caused sufficient attention. Summaries of the flow regime studies and the various empirical laws extracted from them are a common feature in reviews of multiphase flow [7, 8]. For flows in vertical pipes, DIDWANIA and HOMSY [9] identified four discrete flow regimes by analyzing two-dimensional liquid fluidized beds of glass particles in water, which were wavy flow, wavy flow with transverse structure, fine-scale turbulent flow, and bubbling states. To further study the flow regimes of solid–liquid in vertical pipe, LIU et al [10] carried out a similar experiment using glass particles with larger diameter (1-4.5 mm), and reported four regimes for different particle sizes and lifting velocities, fixed bed, partly fluidization, fully fluidization, and hydraulic conveying. A substantial number of investigations have been conducted to find the pressure drop characteristics at different flow regimes, while the majority of the literature dealt with solid–gas or liquid–gas flows [11-13], only very limited investigations focused on solid–liquid flow in vertical pipe. An experimental apparatus was built to explore the impacts of flow conditions on the hydraulic gradient, and a formula to compute the total hydraulic gradient of the mixture flow under different flow and solid-loading conditions was developed by XIA et al [14]. A study was carried out by TOKANAI et al [15] to investigate the effect of viscosity on the hydraulic characteristics of solid–liquid mixtures flowing through a vertical pipe, in which the spherical glass beads were suspended in upward flows of aqueous solutions of glycerol or water, and the pressure drops were measured under various operating conditions. MATOUSEK [16] discussed a relation between the flow friction and the flow regime of sand–water mixture in both horizontal and vertical pipe. The results were confirmed that flows with a higher degree of flow stratification exhibit considerably higher friction than flows with a lower degree of stratification, and vertical flows exhibit slightly smaller friction than horizontal non-stratified flows.
To determine the solid-liquid pressure loss mechanism in the vertical pipe, extensive experiments were carried out in the present work. The material used in the experiments is simulation manganese nodules with properties similar to manganese nodules transported in deep sea pipelines. Three regimes, wavy bed, partly fluidization, and fully fluidization, were observed in the experiments. The solid–liquid pressure drop data were measured by differential pressure transmitter, and the pressure drop caused by the solid particle was calculated and analyzed. The results show that the evolution of the pressure drop due to solid particles is relevant to the solid-liquid flow regimes, and they are distinctly influenced by fluid velocity and particle size.
2 Experimental apparatus and procedure
2.1 Experimental apparatus
A schematic diagram of the hydraulic lifting setup, which was designed to mimic the deep-sea mining system, is shown in Fig. 1. The setup was 30 m in height and the diameter of the vertical pipe was 200 mm to ensure that the flow was fully developed. The setup mainly consisted of test section, water supply loop, data acquisition system, and high-speed camera system.
In order to observe flow regimes of the solid–liquid mixture, the test section of 4 m in height attached to the lifting pipe was transparent plexiglass tube, and the diameter of the tube was 200 mm. The flow rate was monitored with an electromagnetic flow meter (200mmE-magE). The pressure drop was measured by the differential pressure transmitter (3151SD) between two pressure measurement stations below and above the transparent tube, located 4 m apart. Artificial nodules with average diameters of 10, 20, 30, 40 and 50 mm were used (Fig. 2). The solid–liquid mixtures were lifted vertically upward through the test section by a pump. The data acquisition system consisted of hardware and software, and the experimental setup acquired all data from the flow meter and the differential pressure transmitter by Windows based graphical user interface (GUI) software. A 2F04 high-speed camera with frame resolution 2320×1720 and frame rate 190 f/s was arranged 4 m away from the plexiglass tube, and it was connected directly with the computer in the console cabinet.
2.2 Experimental procedure
Water was ejected into the lifting pipe before the experiments, then simulation manganese nodules were dumped onto a wire screen located at the bottom of the plexiglass tube. With the increase of fluid velocity, the particles slowly changed their states from still to movement. To record the flow regimes in the tube, high-speed camera was used all through the experiments, meanwhile pressure drop of the test section was obtained by the differential pressure transmitter. Physical properties of the simulation manganese nodules and experiment conditions are listed in Table 1.

Fig. 1 Schematic of experimental setup (1-Water pump; 2-Water tank; 3-Feed pipe; 4-Overflow pipe; 5-Constant- pressure pipe; 6-Return pipe; 7-Lifting pipe; 8-Constant- pressure tank; 9-Distribution box; 10-Calibration box; 11-Plexiglass tube; 12-High-speed camera; 13-Flow meter; 14-Frequency converter; 15-Computer; 16-Lift pump; 17-Stock bin; 18-Water drum; 19-Ground)

Fig. 2 Simulation manganese nodules
Table 1 Experimental material properties and conditions

3 Pressure drop mechanism in vertical pipe
Liquid–solid vertical flow often occurs in such applications as transporting or processing of materials. For fully developed flow in vertical pipe, the solid–liquid mixture can be treated as homogeneous slurry with a mean density. Thus, the total hydraulic gradient for a fully developed slurry flow in a vertical pipe is expressed as
 (1)
(1)
where P is the total pressure loss; ρm is the mixture density; g is the gravitational acceleration; D is the pipe diameter; τw is the total shear stress. The total shear stress τw is often treated as the sum of the fluid and particle shear stresses:
 (2)
(2)
Unlike fully developed slurry flow in a vertical pipe, slurry flow in non-fully developed regime is more complicated, where hydraulic gradients are dominated by the gravitational factor. Despite all that, a qualitative relational expression of the total hydraulic gradients can be presented as
 (3)
(3)
where △Pt is the total pressure loss of the test section; △Pw is the total pressure loss caused by friction and local resistance due to the flow of water; △Ph is the position waterhead over the vertical tube; △Ps is the pressure loss caused by the solid particles.
 (4)
(4)
where ρw is the density of water; hf is the head loss caused by friction; hl is the local head loss due to the screen adopted in the test section.
After a zero shift to the differential pressure transmitter, a new formula can be acquired as
 (5)
(5)
where △Pd, acquired from the differential pressure transmitter, is the pressure loss of the test section without regard to the position waterhead △Ph.
For confined flows of particle–water mixture, the particle–wall and particle–particle interaction in the form of particle bouncing, sliding, and rolling is one of the major reasons of pressure drop brought by particles. Meanwhile, the presence of solids will act as resistances in the fluid when there is slip velocity. Thus, pressure loss brought by the solids can be presented as
 (6)
(6)
where △Psp and hsp are the pressure loss and head loss due to the presence of solids; △Psp and hsc are the pressure loss and head loss due to collisions.
According to NEWITT et al [17] and XIA et al [14], hsp and hsc can be expressed as
 (7)
(7)
 (8)
(8)
where Cv is the local volume concentration; ρs is the density of solids; lm is height of the solid–liquid mixture; tu is unit of time; lu is unit of length; and γ is the amount of energy per unit time and unit volume lost from inter-particle collisions [14]:
 (9)
(9)
All nodules are divided into several groups (n) according to the nodule-size distribution, and the mean diameter dj and mass mj of each group nodules are calculated. At the same time, xi, the percentage weight corresponding to the size dj, should be obtained. It is obvious to find that γ is strongly dependent on the mean velocity of particle–water mixtures, Vm.
4 Experiment results and analysis
A series of experiments were conducted in 200 mm diameter vertical pipe on five sizes of simulation manganese nodules of which mean diameters are 10, 20, 30, 40 and 50 mm, respectively, and a mixture of the five sizes in equal fraction by mass. The flow velocity ranges from 0.12 m/s to 1.61 m/s and the weight of particles employed is 10 kg for each diameter.
4.1 Flow regimes of particle–water mixture
Since the movement of the solid particles was caused by the forces exerted by the fluid instead of being pushed by a pump, the only velocity that can be applied is the fluid velocity. Thus, the discussion will focus on the fluid velocity. Here, the critical velocity is the velocity when particles start floating. If the fluid velocity is lower than it, the particle will remain on the screen at the bottom of test section. If the fluid velocity is around the critical velocity, most particles will be floating. It should be noticed that the size and shape of the particles were not perfectly uniform even though it had been tried to select the particles with the diameter identical to each other for each group. Consequently, the floating velocity is a range of velocity rather than a sharp transition point.
The particle movements in the lifting pipe are strongly dependent on the fluid velocity, and different flow regimes are observed in the experiments. For small fluid velocity, the particles fluctuate at the bottom of the test section, and this regime is wavy bed. With the Increase of the fluid velocity, some of the particles are moved, and this status is referred to as partly fluidization, or mixed bed. With the further increase of the fluid velocity, all the particles are moved and kept in suspension state, and this status is called fully fluidization. Extensive flow visualizations of the various fluidization regimes were obtained using a 2F04 high-speed camera. Flow regimes mentioned above are shown in Fig. 3.

Fig. 3 Experimental images of flow regimes:
4.2 Analysis and calculation of particle-induced pressure loss
The pressure drop data of the test tube for different particle sizes were obtained directly from the differential pressure transmitter installed over the test section.Figure 4 presents the evolutions of the particle–water hydraulic drop over the velocity range for five sizes of simulation manganese nodules of which mean diameters are 10, 20, 30, 40 and 50 mm, respectively, and a mixture of the five sizes in equal fraction by mass. It should be mentioned that the differential pressure transmitter underwent a zero shift, so that the position waterhead is not included. It is observed that the curves of different particle size display a similar trend, in which △Pd increases with the increase of upward velocity and shows an obvious decline at the intermediate part of velocity for each test group, then it increases again with the growing upward velocity.
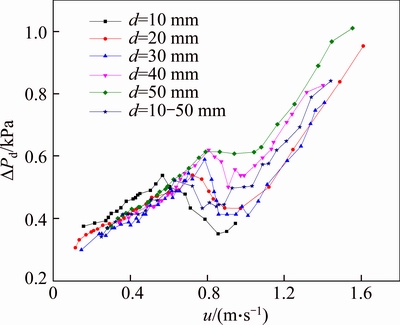
Fig. 4 Total pressure loss of test section
△Pd is the total pressure loss due to water and solid particles, as it is shown in formula (5). To acquire the pressure drop caused by particles in the experiments, pressure drop due to water, △Pw, should be subtracted. Thus, head loss due to friction and local head loss, hf, hl, shown in formula (4) are demanded to be calculated correspondingly. hf and hl are related to flow velocity u and flow conditions of the experiments. They are calculated respectively from Eqs. (10) and (11).
 (10)
(10)
 (11)
(11)
where λ is the friction coefficient; l is the length of test section; D is the tube diameter; u is the upward velocity.
The Reynolds number in the experiments ranges from 2.3×10⁴ to 3.2×10⁵, thus the boundary condition lies in hydraulically smooth regime and then λ [18] can be acquired from Eqs. (12) and (13):
 , Re=4000-105 (12)
 , Re=5×10⁴-3×10⁶ (13)
The resistance coefficient of the wire screen (Fig. 5) adopted in the experiments, is calculated by [19]
 (14)
(14)

Fig. 5 Schematic of wire screen:
where α is the porosity of the screen; △ is the fraction of dynamic head at the vena contract which is recovered as static pressure downstream.
 (15)
(15)
 (16)
(16)
where b is the diameter of the mental wire; l is the total length of the mental wires; D is the diameter of the screen.
△Pw can be calculated by Eqs. (4), (10)-(16), and it increases dramatically with the increase of upward flow velocity, as can be seen from Fig. 6.
4.3 Effect of flow velocity on particle-induced pressure loss
Subtracted by corresponding pressure loss caused by water in the test section (Fig. 6) from △Pd, pressure loss due to solids over the test section for each experiment can be acquired, as shown in Fig. 7.
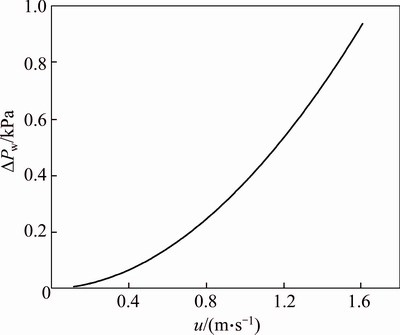
Fig. 6 Pressure drop due to flow of water
A similar trend is observed for the curves presented in Fig. 7. According to the evolution characteristics, the curves can be divided into three zones over the flow velocity. In zone I, △Ps extends slightly with the increase of the fluid velocity, then it goes through a steep decline as the velocity continues to increase in zone II, and it approaches to zero with larger velocity in zone III. It is worth noting that those zones are highly related to the flow regimes described in section 4.1. This phenomenon accords with previous studies [20, 21], while it will not be discussed particularly in this paper due to space limitations.

Fig. 7 Pressure drop due to solid particles
It is observed that △Ps maintains at a high level until the velocity reaches to the maximum of zone I, thus it accounts for a major proportion of △Pd as △Pw is quite small at low fluid velocity(Fig. 6). It can be deduced that zone I contains two flow regimes, wavy bed and partly fluidization, despite of slight variance of the zone’s limit for different diameter particles. At lower velocity in zone I, it is inferred that pressure loss due to the presence of solid △Psp, accounts the majority part of △Ps, where the deposited particles generate a huge resistance to the fluid. At higher velocity in zone I, the local concentration of the mixture decreases as the particles move apart (Fig. 3(b)), which induces a descendent of △Psp, according to Eq. (7). The growing velocity of the upward flow maintains the particles in fluctuation, bringing about more violent particle–particle and particle–wall collisions, and this is conjectured the reason why △Ps remains at a comparative high level as the regimes change from wavy bed to partly fluidization. Zone II is basically the particle-caused pressure drop behavior at fully fluidization regime (Fig. 3(c)). The local concentration of the particles group keeps diminishing as velocity increases, and the collisions recede as particle– particle distance becomes larger, both of which lead to a drop of △Ps in the test section. In zone III, the particle will be drifted out of the test section by the fluid as the velocity continues to increase, thus a relentless drop of △Ps can be observed.
4.4 Effect of particle size on particle-induced pressure loss
Similar △Ps curve trends as they are for different particle sizes, distinctive and consequential differences exist. As can be seen in Fig. 7, △Ps of 10 mm particles is larger than the rest in zone I. It may be reasonable to suppose that the smaller particles generate greater resistance as they deposited more compactly on the screen and cause more collisions. The turning points of zone I and zone II (A, B, C, D, E, F) are different from each other. It can be observed that for turning points of the 10 mm particles, A, is smaller than B, C, D, and E. This is assumed to be a consequence of comparatively smaller floating velocity which is heavily dependent on particle diameter. Meanwhile, larger △Ps values of 40 mm and 50 mm particles are found in zone III because more particles remain in the test section.
To have a further study on the effect of particle diameter on △Ps, the same test was employed to 10 kg mixture of the five sizes in equal fraction by mass, and the curve of it is the purple one with star symbols in Fig. 7. The mixture displays a compromised behavior (seen in Fig. 7) as △Ps is smaller in zone I while larger in zone II and zone III compared to the smaller particles (d=10 mm) and oppositely compared to the larger particles. It's worth noting that the turning point of the mixture curve, F, locates at a moderate position, indicating that the particle size composition has a considerable effect on solid–liquid pressure drop behavior and flow regimes.
5 Conclusions
1) Movements and flow regimes of large size particles in vertical lifting pipe are dependent on the fluid velocity. Three regimes, wavy bed, partly fluidization, and fully fluidization, are identified for solid–liquid flow in the investigated lifting pipe with the use of high speed camera.
2) Curves of the pressure drop caused by solid particles can be divided into three zones over the fluid velocity according to the evolution behaviors. In zone I, △Ps extends slightly with the increase of the fluid velocity, then it goes through a steep decline as the velocity continues to increase in zone II, and it approaches to zero with larger velocity in zone III.
3) Pressure loss due to small particles (d=10 mm) is larger than that caused by the other sized particles in wavy regime and partly fluidization regime and pressure loss due to small particles (d=10 mm) is smaller than that caused by the other sized particles in fully fluidization regime. Mixture of the five sizes of particles in equal fraction by mass displays a compromised behavior as △Ps is smaller in zone I while larger in zone II and zone III compared to the smaller particles (d=10 mm), but the opposite is true for the larger particles.
References
[1] AZIZ A I, MOHAMED H I. A study of the factors affecting transporting solid-liquid suspension through pipelines [J]. Open Journal of Fluid Dynamics, 2013, 3(3): 152-162.
[2] LAHIRI S K, GHANTA K C. Prediction of pressure drop of slurry flow in pipeline by hybrid support vector regression and genetic algorithm model [J]. Chinese Journal of Chemical Engineering, 2008, 16(6): 841-848.
[3] KAUSHAL D R, SATO K, TOYOTA T, FUNATSU K, TOMIT Y. Effect of particle size distribution on pressure drop and concentration profile in pipeline flow of highly concentrated slurry [J]. International Journal of Multiphase Flow, 2005, 31(7): 809-823.
[4] OZBELGE T A, CAMCIUNAL G. A new correlation for two-phase pressure drops in fully developed dilute slurry up-flows through an annulus [J]. Chemical Engineering Communications, 2009, 196(4): 491-498.
[5] KAUSHAL D R, TOMITA Y. Solids concentration profiles and pressure drop in pipeline flow of multisized particulate slurries [J]. International Journal of Multiphase Flow, 2002, 28(10): 1697-1717.
[6] XU Hai-liang, XIE Qiu-min, WU Bo, ZHAO Hai-ming, XU Shao-jun. Numerical simulation and analysis of gas hydrate mining pipe hydraulic lifting [J]. Journal of Central South University, 2015, 46(11): 4062-4069. (in Chinese)
[7] JANA A K, DAS G, DAS P K. Flow regime identification of two-phase liquid–liquid upflow through vertical pipe [J]. Chemical Engineering Science, 2006, 61(5): 1500-1515.
[8] CHENG Li-xin, RIBATSKI G, THOME J R. Two-phase flow regimes and flow-regime maps: Fundamentals and applications [J]. Applied Mechanics Reviews, 2008, 61(5): 1239-1249.
[9] DIDWANIA A K, HOMSY G M. Flow regimes and flow transitions in liquid fluidized beds [J]. International Journal of Mutiphase Flow, 1981, 7(6): 563-580
[10] LIU Zhong-liang, SHI Ming-heng, DAI Guo-sheng. Mechanism analysis of non-uniform distribution for solid-liquid flow in verticalpipe [J]. Journal of China University of Petroleum, 1997, 21(5):56-60. (in Chinese)
[11] SOTGIA G, TARTARINI P, STALIO E. Experimental analysis of flow regimes and pressure drop reduction in oil-water mixtures [J]. International Journal of Multiphase Flow, 2008, 34(12): 1161-1174.
[12] SUN Zhi-qiang, SHAO Shuai, GONG Hui. Gas-liquid flow regime recognition based on wavelet packet energy entropy of vortex-induced pressure fluctuation [J]. Measurement Science Review, 2013, 13(2): 83-88.
[13] PIETRZAK M. Flow regimes and volume fractions of phases during liquid–liquid two-phase flow in pipe bends [J]. Experimental Thermal and Fluid Science, 2014, 54(4): 247-258.
[14] XIA J X, NI J R. MENDOZA C. Hydraulic lifting of manganese nodules through a riser [J]. Offshore Mechanics and Arctic Engineering, 2004, 126(1): 72-77.
[15] TOKANAI H, HARADA E, HASEGAWA J, KURIYAMA M. Turbulent transition and pressure drop in solid-high viscosity liquid upward flow through vertical pipe [J]. Chemical Engineering, 2004, 30(4): 509-514.
[16] MATOUSEK V. Pressure drops and flow regimes in sand-mixture pipes [J]. Experimental Thermal and Fluid Science, 2002, 26(6, 7): 693-702.
[17] NEWITT D M, RICHARDSON J F, GLIADON, B J. Hydraulic conveying of solids in vertical pipes [J]. Transactions of the Institution of Chemical Engineers, 1961, 39: 93-100.
[18] DOBRNJAC M. Determination of friction coefficient in transition flow region for waterworks and pipelines calculation [J]. International Journal of Engineering, 2012, 10(3):137-142.
[19] PINKER R A, HERBERT M V. Pressure loss associated with compressible flow through square-mesh wire gauzes [J]. Journal of Mechanical Engineering and Sciences, 1967, 9(1): 11-23.
[20] KIM S M, KIM J, MUDAWAR I. Flow condensation in parallel micro-channels–Part 1: Experimental results and assessment of pressure drop correlations [J]. International Journal of Heat and Mass Transfer, 2012, 55(4): 971-983.
[21] KIM S M, MUDAWAR I. Flow condensation in parallel micro- channels – Part 2: Heat transfer results and correlation technique [J]. International Journal of Heat and Mass Transfer, 2012, 55(4): 984-994.
(Edited by DENG Lü-xiang)
Cite this article as: SONG Yue-wen, ZHU Xiao-jun, SUN Zhi-qiang, TANG Da-sheng. Experimental investigation of particle-induced pressure loss in solid–liquid lifting pipe [J]. Journal of Central South University, 2017, 24(9): 2114–2120. DOI:https://doi.org/10.1007/s11771-017-3620-8.
Foundation item: Projects(51174037, 51339008) supported by the National Natural Science Foundation of China
Received date: 2016-01-18; Accepted date: 2016-05-11
Corresponding author: ZHU Xiao-jun, PhD; Tel: +86-13508483028; E-mail: xjzhu@csu.edu.cn

