
Characterization of deformation stability of in-situ TiB2/6351 composites during hot compression based on Murty criterion
GUO Sheng-li(郭胜利)1, LI De-fu(李德富)1, CHEN Dong(陈 东)2, WANG Hao-wei(王浩伟)2
1. Processing Engineering Research Center, General Research Institute for Nonferrous Metals,
Beijing 100088, China;
2. State Key Laboratory of Metal Matrix Composite, Shanghai Jiao Tong University, Shanghai 200030, China
Received 27 October 2008; accepted 24 February 2009
Abstract: In situ TiB2 reinforced 6351 Al alloy composites were subjected to compression testing at strain rates and temperatures ranging from 0.001 to 10 s-1 and from 300 to 550 ℃, respectively, using Gleeble-1500D system. And the associated microstructural transformations and instability phenomena were studied by observations of the optical and transmission electron microscope. The power dissipation efficiency and instability parameter were calculated following the dynamic material model and plotted with the temperature and logarithm of strain rate to obtain processing maps for strains of 0.2, 0.4, and 0.6. The processing maps present the instability zones at higher strain rates. The result shows that with increasing strain, the instability zones enlarge. The microstructural examination shows that the interface separates even the particle cracks or aligns along the shear direction of the adiabatic shear band in the instability zones. Two domains of higher efficiencies correspond to dynamic recovery and dynamic recrystallization during the hot deformation. Using the processing maps, the optimum processing parameters of stain rates and temperatures can be chosen for effective hot deformation of TiB2/6351 composites.
Key words: TiB2/6351 composites; processing maps; dynamic recrystallization; flow instability
1 Introduction
Discontinuously reinforced metal matrix composites (MMCs) are attractive for many structural applications, especially in the aerospace and automobile industries, because they exhibit unusual combinations of mechanical, physical and thermal properties, for example, high strength, high elastic modulus, good wear resistance and good dimensional stability[1]. Nevertheless, the presence of ceramic phase in the metal matrix composites deteriorates their workability. Workability of a material is dependent on externally controllable variables like strain (ε), strain rate  temperature (T) of the workpiece, and on the inherent flow characteristics of the material. Dynamic materials model (DMM) has been developed for understanding workability parameter[2]. FROST and ASHBY first attempted the material response in terms of processing maps[3]. RAJ[4] extended subsequently the concept of Ashby’s maps to develop a processing map. According to DMM, at any strain and temperature, the power P (per unit volume) absorbed by the workpiece material during plastic flow is given by[5]
 (1)
(1)
The first integral is defined as G content and represents the major power input dissipated in the form of a temperature rise; and the second integral, defined as J co-content, represents the power dissipated by metallurgical processes, such as recovery, recrystalli- zation, cavity formation, superplastic flow, and phase transformations. J can be defined by
 (2)
(2)
where σ is the equivalent stress;  is the strain rate; and m is the strain rate sensitivity coefficient of the material under deformation given by the relationship:
 (3)
(3)
where ε is the equivalent strain.
The maximum co-content of dissipater, Jmax, is given by
 (4)
(4)
The power dissipation capacity of metals during deformation can be properly measured by the efficiency of dissipation (η) defined by
 (5)
(5)
The integration in Eq.(5) for evaluation of η needs input from =0. To overcome this problem, the integral for G is split as:
 (6)
(6)
where  expresses the lowest strain rate in the hot compression tests. The first integral on the right side of Eq.(6) is reckoned by supposing that the general form of flow behavior at constant strain and temperature is described as
 (7)
(7)
which leads to the following equation:
 (8)
(8)
The value of m at can be obtained by Eq.(3). The second integral in Eq.(6) is calculated using the trapezoidal rule[6].
Eq.(5) can be expressed by
 (9)
(9)
The regime of flow instabilities is evaluated using the criterion developed by KUMAR and PRASAD[7]. The criterion was developed on the basis of the continuity principle applied to large plastic flow by ZIEGLER[8], according to which instability occurs when
 (10)
(10)
where D is the dissipation function at a given temperature and is the effective strain rate. According to the dynamic material model, D is equivalent to J, which represents the power dissipation occurring through the microstructural changes, and hence Eq.(10) becomes
 (11)
(11)
They used Eq.(7) and obtained the condition for instability as[9]
 (12)
(12)
NARAYANA MURTY et al[10-11] considered that if σ vs curve follows the power law (Eq.(7)), the strain rate sensitivity parameter (m) is independent of and the flow instability condition given by Eq.(12) could be reduced to the relationship:
m<0 (13)
When the flow stress does not obey the power law, Eq.(12) is incorrect. They have established the simple instability criterion to be applicable for any type of σ vs curve. The instability criterion is depicted as follows [11-12].
The derivative form for  with respect to in Eq.(1) is
 (14)
(14)
From Eqs.(4) and (5), the ratio of J to can be expressed as
 (15)
(15)
Employing Eqs.(14) and (15) to replace items of Eq.(11), the instability criterion can be given by
 (16)
(16)
which is valid for m>0.
When σ vs curve follows the power law, the instability criterion in Eq.(16) becomes Eq.(13).
If the left hand side of Eq.(16) or m is negative, then it indicates microstructural instability in the material. The instability map is drawn between temperature and logarithm of strain rate. The processing map is drawn by superimposing the instability map on the power dissipation map.
2 Experimental
The material used in this study was 6351 Al composite reinforced with 8% (mass fraction) TiB2 particulates and produced by using the in situ process [13]. The size of the specimen was 15 mm in height and 10 mm in diameter. Two sets of specimens were lubricated by applying a layer of boron nitride. Isothermal, constant-strain rate compression tests were carried out on a Gleeble-1500D testing system over the temperature range of 300-550 ℃ (in step of 50 ℃) and in the strain rate range of 0.001-10 s-1. All the tests were performed at a heating rate of 3 ℃/s. The specimens were preserved for 5 min at the testing temperature prior to deformation, deformed to a true strain of 0.2, 0.4 and 0.6, respectively, and water cooled to room temperature after deformation. Specimens deformed in compression were sectioned parallel to the compression axis and microstructure was observed by using the optical and transmission electron microscopy.
3 Results and discussion
3.1 Flow curves
Typical true stress vs true strain curves at different temperatures with strain rate of 0.1 s-1 and different strain rates at 450 ℃ are shown in Fig.1. It can be seen that the flow stress decreases with increasing temperature and decreasing strain rate, thereby, exhibiting typical behaviour of metal deformed under hot working conditions. True stress―true strain curve at 300 ℃ exhibits work hardening (Fig.1(a)), whereas at higher temperature the flow softening is observed after a critical strain. The curves are characterized by an initial sharp increase of flow stress with strain up to a certain value that is followed by slope of flow decreasing and very limited flow softening.
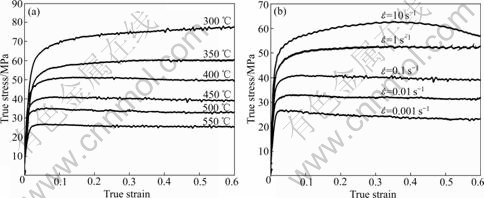
Fig.1 Typical true stress―true strain curves of TiB2/6351 composite at different temperatures with strain rate of 0.1 s-1 (a) and different strain rate at 450 ℃ (b)
3.2 Contour maps of strain rate sensitivity and efficiency of power dissipation
Table 1 shows the data of flow stress (σ) with strain (ε), strain rate and temperature. Above all, a cubic spline fit for the data of Table 1 is used to generate a greater number of data points. The data of flow stress and strain rate are changed into logarithmic scale, in order to decrease the magnitude of strain rate from 0.001 to 10 s-1, to avoid calculation error. With this changing, the first derivative of the spline fit immediately is used to calculate the strain rate sensitivity parameter m. Using Eq.(9), the efficiency of power dissipation (η) is obtained. And using Eq.(13) and Eq.(16), values of  are gained.
Table 1 Flow stress values for TiB2/6351 composite at different strain rates, strains and temperatures
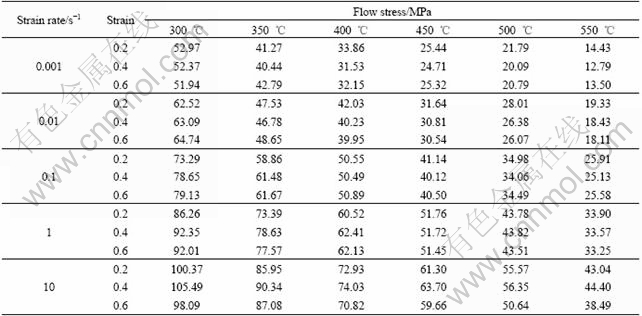
Fig.2 and Fig.3 illustrate the contour maps of strain rate sensitivity and efficiency of power dissipation calculated at strain 0.2, 0.4 and 0.6, respectively. If the values of m and η are negative, the material presents some types of unstable flows. Furthermore, it is generally considered that higher values of m and η reduce the tendency for flow localization and result in the maximum ductility. It can be noted form Fig.2 and Fig.3 that the valves of m and η are both positive. The contour maps for strain rate sensitivity parameter and efficiency of power dissipation, corresponding to strains of 0.2, 0.4 and 0.6, exhibit two interesting domains. At strains of 0.2 and 0.4, the shapes of power dissipation efficiency maps are similar, and two domains situate near the same position. The first domain of η maps occurs roughly in the temperature range of 320-380 ℃ and strain rate range of 0.02-0.25 s-1; and the second domain occurs approximately in the temperature range 500-550 ℃ and lower strain rate range of 0.001-0.1 s-1. The maximum values of η for strains of 0.2 and 0.4, in this domain, have increased up to 0.23 and 0.28 at the highest deformation temperature of 550 ℃ with strain rate 0.032 s-1 and the lowest strain rate of 0.001 s-1, respectively. It is observed that, at strain of 0.6, contour map of efficiency of power dissipation changes its shape, and the first domain of η maps occurs roughly in the temperature range of 320-380 ℃ and strain rate range of 0.032-0.2 s-1. The second domain occurs approximately in the temperature range of 440-550 ℃ and lower strain rate range of 0.002-0.2 s-1. The maximum values of η reach 0.26 and exist at the highest deformation temperature of 550 ℃ and strain rate of 0.02 s-1.
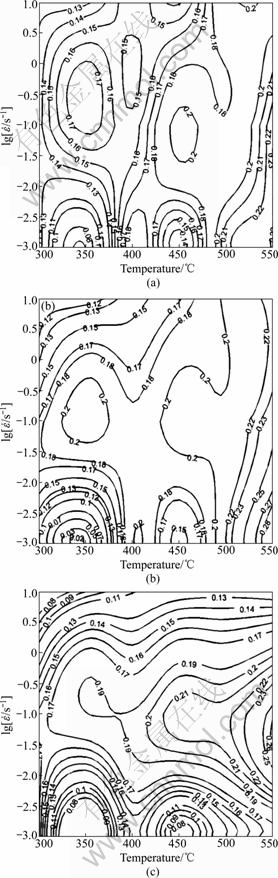
Fig.2 Contour maps of efficiency of power dissipation (η) at strains of 0.2 (a), 0.4 (b) and 0.6 (c) of TiB2/6351 composites
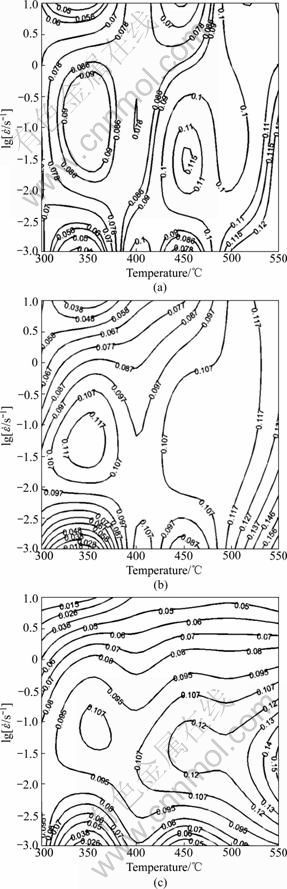
Fig.3 Contour maps of strain rate sensitivity at strains of 0.2 (a), 0.4 (b) and 0.6 (c) of TiB2/6351 composites
In addition, there is a significant shape of sensitivity maps like power dissipation maps at the particular strain. And the maps also exhibit two interesting domains. As can be seen from Fig.2 and Fig.3, locations of domains and the maximum values of m are situated in the sensitivity maps like those of domains and the maximum values of η in power dissipation maps at a constant strain.
The strain of 0.6 corresponds coarsely to the strain of steady state. In Fig.3(c), the peak efficiency in the first domain is 0.19 at 350 ℃ and 0.1 s-1, and the dissipation efficiency is about 0.16 at 300 ℃ and 0.1 s-1. Corresponding to two conditions, the transmission electron micrographs are shown in Fig.4. It is observed that at low temperature, the microstructure has higher density dislocation domains and dislocation cell structures. And the more complex dislocation structures were formed around TiB2 particles. The high dislocation density regions restrict the plastic flow and contribute to the strengthening and strain hardening. The flow curves exhibit work hardening at 300 ℃ with strain rate of 0.1 s-1 in Fig.1(a). The flow deformation behavior mainly presents working hardening under this condition. Fig.4(b) shows that, with deformation temperature increasing, the number of dislocations decreases and subgrains form by dynamic recovery. At the same time, the dislocation density around TiB2 particles reduces. As the temperature increases, the strengthening effect of TiB2 is considerably diminished, so that the material shows a similar softening behavior of the pure metals. The first domain, therefore, can be interpreted to represent the region of possible dynamic recovery.
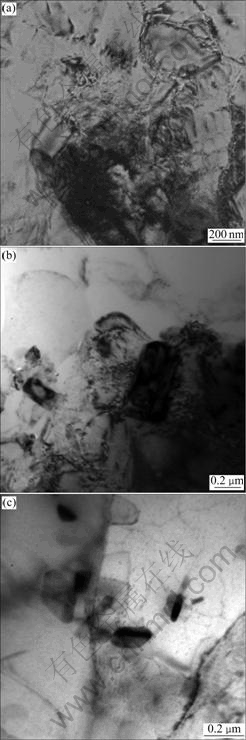
Fig.4 TEM micrographs of TiB2/6351 composites at temper- atures of 300 ℃ (a) and (b) and 350 ℃ (c) for strain of 0.6
The optical microstructures of samples tested at 450 ℃ and 550 ℃ with strain rate of 0.1 s-1 are presented in Fig.5. The flow curves in this domain represent oscillations in the flow curves before reaching steady state. In Fig.5, it can be seen that uniform and fine grains were formed, which can be attributed to the occurrence of dynamic recrystallization (DRX). Traditionally, DRX is associated with hot working of low stacking fault energy (SFE) metals which exhibit flow softening after reaching a critical strain. Aluminium is a high stacking fault energy material and is characterized by easy dislocation climb and cross slip during deformation. However, the added TiB2 particles affect the density and distribution of dislocations in the matrix, and may influence the driving force for recrystallization. In addition, the accumulation of dislocations in the vicinity of TiB2 particles may lead to the fact that those regions become sites for recrystallization nucleation. Dynamic recrystallization thus becomes easier to occur. Hence, the second domain can be interpreted to represent the region of possible dynamic recrystallization[14-16].
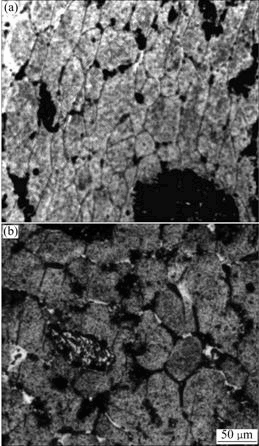
Fig.5 Optical microstructures of TiB2/6351 composites at temperatures of 450 ℃ (a) and 550 ℃ (b) for strain of 0.6
3.3 Processing maps
Fig.6 illustrates instability maps calculated at strains of 0.2, 0.4 and 0.6. By superimposing contour plots of instability parameter on those of power dissipation efficiencies, processing maps were developed and shown in Fig.7. In the process maps, the contour numbers represent efficiency of power dissipation and shaded region corresponds to flow instability (valves of are negative).
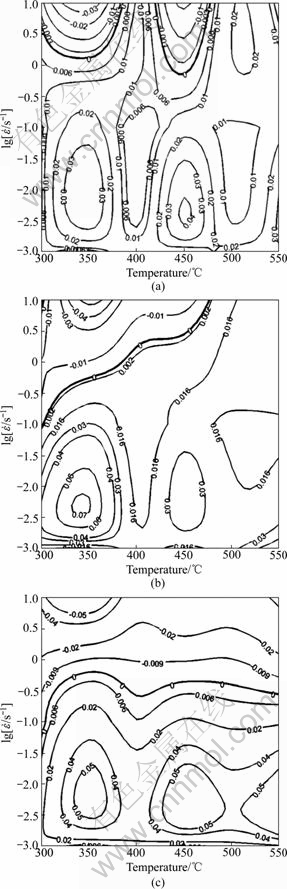
Fig.6 Instability maps of strains of 0.2 (a), 0.4 (b) and 0.6 (c) of TiB2/6351 composites
The contour numbers represent the valves of the instability parameter  in the instability maps. It can be noted form Fig.6 that at different strains, the features of instability maps are considerably diverse. The values of parameter are negative at the lower deformation temperature and higher strain rate; with increasing strain, the region of negative contour becomes larger. The region in which the value of parameter becomes negative suggests the possibility of unstableflow. The greater the negative magnitude of , the higher the possibility of unstable flow. The minimum values of are -0.03, -0.04 and -0.05 at strains of 0.2, 0.4 and 0.6, respectively, at the higher strain rate and lower temperature. The maximum values of are 0.03, 0.07 and 0.05 at strains of 0.2, 0.4 and 0.6, respectively, at the higher temperature and lower strain rate.
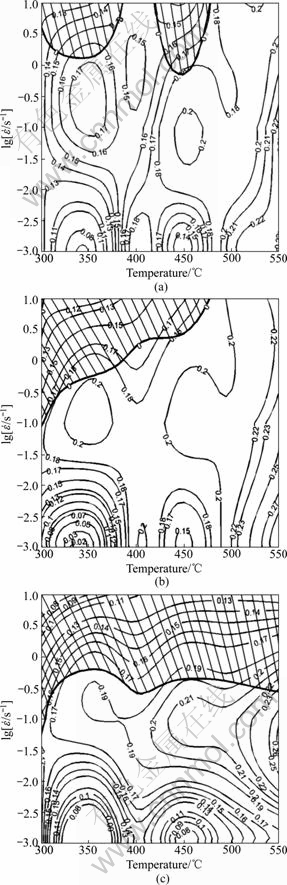
Fig.7 Processing maps of strains of 0.2 (a), 0.4 (b) and 0.6 (c) of TiB2/6351 composites
Fig.8(a) shows the interface cracking and particle breakage at 500 ℃ with the strain rate of 10 s-1 for strain of 0.6. Fig.8(b) illustrates that the particle debonding is due to interfacial failure at 400 ℃ with the strain rate of 10 s-1 for strain of 0.4. The presence of TiB2 particles in aluminum matrix during deformation causes the interface to crack since the matrix undergoes plastic flow while the particles do not deform. When the accumulated stress becomes large, the interface may separate at relatively lower temperature and higher strain rates. The particle breakage is due to accumulated stress at the interface exceeding the yield stress of the particle; hence, this results in particle breakage[15].
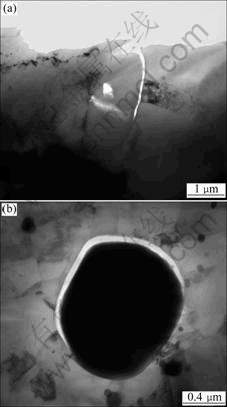
Fig.8 TEM micrographs showing interface separating and particle cracking at 500 ℃ and 10 s-1 for strain of 0.6 (a), and 400 ℃ and 10 s-1 for strain of 0.4 (b)
Fig.9 shows the particles alignment along the shear direction at 300 ℃ with the strain rate of 10 s-1 for strain of 0.6. At higher strain rates, since the time is short, the heat generated by plastic deformation is not conducted away to the colder parts of the body, a drop in the flow stress occurs locally and therefore slip becomes localized. This is called adiabatic shear bands which exhibit cracking, recrystallization along macroscopic shear planes and this generally occurs sharply at 45? with respect to the principal stress axis[16]. The TiB2 present in the aluminium matrix is disturbed due to the flow of matrix in the shear direction. So, the particles alignment along the shear directions is observed. The flow localization is due to the interface cracking or the TiB2 particle itself breaking and adiabatic shear bands present in the metal matrix, which are the manifestations of flow instability predicted by the instability maps. Therefore, those flow instability regions must be avoided in the processing of TiB2/6351 composite.
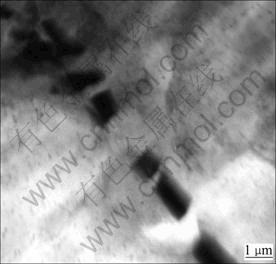
Fig.9 Particle alignment along adiabatic shear bands observed at 300 ℃ and 10 s-1 for strain of 0.6
It is concluded that with increasing strain, the flow instability manifestation of composites becomes more significant at higher stain rate, owing to increased defects such as particle fracture, debonding and adiabatic shear band. The stable deformation mechanisms include dynamic recovery and DRX. The occurrence of dynamic recovery and DRX at higher temperatures and moderate strain rate deformation results in flow stress decreasing in those deformation ranges. Nevertheless, DRX is more efficient and has lower stress than the dynamic recovery. DRX is a beneficial process in hot deformation as it gives good intrinsic workability by simultaneous softening and reconstituting the microstructure. Therefore, DRX is a chosen domain for hot workability optimization and good microstructure control in the safe zone. So, the optimum processing parameters attained by the maps are the temperature and strain rate ranges of 440-550 ℃ and 0.001-0.316 s-1, respectively.
4 Conclusions
1) The contour maps for strain rate sensitivity parameter and efficiency of power dissipation, corresponding to strains of 0.2, 0.4 and 0.6, exhibit two interesting domains. There is no significant effect of strain on the location of domains in sensitivity and power dissipation maps.
2) Dynamic recovery of TiB2/6351Al composite occurs in the first domain and composite exhibits dynamic recrystallization in the second domain, which is the optimum condition for hot working of the material in the processing maps.
3) The processing maps present the instability zones at higher strain rate; and with increasing strain, the instability zones enlarge. The microstructural examination shows that composites exhibit flow localization as bands of flow localizations, the interface cracking and particle breakage.
References
[1] TONG G Q, CHAN K C. Deformation behavior of a PM Al6013/15 SiCp composite sheet at elevated temperature [J]. Materials Letters, 1999, 38: 326-330.
[2] ROBI P S, DIXIT U S. Application of neural networks in generating processing map for hot working [J]. Journal of Materials Processing Technology, 2003, 142: 289-294.
[3] CAVALIERE P, CERRI E, EVANGELISTA E. Isothermal forging of AA2618+20%Al2O3 by means of hot torsion and hot compression tests [J]. Material Science and Engineering A, 2004, 387: 857-861.
[4] RAJ R. Development of a processing map for use in warm forming processes and hot forming processes [J]. Metallurgical and Materials Transactions A, 1981, 12: 1089-1097.
[5] CERRI E, SPIGARELLI S, EVANGELISTA E, CAVALIERE P. Hot deformation and processing maps of a particulate-reinforced 6061+20% Al2O3 composite [J]. Material Science and Engineering A, 2002, 324: 157-161.
[6] NARAYANA MURTY S V S, NAGESWARA RAO B. On the development of instability criteria during hot working with reference to IN718 [J]. Material Science and Engineering A, 1998, 254: 76-82.
[7] BAKKALI EL HASSANI F, CHENAOUI A, DKIOUAK R, ELBAKKALI L, AL OMAR A. Characterization of deformation stability of medium carbon microalloyed steel during hot forging using phenomenological and continuum criteria [J]. Journal of Materials Processing Technology, 2008, 199: 140-149.
[8] NARAYANA MURTY S V S, NAGESWARA RAO B, KASHYAP B P. On the hot working characteristics of 2014 Al-20vol% Al2O3 metal matrix composite [J]. Journal of Materials Processing Technology, 2005, 166: 279-285.
[9] PRASAD Y V R K, SESHACHARYULU T. Modelling of hot deformation for microstructural control [J]. International Material Reviews, 1998, 44: 243-258.
[10] NARAYANA MURTY S V S, NAGESWARA RAO B, KASHYAP B P. Instability criteria for hot deformation of materials [J]. International Material Reviews, 2000, 45: 15-26.
[11] NARAYANA MURTY S V S, NAGESWARA RAO B, KASHYAP B P. Identification of flow instabilities in the processing maps of AISI 304 stainless steel [J]. Journal of Materials Processing Technology, 2005, 166: 268-278.
[12] NARAYANA MURTY S V S, NAGESWARA RAO B, KASHYAP B P. On the hot working characteristics of 6061Al-SiC and 6061-Al2O3 particulate reinforced metal matrix composites [J]. Composites Science and Technology, 2003, 63: 119-135.
[13] YUE N L, LU L, LAI M O. Application of thermodynamic calculation in the in-situ process of Al/TiB2 [J]. Composite Structure, 1999, 47: 691-694.
[14] CAVALIERE P, EVANGELISTA E. Isothermal forging of metal matrix composites: Recrystallization behaviour by means of deformation efficiency[J]. Composites Science and Technology, 2003, 63: 119-135.
[15] GANESAN G, RAGHUKANDAN K, KARTHIKEYAN R, PAI B C. Development of processing maps for 6061 Al/15% SiCp composite material [J]. Materials Science and Engineering A, 2004, 369: 230-235.
[16] RAMANATHAN R, KARTHIKEYAN R, GANASEN G. Development of processing maps for 2124Al/SiCp composites [J]. Materials Science and Engineering A, 2006, 441: 321-325 .
.
Corresponding author: LI De-fu; Tel: +86-10-82241293; Fax: +86-10-82241264; E-mail: lidf@mail.grinm.com
DOI: 10.1016/S1003-6326(09)60133-3
(Edited by YANG Hua)

