J. Cent. South Univ. (2016) 23: 1611-1617
DOI: 10.1007/s11771-016-3215-9

Determination of gold nanoparticles in natural water using single particle-ICP-MS
LONG Chen-lu(�����)1, YANG Zhao-guang(����)1, 2, YANG Yuan(��Զ)1,
LI Hai-pu(���)1, WANG Qiang(��ǿ)1
1. School of Chemistry and Chemical Engineering, Central South University, Changsha 410083, China;
2. Shenzhen Research Institute, Central South University, Shenzhen 518057, China
 Central South University Press and Springer-Verlag Berlin Heidelberg 2016
Abstract: A reliable method for detecting nanoparticles is necessary for the wide application of nanomaterials. Single particle-inductively coupled plasma mass spectrometry (SP-ICP-MS) was investigated to detect the size of gold nanoparticles (AuNPs) in this work. Discrimination of particle signal and iterative algorithm were used to calculate the baseline of particle signal. Influence of dwell time was discussed and 3 ms was selected as dwell time for size detection. Different AuNPs standards (30, 60, 80 and 100 nm) and mixed samples (60 and 100 nm) were determined by SP-ICP-MS and the accuracy was confirmed with reference values. The particle size detection limit was 19 nm in ultrapure water (UP water) and 31 nm in 0.1 ��g/L Au3+ solution. Stability of AuNPs in ultrapure water and natural water samples was investigated by detecting size variation of AuNPs. The result shows that AuNPs are stable in aqueous environment for 6 d but degraded after 30 d.
Key words: single particle-ICP-MS; gold nanoparticle; size distribution detection; stability; aqueous environment
1 Introduction
With the continuous development of nanotechnology, nanomaterials are increasingly used in various fields [1-4]. As a metal-based nanomaterial, gold nanoparticles (AuNPs) can conjugate with citric acid, transferrin, amino acids and oligonucleotide because of its surface active nature. With these properties, AuNPs are applied as labels in image technologies [5-6] and used widely in the field of medicine, biology and cosmetology. While the nanoscale dimensions give AuNPs the new characteristics, the toxicological properties of AuNPs have been reported [7] and the potential for its release in the environment and subsequent effects on ecosystem health have become an increasing concern [8-10]. However, there are not many reports on the determination of AuNPs in natural environment. Therefore, a qualitative and quantitative method needs to be established urgently to detect AuNPs accurately and investigate the environmental behavior in water environment.
At present, transmission electron microscope (TEM), dynamic light scattering (DLS), high performance liquid chromatography-inductively coupled plasma mass spectrometry (HPLC-ICP-MS) and field flow fractionation-inductively coupled plasma mass spectrometry (FFF-ICP-MS) are the main methods to characterize nanoparticles [6, 11-12]. Although TEM and DLS are used more widely to detect nanoparticles, they cannot be applied in detecting the environmental samples. This is because their detection limit (mg/L) can not reach the low particle concentration (ng/L) found in natural environment. Although FFF-ICP-MS is able to achieve the detection limit, it still cannot be used to detect the environmental samples because of its weak separation of nanoparticles and ionized element [13].
Due to its high sensitivity and low detection limits, inductively coupled plasma mass spectrometry (ICP-MS) has been used to detect ionized and particle elements in recent years. Single particle detection using ICP-MS was first discussed by MCCARTHY and DEGUELDRE in 1992 [14] and femto-gram nanoparticles in air were measured successfully by MOMIZU et al [15-16]. However, it is only until recently that SP-ICP-MS becomes a newly reliable detection method for small particles. SP-ICP-MS has now been used to characterize colloid gold, zirconia, thorium, uranium, and nano-scale silver [17-21]. Furthermore, SP-ICP-MS can also be used to detect nanoparticles in organismal tissue [22-23].
As an important feature for environment behavior, size variation could reveal the gold nanoparticles�� stability and transformation situation partially. In this work, size distribution and stability of gold nanoparticle were investigated using SP-ICP-MS. Nanoparticle signal distinguished from background and the effect of dwell time were discussed. Therefore, a stable and accurate method for detecting AuNPs in natural water was established and the stability of AuNPs was studied.
2 Materials and methods
2.1 Theory
According to the theory first proposed by DEGUELDRE et al [17, 20], different signals were shown between dissolved ions and nanoparticles in time resolved analysis (TRA) mode of ICP-MS. Compared to the constant low dissolved signal, obvious pulse signal was generated after nanoparticles were introduced into the plasma. When the solution was sufficiently diluted to guarantee only one particle introduced into the plasma, size and mass of nanoparticles can be calculated through pulse signal as follows [24-26]:
1) Transport efficiency ��n: The relationship between transport efficiency ��n and frequency of nanoparticle detected fnp (pulse per event) is given by
Fnp=Nnp��Qsam����n (1)
where Nnp is the number concentration of nanoparticles (L-1); Qsam is the sample flow rate (mL/min). When Nnp is given, the transport efficiency ��n can be calculated by Eq. (1).
2) Mass flow equation m (per event): The mass flow equation can be educed by the calibration curve of dissolved ion:
m=Qsam����n��tdwell��C (2)
where tdwell is the dwell time, which equals the gap between two readings; C is the calibration equation of the detected dissolved ion.
3) Mass of nanoparticle mnp: The signal of nanoparticle from TRA mode can be transferred into the mass of nanoparticle by
 (3)
(3)
where Spulse is the signal of nanoparticle; Sbkgd is the background signal of nanoparticle; ��iis the particle ionization efficiency; k is the slope of mass flow equation and fm is the mass fraction of analyzed nanoparticle.
4) Diameter of nanoparticle dnp: For nanoparticle suspensions, particles are assumed spherical, then the diameter is expressed as
 (4)
(4)
2.2 Instruments and reagents
AuNPs standard suspensions were obtained from NanoComposix (U.S.A) including 30 nm, 60 nm, 80 nm and 100 nm in nominal size (tannic acid coated aqueous solution). The mass concentration of AuNPs solution was 0.05 mg/mL. Dissolved gold standard solution (1000 mg/L, National Center of Analysis and Testing for Nonferrous Metals and Electronic Materials, China) was diluted freshly to follow concentration: 0, 0.05, 0.2, 0.5 and 2 mg/L (2% HCl).
All vessels were soaked in 20% HNO3 for over 24 h and washed by ultrapure water. Before detection, the instrument of ICP-MS was tuned to guarantee high sensitivity, low minimum oxide and doubly charged species using a tuning solution (Agilent, USA, 1 ��g/L, Li, Co, Y, Tl, Ce and Ba contained in 2% HNO3). For better dispersion, AuNPs samples were sonicated for 15 min in a ultrasound cleaner.
An ICP-MS (7700��, Agilent, USA) with Mircomist nebulizer was used to detect both AuNPs and dissolved gold, and the data acquisition mode is TRA. High purity 99.99% liquid argon and ultrapure water were obtained from PERSEE (resistivity higher than 18.2 M����cm, China).
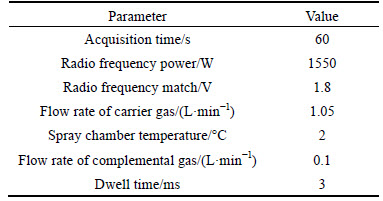
The parameters of ICP-MS were set as shown in Table 1.
Table 1 Operating conditions for ICP-MS analysis
3 Results and discussion
3.1 Determination of AuNPs signals
The Au raw signal in ultra pure (UP) water, dissolved gold, 60 nm and 100 nm AuNPs standard solution are shown in Fig. 1. The dwell time was set to be 3 ms. In TRA mode, raw signal was recorded as counts every reading event and signal counts were related to the status of the elements. The signal in UP water is basically due to the noise of the instrument and impurities from previous samples, and constant significant signal at around 50 ion counts is shown in 500 ng/L dissolved gold solution because of sufficient mix. However, Fig. 1(c) shows that the raw signal of nanoparticle is displayed as discontinuous spikes, consistent with the mechanism of single particle detection mentioned above. To confirm that the pulse signals are truly caused by the presence of AuNPs, a signal of 100 nm AuNPs standard is detected. From Fig. 1(d), numerous spikes and counts larger than 60 nm are observed. According to the theory mentioned above, the signal is directly proportional to the diameter (or mass) of the particle, which explains that the pulses are truly arising from the existence of AuNPs.

Fig. 1 Raw signals in TRA mode of ICP-MS:
Although AuNPs are displayed as pulse signal in Fig. 1, AuNPs signals cannot be distinguished from background completely. The AuNPs signal intensity distribution frequency is shown in Fig. 2. Due to the low concentration of AuNPs, zero values and small counts of impurities are the most signals counts among all detected signals. Therefore, these small signals are counted as background. With the increase of the signal value, the frequency distribution is gradually reduced to a certain minimum range. Signal intensity corresponded to the minimal frequency is considered as the boundary between AuNPs signal and background. Signal intensity above the boundary is regarded as AuNPs signal.
To acquire the accurate boundary count, an iterative algorithm [27-28] is used to discriminate AuNPs from background. Specific steps of the iterative algorithm are outlined below. Firstly, average count (��) and standard deviation (��) of all the counts need to be calculated. Then a constant number n is supposed and put into formula ��+n���� and n=5 is chosen for this work which makes the formula as ��+5����. Signal above ��+5���� is removed and the calculation is repeated to the remaining data until no signals are removed. The final count plus 5�� is considered as the signal boundary between AuNPs and background.
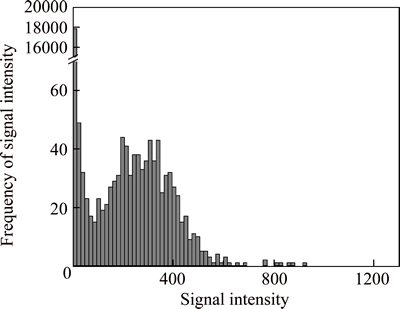
Fig. 2 25 ng/L 60 nm AuNPs frequency of count distribution
3.2 Effect of dwell time
Dwell time represents the time interval between every two signal readings. The possibility of single particle entered into the plasma being detected is influenced by the change of dwell time. Resolution and detection limit will also be affected by dwell time. To prove the influence of dwell time on resolution and detection limits, the raw signals of 60 nm 25 ng/L AuNPs mixed with 1000 ng/L dissolved Au at dwell time of 3, 10, 20 ms are shown in Fig. 3. When dwell time is set at 20 ms, more dissolved gold ions are introduced into the plasma which increased the signal intensity of background, and nanoparticle signals are indistinguishable. Background counts were calculated through iterative algorithm; it shows that the baselines of 3, 10 and 20 ms are 10, 46 and 71 counts respectively. The baseline rises from the bottom of the counts when dwell time increases. With increasing dwell time, small AuNPs signal may also be wrongly regarded as background intensity, which increases the detection limit of AuNPs.

Fig. 3 Raw signal of 60 nm 25 ng/L AuNPs mixed with 1000 ng/L dissolved Au3+ in different dwell time:
Dwell time does not only affect the background value, but also the chances of a plurality of nanoparticles entering the detector simultaneously. To find a optimal dwell time for detection, intensity frequency distribution of different dwell time is displayed in Fig. 4. 60 nm 500 ng/L AuNPs is detected when dwell time is set at 3 ms, 5 ms, 10 ms and 20 ms, respectively. Nanoparticle signals are collected separately with little big counts distribution and overlap between dissolved gold ions and AuNPs is low when dwell time is set at 3 ms. When dwell time increases, multiple AuNPs are more possibly introduced into the plasma between two readings. In Fig. 4, when dwell time is 20 ms, large count appears around 2500 particles, which indicates that more multiple nanoparticles were detected. Lower dwell time at 0.1 ms and 1 ms have been tried by MONTANO et al [29] and TUORINIEMI et al [27], the result shows that lower dwell time can increases the particle resolution. But when dwell time is parallel or lower than the duration of particle events, a nanoparticle is likely to be detected partially, that would cause more overlap between particles and dissolved ions. For better resolution and detection limit, 3 ms is chosen as the dwell time.
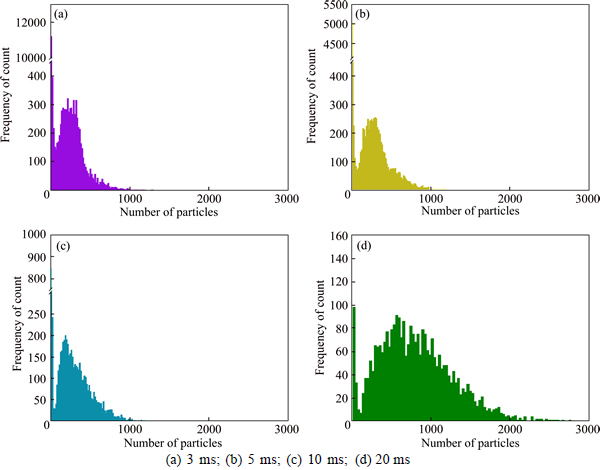
Fig. 4 Signal intensity frequency distribution of 100 nm AuNPs 500 ng/L in different dwell time:
3.3 Size detection of AuNPs
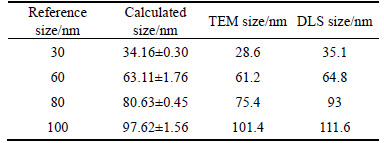
The particle size are calculated through the calibration culve between the counts of dissolved ions and their mass, and the calculated mass is transferred into diameter by assuming AuNPs as spherical particles. Different number concentration (5500/mL, 11000/mL, 22000/mL) of 60 nm AuNPs is used as standard solution to determine transport efficiency ��n based on Eq. (1). The transport efficiency ��n is used to characterize the size of AuNPs based on Eq. (2) and Eq. (3). The size of 30, 60, 80 and 100 nm AuNPs using SP-ICPMS and the reference size of TEM and DLS are displayed in Table 2. The results show that the calculated average size is close to the reference value.
Table 2 Particle size comparison of AuNPs suspension between calculated results and referenced value (n=3)
Although average diameter has been detected accurately, the resolution of SP-ICP-MS needs to be testified. A mixed solution of 12.5 ng/L 60 nm and 25 ng/L 100 nm AuNPs was selected. Size distribution of mixed AuNPs sample is shown in Fig. 5. In theory, the particle counts would increase with increasing the diameter of nanoparticles and the size distribution should consistent with every standard. Figure 5 shows that there are two peaks obviously displayed around 60 nm and 100 nm, it indicates that the size distribution matches the mixed standard precisely. However, the peak of 100 nm is much lower than that of 60 nm. This is because the particle number concentration is inversely proportional to the diameter of nanoparticles. Therefore, different size of AuNPs can be well differentiated by SP-ICP-MS.
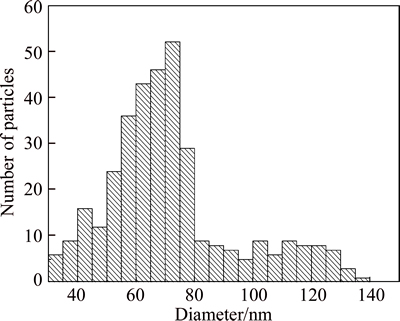
Fig. 5 Size distribution of mixed AuNPs solution (12.5 ng/L 60 nm and 25 ng/L 100 nm AuNPs)
3.4 Size detection limit
The size detectability of nanoparticle in single particle detection mode depends on the factor that the size of the nanoparticle should be large enough to generate amount of ions detectable by the spectrometer. This factor implies the size detection limit (Sdl) which can be defined as the lowest nanoparticle signal distinguished from the background. Sdl is given by [25]:
 (5)
(5)
where Xnp is the mass fraction of analyte element, for AuNPs, Xnp=1; �� is the standard deviation of background (if 5�� is chosen); K=��ion����interf����trans, ��ion, ��interf and ��trans represent ionization, extraction and transmission efficiencies of mass spectrometer, respectively; A is the atomic abundance of the isotope; NA is the Avogadro��s constant and Mn is the atomic mass of Au. From Eq. (5), �� and the detection efficiency are closely related to the size detection limit. Thus, improvement of ionization conditions, extraction and transmission efficiencies can reduce the size detection limit. Sdl of AuNPs diluted in UP water and 0.1 ��g/L dissolved Au3+ are calculated. An approximate size detection limit of 19 nm for 60 nm AuNPs in UP water and 31 nm for 60 nm AuNPs in dissolved Au3+ are determined. Therefore, existence of Au3+ would interfere with the detection of AuNPs significantly by increasing the detection limit of AuNPs.
3.5 Application
Single Particle-ICP-MS has been proved as a reliable and fast method for detecting gold nanoparticles, it can be applied to characterize the AuNPs in natural water samples for further investigation. As one of the environmental behavior, the change of AuNPs�� size affects the stability of AuNPs. If the particle size changes slightly in natural water, it reveals that AuNPs are stable in water and effect environment as nanoparticle form, otherwise, AuNPs could transfer into other forms. Stability study of AuNPs in aqueous environment is investigated using SP-ICP-MS. Fresh water and sanitary wastewater samples are collected from Xiangjiang River and Hunan University, China, respectively. Then all the samples are filtered through 0.45 ��m milipore filter membrane to remove possible AuNPs [28]. 60 nm and 100 nm AuNPs standards (60 nm 25 ng/L and 100 nm 50 ng/L) are added into the water samples to detect the transformation of particle diameter during the next 6 days. The same procedures are carried out in UP water for comparison.
Size variation of 60 nm and 100 nm AuNPs in the two water samples are displayed in Fig. 6. The diameters of 60 nm and 100 nm AuNPs equal the standard value in the first day, and fluctuates slightly in both fresh water and sanitary wastewater in 6 days as well as in UP water. It indicates that ions and organic matters in natural water have little influence on AuNPs; and it can be relatively stable for 6 days.
Furthermore, the particle diameter of sample in Xiangjiang River (60 nm 25 ng/L, 100 nm 50 ng/L) is detected after a month, the raw signal comparison of the first day and the 30th day are shown in Fig. 7. Although AuNPs are relatively stable in aqueous environment, little pulse signals remain after 30 days, which reveals that the AuNPs degrade or absorb significantly after 30 days. However, the form of the products needs further study. Therefore, AuNPs contained solution does not have to be detected immediately but cannot be stored for a long period if AuNPs need to be detected in natural samples.
4 Conclusions
In this work, single particle-ICP-MS is applied to determine the size of AuNPs. Nanoparticle signal is distinguished with iterative algorithm and the experimental factors were optimized. The dwell time is 3 ms. Single and multiple particle diameter standards are detected, the reliability and good resolution of this method are demonstrated by comparing with the reference values. Stability research of AuNPs is investigated in aqueous environment and the results reveal that AuNPs keep stable in water (samples) for 6 days, but almost degrade entirely after 30 d. It shows that single particle-ICP-MS is a reliable method for size detection and environment behavior study of AuNPs.

Fig. 6 Size variation of AuNP in natural water:
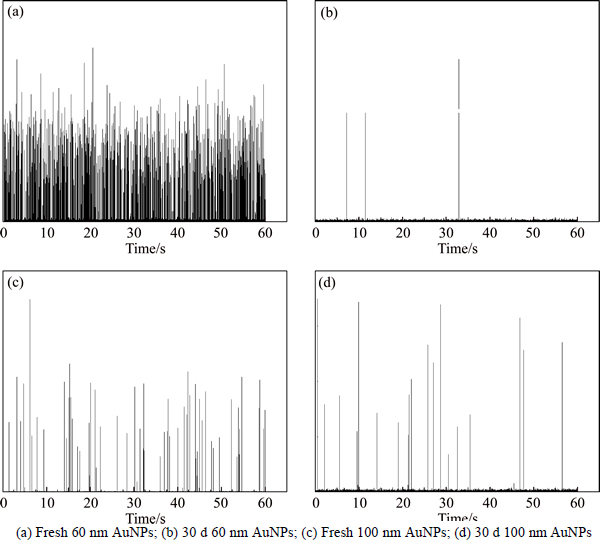
Fig. 7 Signal comparison of 60 nm and 100 nm AuNPs after 30 d:
References
[1] BARIK T K, SAHU B, SWAIN V. Nanosilica-from medicine to pest control [J]. Parasitology Research, 2008, 103(2): 253-258.
[2] WIESNER M R, LOWRY G V, ALVAREZ P, DIONYSIOU D. Assessing the risks of manufactured nanomaterials [J]. Environmental Science & Technology, 2006, 40: 4336-4345.
[3] WANG Q, YANG Z G, YANG Y, LONG C L. A bibliometric analysis of research on the risk of engineering nanomaterials during 1999-2012 [J]. Science of the Total Environment, 2014, 473: 483-489.
[4] ZHU Jie. Photocatalytic properties of thin films of ruthenium metallopolymers/gold nanoparticle: Polyoxometalate composites using visible excitation [J]. Journal of Central South University, 2013, 20: 2657-2662.
[5] GILJOHANN D A, SEFEROS D S, DANIEL W L, MASSICH M D, PATEL P C, MIRKIN C A. Gold nanoparticles for biology and medicine [J]. Angewandte Chemie International Edition, 2010, 49: 3280-3294.
[6] SCHMIDT B, LOESCHNER K, HADRUP N, MORTENSEN A, SLOTH J J, KOCH C B, LARSEN E H. Quantitative characterization of gold nanoparticles by field-flow fractionation coupled online with light scattering detection and inductively coupled plasma mass spectrometry [J]. Analytical Chemistry, 2011, 83: 2461-2468.
[7] FADEEL B, GARCIA-BENNETT A E. Better safe than sorry: Understanding the toxicological properties of inorganic nanoparticles manufactured for biomedical applications [J]. Advanced Drug Delivery Reviews, 2010, 62: 362-374.
[8] KLAINE S J, ALVAREZ P J, BATLEY G E, FERNANDES T F, HANDY R D, LYON D Y, MAHENDRA S, MCLAUGHLIN M J, LEAD J R. Nanomaterials in the environment: Behavior, fate, bioavailability, and effects [J]. Environmental Toxicology and Chemistry, 2008, 27: 1825-1851.
[9] BAUN A, HARTMANN N B, GRIEGER K, KUSK K O. Ecotoxicity of engineered nanoparticles to aquatic invertebrates: A brief review and recommendations for future toxicity testing [J]. Ecotoxicology, 2008, 17: 387-395.
[10] LEE J, MAHENDRA S, ALVAREZ P J J. Nanomaterials in the construction industry: A review of their applications and environmental health and safety considerations [J]. Acs Nano, 2010, 4: 3580-3590.
[11] LIU H L, PIERRE-PIERRE N, HUO Q. Dynamic light scattering for gold nanorod size characterization and study of nanorod-protein interactions [J]. Gold Bulletin, 2012, 45(4): 187-195.
[12] FRANZE B, ENGELHARD C. Fast separation, characterization, and speciation of gold and silver nanoparticles and their ionic counterparts with micellar electrokinetic chromatography coupled to ICP-MS [J]. Analytical Chemistry, 2014, 86: 5713-5720.
[13] GRAY E P, BRUTON T A, HIGGINS C P, HALDEN R U, WESTERHOFF P, RANVILLE J F. Analysis of gold nanoparticle mixtures: A comparison of hydrodynamic chromatography (HDC) and asymmetrical flow field-flow fractionation (AF4) coupled to ICP-MS [J]. Journal of Analytical Atomic Spectrometry, 2012, 27: 1532-1539.
[14] MCCARTHY J F, DEGUELDRE C. Sampling and characterization of colloids and particles in groundwater for studying their role in contaminant transport [J]. Environmental Particles, 1993, 2(1): 247-315.
[15] MOMIZU T, KANECO S, TANAKA T, YAMAMOTO T, KAWAGUCHIN H. Determination of femto-gram amounts of zinc and lead in individual airborne particles by inductively coupled plasma-mass spectroscopy with direct air-sample introduction [J]. Anal Sci, 1993, 9(6): 843-846.
[16] MOMIZU T, HOSHINO N, KANECO S, TANAKA T, YAMAMOTO T, KAWAGUCHI H, KITAGAWA K. Successive measurement of femto-gram elemental content in individual airborne particles by ICP-MS [J]. Anal Sci, 2001, 17(10): 61-64.
[17] DEGUELDRE C, FAVARGER P Y, BITEA C. Zirconia colloid analysis by single particle inductively coupled plasma�Cmass spectrometry [J]. Analytica Chimica Acta, 2004, 518(1): 137-142.
[18] DEGUELDRE C, FAVARGER P Y. Thorium colloid analysis by single particle inductively coupled plasma-mass spectrometry [J]. Talanta, 2004, 62(5): 1051-1054.
[19] DEGUELDRE C, FAVARGER P Y, ROSSE R, WOLD S. Uranium colloid analysis by single particle inductively coupled plasma-mass spectrometry [J]. Talanta, 2006, 68(3): 623-628.
[20] DEGUELDRE C, FAVARGER P Y, WOLD S. Gold colloid analysis by inductively coupled plasma-mass spectrometry in a single particle mode [J]. Analytica Chimica Acta, 2006, 555: 263-268.
[21] LABORDA F, JIMENEZ-LAMANA J, BOLEA E, CASTILLO J R. Selective identification, characterization and determination of dissolved silver(I) and silver nanoparticles based on single particle detection by inductively coupled plasma mass spectrometry [J]. Journal of Analytical Atomic Spectrometry, 2011, 26(7): 1362-1371.
[22] GRAY E P, COLEMAN J G, BEDNAR A J, KENNEDY A J, RANVILLE J F, HIGGINS C P. Extraction and analysis of silver and gold nanoparticles from biological tissues using single particle inductively coupled plasma mass spectrometry [J]. Environmental Science & Technology, 2013, 47(24): 14315-14323.
[23] LOESCHNER K, NAVRATILOVA J, KOBLER C, MOLHAVE K, WAGNER S, VON DER KAMMER F, LARSEN E H. Detection and characterization of silver nanoparticles in chicken meat by asymmetric flow field flow fractionation with detection by conventional or single particle ICP-MS [J]. Analytical And Bioanalytical Chemistry, 2013, 405: 8185-8195.
[24] PACE H E, ROGERS N J, JAROLIMEK C, MOLHAVE K, WAGNER S, VON DER KAMMER F, LARSEN E H. Determining transport efficiency for the purpose of counting and sizing nanoparticles via single particle inductively coupled plasma mass spectrometry [J]. Analytical Chemistry, 2011, 83: 9361-9369.
[25] LABORDA F, BOLEA E, JIMENEZ-LAMANA J. Single particle inductively coupled plasma mass spectrometry: A powerful tool for nanoanalysis [J]. Analytical Chemistry, 2014, 86: 2270-2278.
[26] YANG Yuan, LONG Chen-lu, YANG Zhao-guang, LI H-P, WANG Q. Characterization and determination of silver nanoparticle using single particle-inductively coupled plasma-mass spectrometry [J]. Chinese Journal of Analytical Chemistry, 2014, 42: 1553-1560.
[27] TUORINIEMI J, CORNELIS G, HASSELLOV M. Size discrimination and detection capabilities of single-particle ICPMS for environmental analysis of silver nanoparticles [J]. Analytical Chemistry, 2012, 84: 3965-3972.
[28] MITRANO D M, LESHER E K, BEDNAR A, MONSERUD J, HIGGINS C P, RANVILLE J F. Detecting nanoparticulate silver using single-particle inductively coupled plasma�Cmass spectrometry [J]. Environmental Toxicology and Chemistry, 2012, 31(1): 115-121.
[29] MONTANO M D, BADIEI H R, BAZARGAN S, RANVILLE J F. Improvements in the detection and characterization of engineered nanoparticles using spICP-MS with microsecond dwell times [J]. Environmental Science-Nano, 2014, 1(4): 338-346.
(Edited by FANG Jing-hua)
Foundation item: Projects(21407182, 21277175) supported by the National Natural Science Foundation of China; Project(20120162110019) supported by the Specialized Research Fund for the Doctoral Program of Higher Education of China
Received date: 2015-04-27; Accepted date: 2015-07-30
Corresponding author: WANG Qiang, PhD; Tel: +86-731-88876961; E-mail: qwangcsu@163.com

