
J. Cent. South Univ. (2018) 25: 1590-1597
DOI: https://doi.org/10.1007/s11771-018-3851-3

Determination of trace impurity elements in MnZn ferrite powder by direct current glow discharge mass spectrometry
FU Liang(����)1, 2, MA Jun-cai(������)3, SHI Shu-yun(ʩ����)1
1. School of Chemistry and Chemical Engineering, Central South University, Changsha 410083, China;
2. Collaborative Innovation Center of Green Development for Wuling Mountain Areas,Yangtze Normal University, Fuling 408100, China;
3. Chongqing Shangjia Electronics Co., Ltd., Fuling 408100, China
 Central South University Press and Springer-Verlag GmbH Germany, part of Springer Nature 2018
Abstract: An analytical method for the determination of 26 impurity elements (such as Li, Be, Na, Mg, Al, Si, P, S, K, Ca, Sc, Ti, V, Cr, Co, Ni, Ga, Ge, Y, Nb, Mo, Ag, Cd, Sb, W and Pb) in MnZn ferrite powder by direct current glow discharge mass spectrometry (GD-MS) was established. MnZn ferrite powder was mixed with copper powder, used as a conductor, and pressed. The effects of MnZn ferrite powder preparation conditions and glow discharge parameters for the sensitivity and stability of signal analysis were investigated. By determining the choice of isotope and the application of the mass resolutions of 4000 (MR, medium resolution) and 10000 (HR, high resolution), mass spectral interference was eliminated. The contents of impurity elements in MnZn ferrite powder was calculated by subtraction after normalizing the total signal of Mn, Zn, Fe, O and Cu. The results showed that the detection limit of 26 kinds of impurity elements was between 0.002 and 0.57 ��g/g, and the relative standard deviation (RSD) was between 3.33% and 32.35%. The accuracy of this method was verified by the ICP-MS. The method was simple and practical, which is applied to the determination of impurity elements in MnZn ferrite powder.
Key words: MnZn ferrite powder; glow discharge mass spectrometry; impurity elements; copper powder
Cite this article as: FU Liang, MA Jun-cai, SHI Shu-yun. Determination of trace impurity elements in MnZn ferrite powder by direct current glow discharge mass spectrometry [J]. Journal of Central South University, 2018, 25(7): 1590�C1597. DOI: https://doi.org/10.1007/s11771-018-3851-3.
1 Introduction
Polycrystalline ferrite is a complex system composed of crystallites, grain boundaries and pores [1]. MnZn ferrites are very important soft magnetic ferrite functional materials and because of its chemical composition and crystal structure, this material has high initial permeability, saturation magnetization, and relatively lower eddy current loss compared with alloy cores [2]. They have been widely applied in the field of electronics as antenna rods, electromagnetic interference suppressors and core materials for electronic transformers [3�C5]. The impurity of MnZn ferrites affects the properties and product grade significantly therefore accurate and quick determination of impurity content is very important for research and production of MnZn ferrites.
Glow discharge mass spectrometry (GD-MS) has been widely used for multi-element investigations of trace- and ultra-trace impurities in highly pure metals and semiconductors [6�C8]. Its main advantages include a wide linear dynamic range, excellent detection limits, high mass resolution and high sensitivity for a wide range of analytes [9�C11]. Another advantage of GD-MS is that solid materials can be directly analyzed where the complicated pretreatment process is greatly simplified. The GD atomization and ionization source proceeds in the negative glow of cathode dark space and anode close to the sample surface, which results in the decrease of matrix effects. Hence, accurate results can still be obtained without a standard reference material. Currently, GD-MS instruments are receiving much attention for the analysis of materials for non-conductive sample applications [12]. GD-MS is limited to measurements on conducting samples and so insulating samples require a suitable pretreatment in order to increase conductivity [13�C15]. In this paper, GD-MS is first applied to determining the impurities in MnZn ferrite powder and then to MnZn ferrite powder after the pressing of Cu powder. The total signal of Mn, Zn, Fe, O and Cu is processed in a normalization method and the contents of the impurities are calculated by a subtraction method. As a result, the quick and accurate determination of impurities in MnZn ferrite powder is achieved.
2 Experimental
2.1 Instrumentation and materials
The instrument used in this investigation is an Element GD (Thermo Fisher Scientific, USA) glow discharge mass spectrometer. This is a double focusing mass spectrometer enabling mass resolutions of 400 (LR, low resolution), 4000 (MR, medium resolution), and 10000 (HR, high resolution). It was equipped with a Grimm-type fast flow glow discharge cell and an integrated Peltier- type cooling system. The combination of detectors allows measurements of ultra traces up to matrix elements over a linear dynamic range of 12 orders of magnitude. An SDY-30 Electric tablet machine (Tianjin Keqi High & New Technology Corporation, China) was used to press the mixed copper and MnZn ferrite powder. For the comparison of analytical results, an Agilent 7500cx Series inductively coupled plasma mass spectrometry (ICP-MS) system (Agilent, USA) was used.
Copper powder of high purity (99.99%) was bought from Shanghai Zhanyun Chemical Co. Ltd., China. MnZn Ferrite samples were supplied by Chongqing Shangjia Electronics Co. Ltd., China.
2.2 Samples preparation
Glow discharge sample cathodes were prepared by mixing 0.4 g of MnZn ferrite powder with 1.6 g high purity copper powder in a mortar and grinded to a fine powder. Before mixing, all samples and the copper powder were dried at 110 ��C for 2 h. The homogeneous mixture was compressed into tablets at a pressure of 20 MPa by an electric tablet machine. The powder on the surface of the sample tablet was blown away by N2, and the prepared sample was placed into the sample holder and installed in the ion source. To remove any possible contamination on the surface of the sample tablet, a 20 min Ar+ sputtering was performed before data collection.
2.3 GD-MS analysis
The GD-MS was tuned to obtain maximum and stable 23Na, 24Mg, 31P, 32S and 44Ca signals in medium resolution (MR) for the mixed sample. The selected instrumental conditions and data acquisition parameters are listed in Table 1. The secondary electron multiplier and Faraday detector were calibrated by the signal intensity of 36Ar measurements in low resolution (LR) [10]. Mass spectrometric data were collected after the stabilization of the 63Cu, 55Mn, 65Zn and 56Fe signals in the sample tablet.
Table 1 GD-MS operating conditions and measurement parameters

2.4 ICP-MS analysis
ICP-MS was used to confirm the contents in MnZn ferrite powder samples after microwave digestion. Sample preparation and other details of the measurement were described in detail previously [16].
2.5 Data processing
Under the optimized experimental conditions, the signals of Mn, Zn, Fe, O and Cu were handled in a normalization method according to the data automatically collected by GD-MS. First, by Formula (1), the analyte content in the mixed powder was calculated. Then, using Formula (2), the analyte content of the copper powder itself was calculated. Lastly, using Formula (3), the contents of the analytes in MnZn ferrite powder were obtained.

 (1)
(1)
 (2)
(2)
 (3)
(3)
where IX, IMn, IZn, IFe, IO and ICu are the signal strengths of the analytes X, Mn, Zn, Fe, O and Cu, respectively. AX, AMn, AZn, AFe, AO and ACu are the isotope abundances of the analytes X, Mn, Zn, Fe, O and Cu, respectively. RSFX is the relative sensitivity factors of the analyte X. 
 and
and  are the contents of the analyte X in MnZn ferrite powder, mixed powder and copper powder, respectively. m(MnZn ferrite):m(Copper)= 1 : 3. R is the mass ratio of MnZn ferrite to copper powder.
3 Results and discussion
3.1 Sample pretreatment conditions
There are significant differences in the conductivity between sample tablets pressed under different conditions, the more the copper powder in the mixed powder, the better the conductivity of the sample tablets. Therefore, in order to maintain stability, it is necessary to be as sensitive to the elements as much as possible. To find the optimum-mixing ratio for MnZn ferrite powder and copper powder samples, 5 sample tablets (labeled 1�C5) with different MnZn ferrite powder to copper powder mass ratios (1:1, 1:2, 1:3, 1:4 and 1:5) were pressed. The determination was carried out under the selected condition of GD-MS, and the changes of 55Mn signal intensity in the 5 sample tablets were studied. Tablets No. 1 (1:1) and No. 2 (1:2) were not suitable for use because of their poor conductivity due to the low copper powder content. These samples were liable to bring about an unstable discharge process and deviate with the 55Mn signal strength. The influence of sample Tablets No. 3�C5 on the peak intensity of 55Mn is compared in Figure 1. It can be seen that Tablets No. 3�C5 could all stably discharge however both the content of 55Mn in the sample tablets and their signal strengths gradually decreased. The greatest signal strength was found for the mixed powder tablet in which the mass ratio of MnZn ferrite powder to copper powder is 1:4.
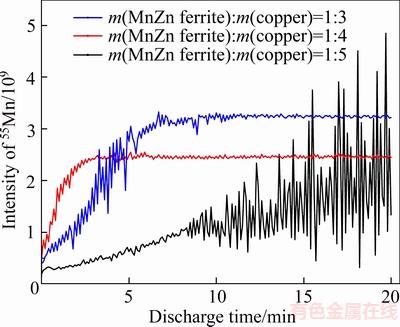
Figure 1 Influence of mixing ratio between MnZn ferrite powder and copper powder on peak intensities and stability of the 55Mn signal in medium resolution
3.2 Selection of helium gas flow rate
Some non-metal elements have a high first ionization potential. Using argon as a discharge gas means that the ionization efficiency of these non-metal elements is low. The discharge gas composition has an important function for the ionization efficiency of sample atoms. To increase the signal intensity of these elements, helium gas was introduced as an additional glow discharge gas to the commonly used argon plasma [17]. For this reason, the optimal helium gas flow rate was determined by means of studying the signal intensity of phosphor (among these 26 impurity elements, phosphor has the highest first ionization potential of 10.49 eV) effect under various helium gas flow rates. Using a fixed argon gas flow rate of 400 mL/min, the helium gas was increased in steps of 25 mL/min at approximately every 2 min from 0 to 150 mL/min. The measured ion peak intensity of 31P influenced by helium gas flow rate is displayed in Figure 2. It can be seen that the signal intensity of 31P increases with the increase of the helium gas flow rate. However, when helium gas flow rate exceeds 100 mL/min, the signal of 31P enhancement is less effective and drift effects increased. Therefore, a mixture of argon gas flow rate of 400 mL/min and helium gas flow rate 100 mL/min was employed as the discharge gas.

Figure 2 Influence of stepwise helium gas addition to argon gas on peak intensities of 31P
3.3 Optimization of discharge parameter
The main factors influencing the ionization and sputtering efficiency in a glow discharge source are the discharge current, discharge gas flow and pre-sputtering time. Five representative impurity elements (Na, Mg, P, S and Ca) were chosen to test the effects of the discharge current, discharge gas flow and pre-sputtering time on signal intensity. Figure 3 shows the influence of discharge current on the stability of the relative signal intensity of the 5 elements. When the discharge current was 30�C40 mA, relative standard deviation (RSD) was obvious and the signals were unstable and when increased to 40�C60 mA, the RSD was smaller. It was considered that the more the current increased, the larger the degree of sputtering of the sample occurred resulting in a sharp increase of the deposition on the anode. A short circuit is very likely to occur so the discharge current for this experiment was selected to be 50 mA.
Figure 4 shows the effects of the changes of discharge gas flow on RSD of relative signal intensity of the 5 elements when the discharge current was fixed to 50 mA. The 5 elements had small RSD in the range of 250�C550 mL/min, so this experiment helped us decide that the best discharge gas flow was 400 mL/min.

Figure 3 Influence of discharge current on stability of relative signal intensity of 5 elements
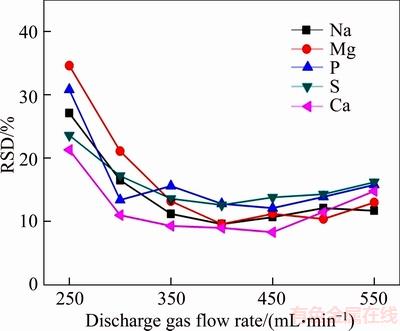
Figure 4 Influence of discharge gas flow rate on stability of relative signal intensity of 5 elements
Figure 5 displays the influence of the pre-sputtering time on RSD of relative signal intensity of the 5 elements under the condition of the selected discharge current and discharge gas flow. It can be seen that the RSD is at a minimum in 10�C30 min range. Finally, the selected pre-sputtering time was 20 min.
3.4 Mass spectrometry interference
According to the working principle of mass spectrometry, all charged ions, along with the samples, were likely to go into mass analyzer to form the mass spectrogram, and thereby mass spectrometry interference happened. The mass spectral interferences of the analytical isotope may be caused by different ionic species formed in the glow discharge plasma [18]. According to the principle of isotopic selection [19], we selected isotopes of the analytes in order to reduce the probability of isobaric interference. Afterwards, using a double-focusing mass spectrometer, MR and HR were applied to eliminating mass spectrometry interference. In the experiment, all analytical isotopes, except for 39K, could easily be separated from the interference peak in MR mode. Interfered by 1H38Ar mass spectrum peaks, the theoretical resolution of 39K was required to be 5689. Consequently, the determination of 39K must be operated in the HR mode, which is shown in Figure 6. The selections of isotope and resolution are showed in Table 2.

Figure 5 Influence of pre-sputtering time on stability of relative signal intensity of 5 elements
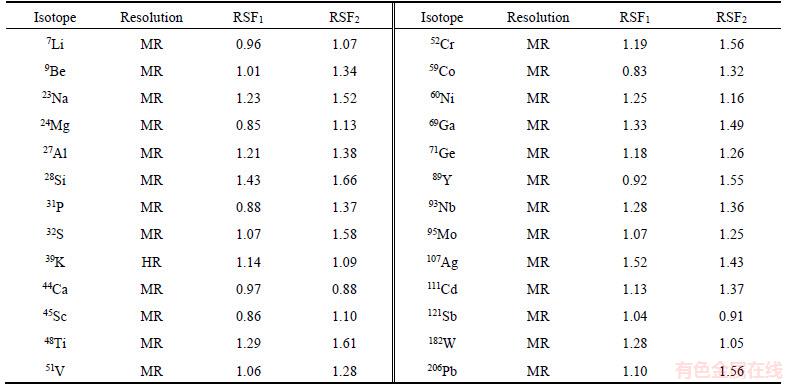
In this work, the relative sensitivity factors (RSF) for each element under different GD-MS conditions were also investigated. In Table 2, RSF1 was obtained from the mixed discharge gas at argon gas flow rate of 400 mL/min and helium gas flow rate 100 mL/min, and RSF2 was obtained from the mixed discharge gas at pure argon gas flow rate of 400 mL/min. As the RSF is the gradient of the calibration function between concentration and ions response, a larger RSF means a lower sensitivity to the elements. It can be seen from Table 2 that there are some differences between RSF1 and RSF2. For most elements, RSF1 are less than RSF2. It was even more obvious that the helium gas as an additional glow discharge gas improved the sensitivity of most elements.
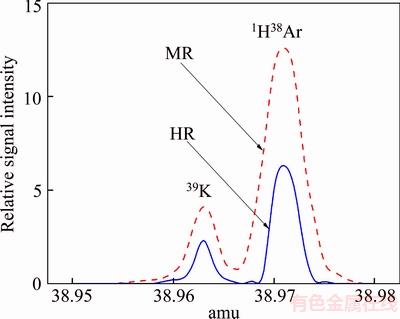
Figure 6 Mass spectra for 1H38Ar and 39K obtained by GD-MS
Table 2 Isotopes, mass resolution and relative sensitivity factors (RFS) of analytes
3.5 Detection limit
The copper powder was used as the blank reagent, and compressed into 11 sample tablets in accordance with the sample pretreatment methods. Under the optimized condition of GD-MS, the 26 impurity elements in the copper powder were determined by GD-MS. The method detection limit (MDL) was calculated as the average plus 3 times the standard deviation of the concentrations in the blanks [20]. Table 3 shows the measured value of the elements in copper and the MDL. It can be seen that the detection limits of the method were 0.002�C0.57 ��g/g. These MDL values are superior to those found in the literature [16]. Due to the higher content of some impurity elements in the copper powder used in this experiment, the detection limits of these elements are also higher when copper powder was used as the blank reagent. If higher purity copper powder is recommended then the MDL could be improved.
3.6 Analytical applications
The proposed method was applied for the determination of 26 impurity elements in two different kinds of real samples (sample A and sample B). For the validation of the accuracy of the results obtained from GD-MS, the sample was measured by comparative analysis with ICP-MS. The results are shown in Table 4. Without the certified reference material of MnZn ferrite powder, RSDs of all elements ranged between 3.33% and 32.35%, the elements with low content in MnZn ferrite powder have a larger RSD. This proves that the precision of this method is satisfactory. By comparing this method with ICP-MS, it was found that the GD-MS analyses are consistent with the results of ICP-MS, which affirmed that this method is highly accurate.
4 Conclusions
We describe an analytical method for the determination of 26 impurity elements in MnZn ferrite powder. Copper powder, used as the conductive medium, was mixed with MnZn ferrite powder to press tablet, and then the impurity elements in MnZn ferrite powder were determined by direct current GD-MS. The total signal of Fe, Mn, Zn, O and Cu was handled by a normalization method according to the data automatically collected by GD-MS, and the impurity elements in MnZn ferrite powder were calculated using a subtraction method. Detection limits for the investigated elements were in the range of 0.002�C0.57 ��g/g, and the RSD of each element was within 3.33% to 32.35%. By comparing this method with ICP-MS, it was found that the two methods obtain the same results. In this method the steps of sample pre-treatment were simplified, which met the demand of rapidly analyzing multi-elements in soft magnetic functional materials. This work will provide support for the determination of impurity elements in other kinds of non-conductive powder sample.
Table 3 Method detection limit (MDL) and precision
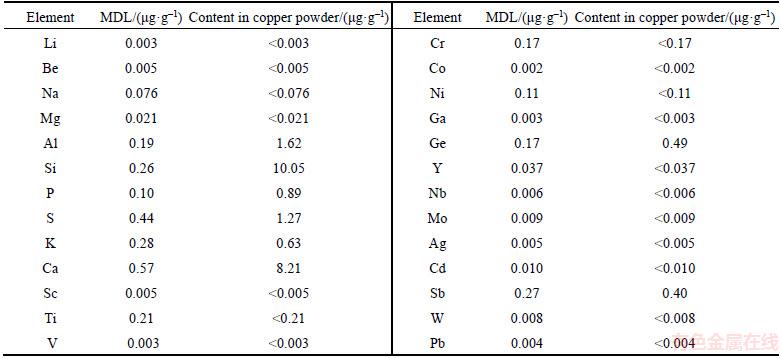
Table 4 Comparison of results of elemental concentrations in MnZn ferrite powder by GD-MS and ICP-MS

References
[1] SHOKROLLAHI H, JANGHORBAN K. Influence of additives on the magnetic properties, microstructure and densification of Mn-Zn soft ferrites [J]. Materials Science and Engineering B, 2007, 141(3): 91�C107.
[2] EBRAHIMI S A S, MASOUDPANAH S M, AMIRI H, YOUSEFZADEH M. Magnetic properties of MnZn ferrite nanoparticles obtained by SHS and sol-gel autocombustion techniques [J]. Ceramics International, 2014, 40(5): 6713�C6718.
[3] TSAKALOUDI V, KOGIAS G, ZASPALIS V T. Process and material parameters towards the design of fast firing cycles for high permeability MnZn ferrites [J]. Journal of Alloys and Compounds, 2014, 588: 222�C227.
[4] KOGIAS G, TSAKALOUDI V, der VALk P V, ZASPALIS V. Improvement of the properties of MnZn ferrite power cores through improvements on the microstructure of the compacts [J]. Journal of Magnetism and Magnetic Materials, 2012, 324(2): 235�C241.
[5] ZLATKOV B S, MITROVIC N S, NIKOLIC M V, MARICIC A M, DANNINGER H, ALEKSIC O S, HALWAX E. Properties of MnZn ferrites prepared by powder injection molding technology [J]. Materials Science and Engineering B, 2010, 175(3): 217�C222.
[6] GUSAROVA T, HOFMANN T, KIPPHARDT H, VENZAGO C, MATSCHAT R, PANNE U. Comparison of different calibration strategies for the analysis of zinc and other pure metals by using the GD-MS instruments VG 9000 and element GD [J]. Journal of Analytical Atomic Spectrometry, 2010, 25(3): 314�C321.
[7] ZHANG Jian-ying, ZHOU Tao, TANG Yi-chuan, CUI Yan-jie, LI Jin-ying. Determination of relative sensitivity factors of elements in high purity copper by doping-melting and doping-pressed methods using glow discharge mass spectrometry [J]. Journal of Analytical Atomic Spectrometry, 2016, 31(11): 2182�C2191.
[8] SCHMITT S W, VENZAGO C, HOFFMANN B, SIVAKOV V, HOFMANN T, MICHLER J, CHRISTIANSEN S, GAMEZ G. Glow discharge techniques in the chemical analysis of photovoltaic materials [J]. Progress in Photovoltaics: Research and Applications, 2014, 22(3): 371�C382.
[9] PLOTNIKOV A, PFEIFER J, RICHTER S, KIPPHARDT H, HOFFMANN F. Determination of major nonmetallic impurities in magnesium by glow discharge mass spectrometry with a fast flow source using sintered and pressed powder samples [J]. Analytical and Bioanalytical Chemistry, 2014, 406(29): 7463�C7471.
[10] JUNG S, KIM S, HINRICHS J. Determination of trace elements in high purity alumina powder by helium enhanced direct current glow discharge mass spectrometry [J]. Spectrochimica Acta Part B: Atomic Spectroscopy, 2016, 122: 46�C51.
[11] SIQIN Bilige, QIAN Rong, ZHUO Shang-jun, GAO Jie, JIN Jun, WEN Zhao-yin. Studies of rare earth elements to distinguish nephrite samples from different deposits using direct current glow discharge mass spectrometry [J]. Journal of Analytical Atomic Spectrometry, 2014, 29(11): 2064�C2071.
[12] DONG Jiang-li, QIAN Rong, XIONG Wei, QU Hai-yun, SIQIN Bilige, ZHUO Shang-jun, JIN Jun, WEN Zhao-yin, HE Pin-gang, ROBINSON P K. Determination of doping elements of synthetic crystals by direct current glow discharge mass spectrometry [J]. International Journal of Mass Spectrometry, 2014, 361(1): 1�C8.
[13] MODANESE C, ARNBERG L, SABATINO M D. Analysis of impurities with inhomogeneous distribution in multicrystalline solar cell silicon by glow discharge mass spectrometry [J]. Materials Science and Engineering B, 2014, 180(2): 27�C32.
[14] SABATINO M D. Detection limits for glow discharge mass spectrometry (GDMS) analyses of impurities in solar cell silicon [J]. Measurement, 2014, 50(1): 135�C140.
[15] QIAN Rong, ZHUO Shang-jun, WANG Zheng, ROBINSON P K. Direct current glow discharge mass spectrometric analysis of non-conducting materials using a surface coating method [J]. Journal of Analytical Atomic Spectrometry, 2013, 28(7): 1061�C1067.
[16] ZHANG Ping, FU Liang, MA Jun-cai, TANG You-gen. Determination of impurity elements in MnZn ferrites by inductively coupled plasma mass spectrometry [J]. Journal of Central South University, 2015, 22(1): 37�C42.
[17] LANGE B, MATSCHAT R, KIPPHARDT H. Enhancement of intensities in glow discharge mass spectrometry by using mixtures of argon and helium as plasma gases [J]. Analytical and Bioanalytical Chemistry, 2007, 389(7, 8): 2287�C2296.
[18] YU Xing, LI Xiao-jia, WANG Hai-zhou. Interference correction in analysis of stainless steel and multi-element determination by glow discharge quadrupole mass spectrometry [J]. International Journal of Mass Spectrometry, 2007, 262(1, 2): 25�C32.
[19] NIE Xi-du LIANG Yi-zeng, TANG You-gen, XIE Hua-lin. Trace amounts of impurities in electrolytic manganese metal by sector field inductively coupled plasma mass spectrometry [J]. Journal of Central South University, 2013, 20(12): 3385�C3390
[20] AHMADI H, BOLINIUS D J, JAHNKE A, MACLEOD M. Mass transfer of hydrophobic organic chemicals between silicone sheets and through plant leaves and low-density polyethylene [J]. Chemosphere, 2016, 164: 683�C690.
(Edited by HE Yun-bin)
���ĵ���
�Թ�ŵ������ⶨ���������еĺ�������Ԫ��
ժҪ�������˻Թ�ŵ�����( GD-MS)���ⶨ��п��������Li��Be��Na��Mg��Al��Si��P��S��K��Ca��Sc��Ti��V��Cr��Co��Ni��Ga��Ge��Y��Nb��Mo��Ag��Cd��Sb��W��Pb��26������Ԫ�صķ�������������ͭ��Ϊ������ʣ�����п�������ĩ��ͭ�ۻ�Ͼ��Ⱥ�ѹƬֱ�Ӳⶨ���е�����Ԫ�ء��Ż�����Ʒ���Ʊ����̣������˻Թ�ŵ�������ŵ��ѹ���ŵ����������Լ�Ԥ����ʱ��ȷŵ�����Դ���Ԫ���ź�ǿ�Ⱥ��ȶ��Ե�Ӱ�죬ѡ����ʵ�ͬλ�ء������зֱ���ģʽ�߷ֱ���ģʽ�����������ţ���Fe��Mn��Zn��O��Cu���ź�����һ�����������ò����������п��������26������Ԫ�صĺ������о����������������Ԫ�صļ������0.002~0.57 ��g/g֮�䣬��Ա�ƫ��Ϊ3.33%~32.35%������ICP-MS����֤�˷������һ���ԣ�����������ȷ�Ⱥá����ܶȸߡ�
�ؼ��ʣ���п�����壻�Թ�ŵ����ף�����Ԫ�أ�ͭ��
Foundation item: Project(21275162) supported by the National Natural Science Foundation of China; Project(KJZH14217) supported by the Achievement Transfer Program of Institutions of Higher Education in Chongqing, China; Project(KJ1601224) supported by the Scientific and Technological Research Program of Chongqing Municipal Education Commission, China
Received date: 2017-01-20; Accepted date: 2017-03-06
Corresponding author: SHI Shu-yun, PhD, Professor; Tel: +86�C731�C88830883; E-mail: syshicsu@163.com; ORCID: 0000-0002-2873- 9478

