J. Cent. South Univ. (2017) 24: 394-401
DOI: 10.1007/s11171-017-3441-4

Blasingame production decline type curves for analysing a multi-fractured horizontal well in tight gas reservoirs
WEI Ming-qiang(κ��ǿ)1, DUAN Yong-gang(������)1, CHEN Wei(��ΰ)2,
FANG Quan-tang(��ȫ��)1, LI Zheng-lan(������)1, GUO Xi-ran(��ϣȽ)1
1. State Key Laboratory of Oil and Gas Reservoirs Geology and Exploitation, Southwest Petroleum University, Chengdu 610500, China;
2. School of Computer Science, Southwest Petroleum University, Chengdu 610500, China
 Central South University Press and Springer-Verlag Berlin Heidelberg 2017
Abstract: Production decline analysis has been considered as an important method to obtain the flow parameters, reservoir properties and original gas in place. Although advanced Blasingame production decline analysis methods for vertical wells, fractured wells and horizontal wells are widely used, limited study has conducted on Blasingame production decline type curves for multi-fractured horizontal well (MFHW). Based on the perpendicular bisection (PEBI) grids, a numerical model was developed and the solution was obtained using control volume finite element method and the fully implicit method. Blasingame production decline-type curves of the infinitely conductive MFHW were plotted through computer programming. A field case was presented to analyse and verify the model developed. Five flow regimes, including early formation linear flow, early radial flow, compound linear flow, transient flow and pseudo-radial flow, are recognized. Fracture spacing is the main factor that affects early radial flow, compound linear flow and transient flow, the distance from the well to the circular boundary affects the pseudo-radial flow, and the type curves are also significantly affected by the formation permeability, fracture number and fracture half-length. The validation of field case suggests that the Blasingame production decline type curves proposed in this work can be applied to the production decline analysis for MFHW in tight gas reservoirs.
Key words: tight gas reservoir; fractured horizontal well; unstructured grid; production decline; type curves
1 Introduction
With the decrease of conventional natural gas and increase of natural gas demand in the world, the tight gas reservoirs with abundant reserves are likely to be the dominant suppliers of future natural gas production [1]. Horizontal well drilling and hydraulic fracturing are effective means for improving the output of low permeability and tight gas reservoirs [2]. Production decline analysis is an important technique to obtain the flow parameters, reservoir properties and a well��s original gas in place. In recent decades, production decline issues and methods have been studied by many scholars. Although various analytical and numerical methods [3-6] have been used to study the transient behaviours and performance of multi-fractured horizontal well (MFHW), most of them only simply forecast the rules about rate or dimensionless rate versus time.
However, to diagnose reservoir properties and decline rate, the type curves methods are widely used in dynamic analysis of wells in the last decades. In general, there are mainly three analysis methods (Arps, Fetkovich and Blasingame). The first analysis method for describing the rate of decline was presented by ARNOLD and ANDERSON [7]. Based on field production data, empirical rate-decline correlations (such as exponential, hyperbolic, harmonic and power-law decline) have been proposed [8, 9], but the correlations can not be used to analyse production decline during the early transient period. More recently, Fetkovich production decline analysis method was developed under constant bottomhole flowing pressure and was proven capable of determining certain flow parameters and reservoir properties [10, 11]. However, the Fetkovich method is based on highly idealized assumed production conditions, such as constant wellbottom flow pressure, and only few flow parameters and reservoir properties can be obtained. BLASINGAME et al [12] presented a new method for estimating drainage area size and shape using production data, which is derived for the variable rate flow in a closed reservoir. PALACIO and BLASINGAME [13] proposed the Blasingame production decline method for a vertical gas well with a variable production rate by introducing the material balance pseudo-time. Later, Blasingame production dynamic analysis method became more and more popular, and had been extended to different well types and reservoir types by many scholars. PRATIKNO et al [14] and SHIH et al [15] researched fractured and horizontal wells using the Blasingame production decline, respectively. CLARKSON et al [16] investigated the production data analysis of a fractured horizontal CBM well using the Blasingame rate decline method. ZAREENEJAD et al [17] investigated the production data analysis of horizontal wells in an oil field using a vertical well rate decline model. WANG et al [18] attempted to study on Blasingame production decline type curves of MFHW in shale reservoirs with triple continumm, but the type curves were not verified by field data. KETINENI [19], NOBAKHT et al [20, 21], and ZHAO [22] studied multi-fractured horizontal well rate decline behaviours using semi-analytical and numerical methods, but few parameters were obtainable using the their method. However, due to the complexity of pressure and flow fields after fracturing, limited study has conducted on Blasingame production decline type curves for MFHW.
Thus, a numerical method was applied in this work to study the Blasingame production decline curves of a MFHW in tight gas reservoirs. Based on the basic principles of production decline analysis and the application of a perpendicular bisection (PEBI) grid, a production decline numerical model of an infinitely conductive MFHW was derived by the control volume finite element method and fully implicit method, and the Blasingame production decline type curves of a MFHW in tight gas reservoirs were plotted and analysed.
2 Mathematical model construction and solution
PEBI grids are widely used in many fields, especially in the petroleum industry as they are more flexible in simulating complex geometries and have less grid orientation effects than Cartesian grids [23-25]. Therefore, PEBI grids are introduced herein to formulate the numerical model and simulate the flow process of a MFHW, yielding the Blasingame type curves of the MFHW.
Generally, due to the effects of brittle minerals in tight gas reservoirs, the bi-wing fractures of a horizontal well are usually generated by hydraulic fracturing [25, 26], and a schematic of a fracture in a MFHW in a tight gas reservoir is shown in Fig. 1. Furthermore, the MFHW PEBI grids (Fig. 2) used in this work were constructed with reference to the method of MLACNIK et al [27] and ZHA et al [28], and the mathematical model of the MFHW in a tight gas reservoir was derived based on the following assumptions:
1) The gas reservoir studied in this wrok is a single-layer one with closed top and bottom boundaries and impermeable lateral boundaries. The formation is homogenous and isotropic with porosity ��, permeability k and reservoir thickness h. Before production, the reservoir pressure is equal to the initial pressure pi, which is uniformly distributed.
2) A horizontal well with length L is located in the centre of the bounded circular reservoir, and gas flows into the horizontal wellbore through hydraulic fractures.
3) All of the hydraulic fractures are transverse fractures and symmetrically distributed on both sides of the horizontal wellbore, and they penetrate the formation completely. The fractures, with fracture spacing df, fracture half-length xf and fracture width wf, are equally spaced and have the same properties.
4) The well produces gas at a constant flow pressure pwf. The flow into the fractures is infinitely conductive, and the pressure in each fracture is equal to the bottemhole flowing pressure (pwf).
5) The reservoir temperature is constant, and the effect of gravity is neglected.

Fig. 1 Effective-fracture concept for MFHW in tight gas reservoir

Fig. 2 Physical model of MFHW PEBI grid
Based on the PEBI grid, the control volume finite element method [24, 29] illustrated in Fig. 2 and the mass conservation law, the equations of the mathematical model are derived as follows:
Gas reservoir area:
 (1)
(1)
Hydraulic fracture area:
 (2)
(2)
In Eqs. (1) and (2), Tij,g is the conductivity between grid j and grid i (if grid i is the boundary grid, the conductivity is 0), m3/d; pj is the pressure of grid j, MPa; pi is the pressure of grid i, MPa; Ti,fk is the conductivity between grid i and fracture grid k, m3/d; Vi is the volume of grid i, m3; ��t is the time step, hour; ��i is the porosity of grid i, decimal; and Bg is the gas volume factor. The superscript n denotes the nth time step, and n+1 denotes the (n+1)th time step.
There is a strong nonlinear relationship between the parameters of the gas��s physical properties (gas viscosity, deviation factor, etc.) and pressure. Given the stability and reliability of the solutions to Eqs.(1) and (2), the conductivity, pressure and the accumulating terms on the right side of Eqs. (1) and (2) can be expanded by a fully implicit method [30].
 (3)
(3)
where k is the reservoir permeability, ��m2; Gij is the shape factor between grid i and grid j, m; Aij is the cross-sectional area between grid i and grid j, m2; mg is the gas viscosity, mPa��s; dij is the distance between grid i and grid j, m; ��pij is the pressure variation of grid i or grid j from step n to n+1 step, MPa; ��pj is the pressure variation of grid i and grid j from step n to n+1 step, respectively, MPa; v is the vth iteration step, and v+1 is the (v+1)th iteration step.
Substituting Eq. (3) into Eqs. (1) and (2) results in a discrete mathematical expression for the gas reservoir and hydraulic fracture area.
Gas reservoir area:


 (4)
(4)
Hydraulic fracture area:

 (5)
(5)
After assigning the grid mesh properties value to the MFHW physical model, each grid pressure can be solved by the generalized minimal residuals algorithm (GMRES) method [31] based on the discrete mathematical model constructed using Eqs. (4) and (5).
3 Blasingame production decline theory
According to the basic principles of Blasingame production decline analysis and the solution to Eqs. (4) and (5), the normalized rate, normalized cumulative production and normalized integral derivative cumulative production can be obtained by the following mathematical expressions [13]:
The normalized rate:
 (6)
(6)
The normalized cumulative production:
 (7)
(7)
The normalized integral derivative cumulative production:
 (8)
(8)
In Eqs. (6)�C(8), q is the production rate, 104 m3/d; ppi and ppwf are the normalized pseudo initial pressure and normalized pseudo bottomhole flowing pressure, respectively, MPa; and tca is the mass balance pseudo- time, h.
The normalized pseudo-pressure is defined as follows:
 (9)
(9)
The mass balance pseudo-time is defined as follows:
 (10)
(10)
In Eqs. (9) and (10), z is the deviation factor; ct is the total compressibility, MPa-1; and subscript i denotes the initial pressure condition.
4 Production decline characteristics and parameter sensitivity analysis
Based on the proposed model and the method outlined above, the MFHW Blasingame production decline type curves (Fig. 3) can be plotted and the pressure of each grid can be obtained at different times by solving Eqs. (4) and (5) and (8)�C(10) with basic data (Table 1). According to the behaviours of the Blasingame production decline curves (Fig. 3) and pressure cloud chart (Fig. 4), the curves can be divided into five regimes: I) early formation linear flow (EFLF), which represents fluid flowing linearly from the formation into hydraulic fractures (Fig. 4(a)); II) early radial flow (ERF) around each fracture (Fig. 4(b)); III) formation compound linear flow (FCLF) (Fig. 4(c)), in which the interference between adjacent fractures can be observed; IV) transient flow (TF); and V) pseudo-radial flow (PRF) (Fig. 4(d)), in which a normalized rate with a slope trend of -1 is observed. This flow period indicates that the pressure wave has spread to a closed boundary.

Fig. 3 MFHW Blasingame production decline type curves for tight gas reservoirs
Table 1 Basic calculated parameters for Blasingame production decline curves

Furthermore, the effects of parameters such as permeability, distance from the well to the circular boundary, fracture length, fracture spacing and fracture number on the infinitely conductive MFHW Blasingame production decline type curves are discussed in detail below.
Figure 5 shows the effect of the formation permeability (k) on the infinitely conductive MFHW Blasingame production decline type curves. It can be observed that the values of q/��pp, (q/��pp)i and (q/��pp)id of the production decline type curves become greater during the EFLF, ERF, FCLF and TF stages with an increase in formation permeability. However, pseudo- radial flow emerges early because of mass balance.
Figure 6 shows that the distance from the well to the circular boundary (re) has a great effect on the transient flow and pseudo-radial flow of the Blasingame production decline type curves. With an increase in re, the duration of the transient flow increases and the
occurrence time of the pseudo-radial flow is delayed. And more time is required for the pressure surge to spread to the boundary with an increase in the distance from the well to the circular boundary (re).

Fig. 4 Schematic diagrams of flow regimes of MFHW in tight gas reservoir:
Figure 7 illustrates the effect of fracture spacing (df) on the ERF, FCLF and TF of the Blasingame production decline type curves. With the increase in fracture spacing, the duration time of the ERF period around each fracture increases, and the occurrence time of the FCLF is delayed. This behaviour occurs because increasing df will lead to a delay in the interference between fractures. In addition, it can be observed that the value of q/��pp, (q/��pp)i during the CFL and TF periods rises with the increase in fracture spacing.
Figures 8 and 9 indicate that the fracture number (nf) and half-length (xf) affect the type curves. The effects ofthe fracture number and fracture half-length on the type curves shown in Figs. 6 and 7 are approximately the same. As the fracture number and half-length increase, the values of q/��pp, (q/��pp)i and (q/��pp)id of the Blasingame decline type curves become larger during the EFLF, ERF, FCLF and TF stages, and the pseudo-radial radius flow appears earlier due to mass balance.

Fig. 5 Effect of formation permeability (k) on type curves
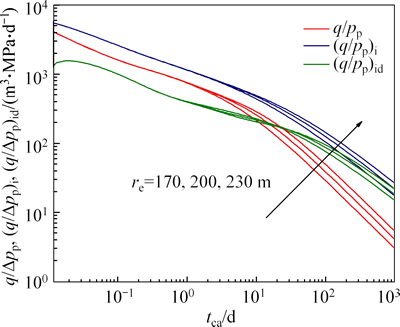
Fig. 6 Effect of distance from well to circular boundary (re) on type decline curves

Fig. 7 Effect of fracture spacing (df) on type curves
According to the discussion above, the flow parameters, reservoir properties and original gas in place for MFHWs in tight gas reservoirs can be evaluated by matching type curves with actual field data.

Fig. 8 Effect of fracture number (nf) on type curves
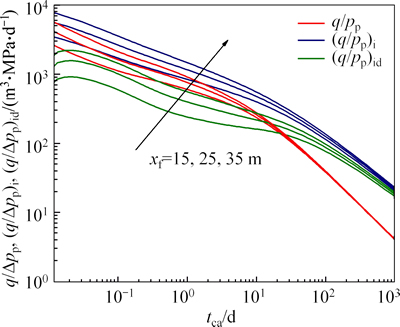
Fig. 9 Effect of fracture half-length (xf) on type curves
5 Field application validation
A field case study is presented to demonstrate the application of the proposed mathematical model and method. XS-H1 is a MFHW of the Xinchang gas field, which is a typical tight gas reservoir in western China. The well radius is 0.1 m; the pay zone thickness is 19.5 m; the porosity is 0.102; the total compressibility is 0.99��10-4 MPa-1; the initial reservoir pressure is 36.68 MPa; the formation temperature is 66 ��C; the gas gravity is 0.6; the hydraulic fracture number is 3; and the fracture spacing is 100 m.
The production data of XS-H1 was matched and analysed by the MFHW Blasingame production decline analysis method proposed in this work. Figure 10 shows that the Blasingame production decline type curves match the real production data of XS-H1 perfectly, except for the mismatch/deviation in the left part of the production data (q/��pp)id due to the effect of the fracturing fluid flowing back during the early production period. The results (Table 2) of the production decline analysis can be obtained by matching the Blasingame decline curves of XS-H1 and each period of the real Blasingame decline curves emerges, including early formation linear flow (I), early radial flow (II), formation compound linear flow (III), transient flow (IV) and pseudo-radial flow (V). However, the fifth stage only beginns to emerge in this case.

Fig. 10 Matched curves of XS-H1 Blasingame production decline
Table 2 Results of MFHW XS-H1 Blasingame production decline analysis

Overall, the numerical model and method proposed in this work can be considered an extension of the Blasingame production decline type curves for a MFHW, and as verified by the results of a field case study, they can be used to effectively perform a production decline analysis of a MFHW in tight gas reservoirs.
6 Conclusions
1) Our numerical model and method can be used to establish MFHW Blasingame production decline curves in tight gas reservoirs, extending the Blasingame production decline curves to the MFHW field.
2) Infinitely conductive MFHW Blasingame production decline curves are divided into five flow stages: fracture formation linear flow, early radial flow, formation compound linear flow, transient flow and pseudo-radial flow.
3) Due to the interference between fractures, fracture spacing is the main factor that affects early radial flow, formation compound linear flow and transient flow; the distance from the well to the circular boundary affects the pseudo-radial flow. Furthermore, the type curves are significantly affected by the formation permeability, fracture number, and fracture half-length. As the formation permeability, fracture number, and fracture half-length increase, the values of q/��pp, (q/��pp)i, and (q/��pp)id of the production decline type curves become larger during the EFLF, ERF, FCLF, and TF stages.
4) The validation of field case suggests that the Blasingame production decline type curves proposed in this work could be applied to evaluate the flow parameters, reservoir properties, and a well's original gas in place for the MFHW of tight gas reservoirs.
References
[1] HOLDITCH S A. Tight gas sands [J]. Journal of Petroleum Technology, 2006, 58(6): 86-93.
[2] WANG Yong-hui, LU Yong-jun, LI Yong-ping, WANG Xin, YAN Xue-mei, ZHANG Zhi-yong. Progress and application of hydraulic fracturing technology in unconventional reservoir [J]. Acta Petrolei Sinica A, 2012, 33(1): 149-158. (in Chinese)
[3] LEI Z, CHENG S, LI, X, XIAO H. A new method for prediction of productivity of fractured horizontal wells based on non-steady flow [J]. Journal of Hydrodynamics B, 2007, 19(4): 494-500.
[4] GRIESER W V, SHELLERY R F, SOLIMAN M Y. Predicting production outcome from multi-stage, horizontal Barnett completions [C]// SPE Production and Operations Symposium. Oklahoma: Society of Petroleum Engineers, 2009: 1-10.
[5] ALI A J, SIDDIQUI S, DEHGHANPOUR H. Analyzing the production data of fractured horizontal wells by a linear triple porosity model: Development of analysis equations [J]. Journal of Petroleum Science and Engineering, 2013, 112: 117-128.
[6] LIN J, ZHU D. Modeling well performance for fractured horizontal gas wells [J]. Journal of Natural Gas Science and Engineering, 2014, 18: 180-193.
[7] ARNOLD R, ANDERSON R. Preliminary report on the Coalinga oil district, Fresno and Kings counties [R]. California, USA: US Government Printing Office, 1908.
[8] ARPS J J. Analysis of decline curves [J]. Transactions of the AIME, 1945, 160(1): 228-247.
[9] ILK D, RUSHING J A, PEREGO A D, BLASINGAME T A. Exponential vs hyperbolic decline in tight gas sands: Understanding the origin and implications for reserve estimates using Arps' decline curves [C]// SPE Annual Technical Conference and Exhibition. Colorado, USA: Society of Petroleum Engineers, 2008: 1-23.
[10] FETKOVICH M J. Decline curve analysis using type curves [J]. Journal of Petroleum Technology, 1980, 32(6): 1065-1077.
[11] SHAHVERDI H R. Determining of fractured reservoir properties by decline rate [D]. Tehran: Tehran University, 2005.
[12] BLASINGAME T A, LEE W J. Variable rate reservoir limits testing [C]// Permian Basin Oil & Gas Recovery Conference. Midland, USA: Society of Petroleum Engineers, 1986: 1-9.
[13] PALACIO J C, BLASINGAME T A. Decline-curve analysis using type curves-analysis of gas well production data [C]// The SPE Rocky Mountain Regional/Low Permeability Reservoirs Symposium. Denver, USA: Society of Petroleum Engineers, 1993: 1-10.
[14] PRATIKNO H, RUSHING J A, BLASINGAME T A. Decline curve analysis using type curves-fractured wells [C]// SPE Annual Technical Conference and Exhibition. Denver, USA: Society of Petroleum Engineers, 2003: 1-14.
[15] SHIH M Y, BLASINGAME T A. Decline curve analysis using type curves: horizontal wells [C]// The 1995 Joint Rocky Mountain Regional/Low Permeability Reservoirs Symposium. Denver, USA: Society of Petroleum Engineers, 1995: 1-11.
[16] CLARKSON C R, JORDAN C L, ILK D, BLASINGAME T A. Production data analysis of fractured and horizontal CBM wells [C]// The 2009 SPE Eastern Regional Meeting. Charleston, USA: Society of Petroleum Engineers, 2009: 1-30.
[17] ZAREENJAD M H, GHANAVATI M, ASL A K. Production data analysis of horizontal wells using vertical well decline models, a field case study of an oil field [J]. Petroleum Science and Technology, 2014, 32(4): 418-425.
[18] WANG Jun-lei, YAN Cun-zhang JIA Ai-lin, HE Dong-bo, WEI Yun-sheng, QI Ya-dong.. Rate decline analysis of multiple fractured horizontal well in shale reservoir with triple continuum [J]. Journal of Central South University, 2014, 7(21): 4320-4329.
[19] KETINENI S P. Analysis of production decline characteristics of a multi-stage hydraulically fractured horizontal well in a naturally fractured reservoir [D]. Pennsylvania, USA: Pennsylvania State University, 2012.
[20] NOBAKHT M, MATTAR L, MOGHADAM S, ANDERSON D M. Simplified yet rigorous forecasting of tight/shale gas production in linear flow [C]// The SPE Western Regional Meeting. Anaheim, California, USA, 2010: 1-7.
[21] NOBAKHT M, CLARJSON C R, KAVIANI D. New type curves for analyzing horizontal well with multiple fractures in shale gas reservoirs [J]. Journal of Natural Gas Science and Engineering, 2013, 10: 99-112.
[22] ZHAO G. A simplified engineering model integrated stimulated reservoir volume (SRV) and tight formation characterization with multistage fractured horizontal wells [C]// The SPE Canadian Unconventional Resources Conference. Calgary, Society of Petroleum Engineers, 2012: 1-18.
[23] OLORODE O M. Numerical modeling of fractured shale-gas and tight-gas reservoirs using unstructured grids [D]. Texas, USA: Texas A&M University, 2011.
[24] LI D, XU C, WANG J Y, LU D T. Effect of Knudsen diffusion and Langmuir adsorption on pressure transient response in tight-and shale-gas reservoirs [J]. Journal of Petroleum Science and Engineering, 2014, 124: 146-154.
[25] CHEN J, LI T, ZHANG Y. Application of the unstructured grids in the numerical simulation of fractured horizontal wells in ultra-low permeability gas reservoirs [J]. Journal of Natural Gas Science and Engineering, 2015, 22: 580-590.
[26] IMAM K. Evaluating hydraulic fracture properties using well test analysis on multi fractured horizontal wells [C]// The SPE/PAPG Annual Technical Conference. Islamabad, Society of Petroleum Engineers, 2013: 1-15.
[27] MLACNIK M J, DURLOFSKY L J. Unstructured grid optimization for improved monotonicity of discrete solutions of elliptic equations with highly anisotropic coefficients [J]. Journal of Computational Physics, 2006, 216(1): 337-361.
[28] ZHA Wen-shu, LI Dao-lun, LU De-tang, KONG Xian-hui. PEBI grid division in inter-well interference area [J]. Acta Petrolei Sinica, 2008, 29(5): 742-746. (in Chinese)
[29] FUNG L S K, HIEBERT A D, NGHIEM L X. Reservoir simulation with a control-volume finite-element method [J]. SPE Reservoir Engineering, 1992, 7(3): 349-357.
[30] CAO T, DUAN Y, WANG R, ZHANG L, FANG Q. Numerical simulation and production decline analysis of multiply fractured horizontal wells in shale gas reservoirs [J]. Journal of Engineering Research, 2015, 3(3): 157-177.
[31] SAAD Y, SCHULTZ M H. GMRES: A generalized minimal residual algorithm for solving non-symmetric linear systems [J]. Journal on Scientific and Statistical Computing, 1986, 7(3): 856-869.
(Edited by FANG Jing-hua)
Cite this article as: WEI Ming-qiang, DUAN Yong-gang, CHEN Wei, FANG Quan-tang, LI Zheng-lan, GUO Xi-ran. Blasingame production decline type curves for analysing a multi-fractured horizontal well in tight gas reservoirs [J]. Journal of Central South University, 2017, 24(2): 394-401. DOI: 10.1007/s11171-017-3441-4.
Foundation item: Project(2013CB228005) supported by the National Basic Research Program of China
Received date: 2015-08-24; Accepted date: 2015-12-25
Corresponding author: WEI Ming-qiang, PhD; Tel: +86-28-83037532; E-mail: weiqiang425@163.com

