J. Cent. South Univ. (2016) 23: 1058-1065
DOI: 10.1007/s11771-016-0355-x

Flotation of a new chelate collector on fine refractory iron ore-containing carbonate
WANG Ting-xia(����ϼ)1, ZHU Yi-min(��һ��)2, GUI Xia-hui(���Ļ�)1, 3
1. School of Chemical Engineering and Technology, China University of Mining and Technology,
Xuzhou 221116, China;
2. College of Resources and Civil Engineering, Northeastern University, Shenyang 110819, China;
3. Key Laboratory of Coal Processing and Efficient Utilization of Ministry of Education
(China University of Mining and Technology), Xuzhou 221116, China
 Central South University Press and Springer-Verlag Berlin Heidelberg 2016
Abstract: A suitable and efficient flotation collector at normal atmospheric temperature for Donganshan iron ore was developed. A new chelate collector W-2 was synthesized. At 30 ��C, condition flotation tests on mixed magnetic concentrate of Donganshan sintering plant established the best reagent system. With the optimum reagent system, one direct flotation and one reverse flotation including one roughing, one cleaning and two scavenging stages have been conducted. After closed-circuit flotation, excellent indices were obtained with grade of siderite concentrate of 36.49%, recovery rate of 10.65%, and loss on ignition of 11.17%, and the grade of hematite concentrate reached 66.27%, with recovery rate of 78.25%, tailing grade of 16.22%, and recovery rate of 11.10%. To analyze the mechanism of action from W-2 to quartz and siderite, zeta potential and FTIR spectra were detected. Results showed that after reaction with W-2, the zeta potential of quartz and siderite evidently changed, which resulted from hydrogen bond between quartz and W-2, and a certain chemical action between siderite and W-2. In addition, the electronegativity equalization principle was used to calculate electronegativity of active adsorption sites and analysis on reagent molecular structure showed that W-2 molecule had five active adsorption sites. Results showed that the electronegativity of atoms N and O in W-2 presented a substantial increase, and the synergy of atomic sites allowed considerable enhancement of collecting ability.
Key words: iron ore-containing carbonate; flotation; collector; hydrogen bonding; mechanism; electronegativity
1 Introduction
China is rich in iron ore resources, but with the extension of mining, ore grade decreases annually, and mineral processing becomes increasingly difficult. Of ores��s processing, the beneficiation of hematite maintains particularly prominent. In addition, hematite reverse is considerable. In proven iron ore types, sedimentary�C metamorphic iron ore deposits account for 60.50%, of which Anshan iron ore accounts for approximately 57.10% [1], thus, the sorting of Anshan hematite is a top priority [2].
The domestic beneficiation processing of hematite has matured gradually; however, simplying the transforming process for the sake of higher indexes of refractory hematite seems not feasible. Focusing on flotation reagents, for example, synthesizing new, low- temperature and environmentally safe flotation reagents is more efficient, and is expected to solve the sorting problem of poor hematite. Domestic hematite flotation reagents have been developed at an advanced level worldwide, and flotation reagents are replaced rapidly with a variety of new efficient flotation reagents successfully applied in the industry. For example,LIU [3] synthesized two new hematite reverse flotation desilication collectors, namely, N-dodecyl- ethylenediamine and N-dodecyl-1,3-propanediamine, and conducted a series of experiments to research hematite reverse flotation desilication system. The researcher obtained good indices with the concentrate grade of 66.78% and iron recovery of 75.71%.
Donganshan iron ore consists of a typical poor hematite containing carbonate ore, namely, siderite. Given that siderite and hematite present similar density and magnetic susceptibility, and considering that siderite turns into mud easily, these two ores cannot be effectively separated through high intensity magnetic separation or gravity concentration. Magnetic roasting is an efficient sorting method for siderite and hematite, but it consumes more energy and requires higher cost. Changsha Research Institute of Mining and Metallurgy summarized the previous research experience and drew a conclusion that to make a breakthrough on Donganshan beneficiation indicators, collector with strong clay- resistance, as well as good selectivity and collection must be developed. Only a breakthrough in reagents can lead to a stable flotation process and satisfactory production targets [4]. In response to these problems, a new chelate collector, W-2, is synthesized in this work. W-2 contains five adsorption sites, and can effectively collect siderite and quartz. In the step-by-step flotation, siderite, which seriously affects the flotation process, was separated first, and then quartz and hematite were separated, obtaining good indexes. The synthesis process of W-2 is simple, equipment investment is low, and the raw materials are widely available, making the process suitable for large- scale commercial production.
2 Experimental
2.1 Mineral sample
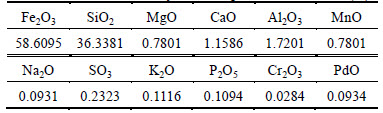
The ore sample was a hybrid magnetic concentrate obtained from Donganshan sintering plant. The ore presents a TFe grade of 46.15%, with a size distribution of less than 0.074 mm accounting for 92.11% and less than 0.037 mm at 63.51%. To further understand the nature of the ore sample, XRD diffraction analysis and XRF spectroscopy multi-element analysis was conducted, and the results are shown in Fig. 1 and Table 1.
Figure 1 and Table 1 show that the ore sample mainly contains quartz and hematite, and also contains acertain amount of siderite and magnetite, and a very small amount of aluminium oxide, calcium oxide and magnesium oxide, which indicates the existence of silicate mineral.
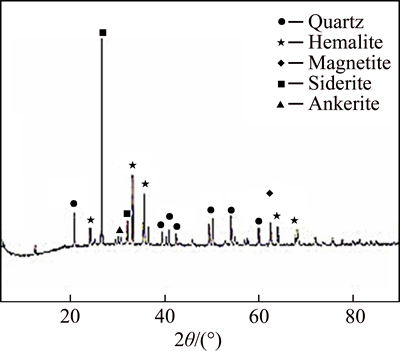
Fig. 1 XRD pattern of ore sample
Table 1 Multi-element analysis of sample in mass fraction (%)
2.2 Flotation reagents
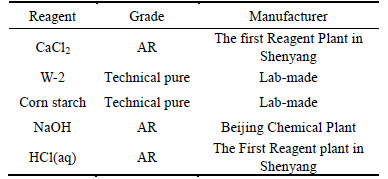
NaOH and HCl used to regulate pulp pH were of analytical grade. Collector was W-2, whereas the depressant was anionic starch, and both of them were laboratory-produced with concentration of 1% and were prepared anew before the use. The main chemical reagents in the experiment are listed in Table 2.
Table 2 Main chemical reagents in experiment
2.3 Experiment methods
2.3.1 Condition experiments
Condition experiments include direct flotation in the first step to select siderite and reverse flotation in the second step to collect quartz. Test temperature was 30 ��C; pH modifiers were NaOH and HCl; the depressor was corn starch; the activator was CaO; and the collector was W-2. Experiments were performed in single-factor method to explore the dosage of reagents one by one.
Direct flotation includes pH condition experiments, dosage of W-2 experiments and dosage of starch experiments. Reverse flotation includes pH condition experiments, dosage of starch experiments, dosage of W-2 experiments and dosage of CaO experiment.
2.3.2 Open-circuit experiments
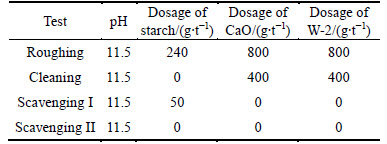
Experiments were conducted at 30 ��C and under the optimum conditions determined by condition experiments. Direct flotation was performed in the first step to select siderite, and reverse flotation followed to collect quartz. Direct flotation was completed first, and the reagent system is shown in Table 3. The first step was followed by reverse flotation, which includes one roughing, one cleaning, and two scavenging sections, and its reagent system is shown in Table 4.
Table 3 Reagents system of direct flotation in open-circuit flotation
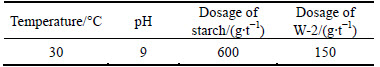
Table 4 Reagents system of reverse flotation in open-circuit flotation
2.3.3 Closed-circuit experiments
The experiment was as well repeated under the test optimum reagent system, and the experiment flow sheet is shown in Fig. 2.
Figure 2 shows a closed circuit, in which all intermediate products were input into the next operation according to the continuous production process of field production. In this experiment, each intermediate I was input into the next corresponding roughing operation, and middling II was input into the next corresponding scavenging step I.
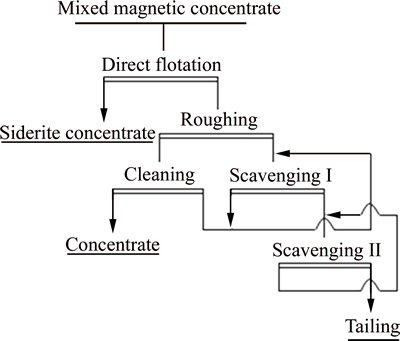
Fig. 2 Experimental flow sheet of closed-circuit flotation
2.4 Sample detecting
2.4.1 Zeta potential measurements
The adsorption of flotation reagents in the solid-liquid interface is frequently affected by mineral surfaces or exerts an impact on the electrical properties of the mineral surface [5]. Researching the changes in surface electrical behavior of minerals is an important method in studying the reaction mechanism between flotation reagents [6] and minerals, as well as in judging the floatability of minerals [7]. A micro-electrophoresis JC2000C1 was used in this test. The zeta potentials of quartz and siderite were measured, and the zeta potentials of quartz and siderite after reacting with W-2 were also detected.
2.4.2 Analysis and determination of FTIR
Infrared spectrophotometry or infrared spectroscopy uses infrared absorption spectra of the sample for qualitative analysis, quantitative analysis, and molecular structure determination [8]. Infrared spectrum presents evident characteristics, and no infrared spectrum is identical except for the optical isomers of two compounds [9]. In addition, infrared spectra are not restricted by the samples�� existence state, so gas, liquid, and solid samples can be measured. Fourier transform infrared (FTIR) also presents the advantages of faster analysis, less sample volume, and retention of sample quality, among others. To date, multiple infrared spectra of various types of substances have been systematically summarized and are available for inspection. Thus, infrared spectroscopy is widely used in the qualitative and structural analysis of organic compounds [10-11]. When using a continuous wavelength infrared light source illuminating the sample and due to the different degrees of absorption of material elements to different wavelengths of infrared light, radiation of certain wavelengths was weakened for the selective absorption by the sample selection. With wavelength (or wave number) as the abscissa, showing the position of the absorption peak, and with transmittance (or absorbance) as the ordinate, representing absorption intensity, the degree to which sample molecules absorb infrared light is recorded by the instrument. Thus, the infrared absorption spectrum of the sample is obtained. In this test, a 740-FTIR spectroscope was used to measure the infrared spectra of quartz, siderite, and W-2, and the infrared spectra of quartz and siderite that reacted with W-2 can also be measured.
3 Results
3.1 Results of condition experiments
Under the aforementioned conditions, pH condition tests, starch dosage experiments, dosage of starch experiments both in direct flotation and reverse flotation were conducted. In addition, the dosage of CaO experiments also was conducted, and the results show that, in direct flotation, at pH of 10, dosage of starch of 600 g/t, dosage of W-2 of 150 g/t, the grade and recovery rate of siderite concentrate reach the optimum, and in reverse flotation, at a pH of 11.5, dosage of starch of 240 g/t, dosage of CaO of 800g/t, dosage of W-2 of 800g/t, the grade and recovery rate of iron concentrate reach the best.
3.2 Results of open-circuit experiments
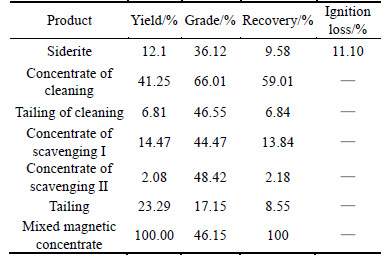
With the reagent system determined by condition experiments, the open-circuit experiment was conducted. The test results are shown in Table 5.
Table 5 shows that, after one direct flotation, siderite concentrate whose grade was 36.12%,ignition loss was 11.10% was obtained, and after one cleaning and two scavengings, hematite concentrate whose grade was 66.01%, and recovery rate was 59.01% was obtained.
Table 5 Results of opened-circuit flotation
3.3 Results of closed-circuit experiments
The test condition utilized the optimum reagent system determined by the open-circuit experiment. Referring to the continuous production process in the plant, the intermediate products were fed into the next appropriate process. The final results are shown in Table 6.
Table 6 Results of closed-circuit flotation
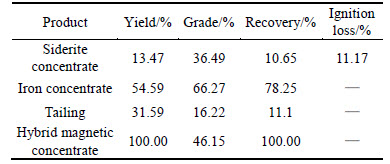
Table 6 shows that, compared with open-circuit experiment, closed-circuit experiment could achieve better results, grade of hematite concentrate was increased from 66.01% to 66.27% and recovery of hematite concentrate was increased from 59.01% to 78.25%.
3.4 FTIR spectra analysis
Infrared spectroscopies of collector W-2, of quartz before and after reaction with W-2, and of siderite before and after reaction with W-2 were conducted. The results are shown in Figs. 3-6.
Through analyzing the infrared spectrum of quartz, we can see that, the peak at 3428.76 cm�C1 was the ��OH stretching vibration of quartz, whereas those at 691.57, 774.88, and 792.73 cm�C1 were most reasonably attributed to (Si��O��Si) vibration mode. The peak at 456.53 cm�C1 was a strong absorption peak generally designated as O��Si��O bending vibration, whereas 1081.32 cm�C1 was the stretching vibration absorption peak of Si��O.
Under the conditions of pH=11 and concentration of collector W-2 of 583.33 mg/t, the infrared spectrum of quartz reaction with W-2 was detected, and the result is shown in Fig. 4.
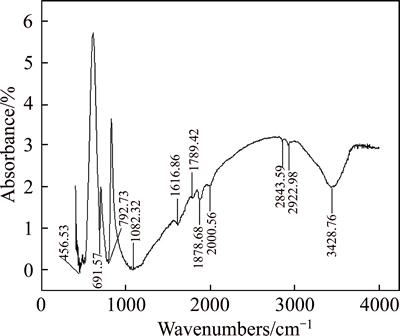
Fig. 3 FTIR spectrum of quartz
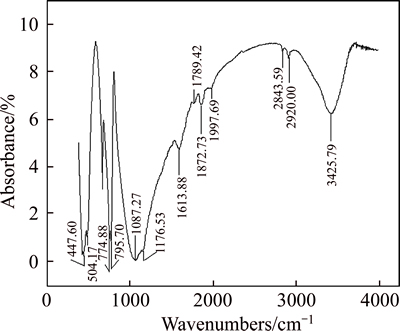
Fig. 4 FTIR spectrum of quartz after interaction with W-2
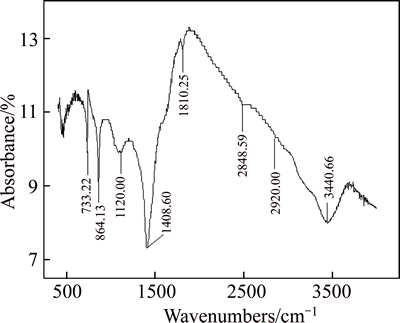
Fig. 5 FTIR spectrum of siderite
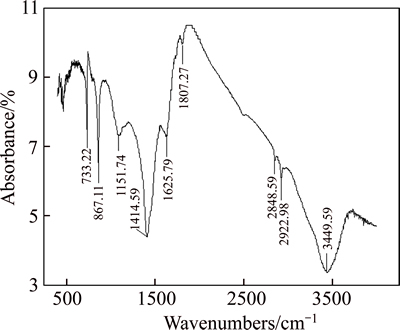
Fig. 6 FTIR spectrum of siderite after interaction with W-2
The strong absorption peaks in the infrared spectrum of quartz disposed by collector W-2 solution show that:
1) After reacting with collector W-2, ��OH stretching vibration of quartz moved to a lower wave number from 3428.76 cm�C1 to 3425.79 cm�C1, which was the result of hydrogen bonding.
2) Stretching vibration absorption peaks of ��CH2�� and ��CH3 respectively appeared at 2920.00 and 2843.59 cm�C1, which is attributed to the adsorption between W-2 and quartz.
3) After reacting with W-2, quartz bands appearing in 1613.88 cm�C1 were evidently wider than those at 1616.86 cm�C1, which was due to the fact that the ��NH2 bending vibration of W-2 at 1643.64 cm�C1 moved to a lower wave number. This result indicates the occurrence of adsorption of hydrogen bonds between ��NH2 and quartz.
The infrared spectra of siderite told us that 1408.60 cm�C1 was the Fe��O asymmetric stretching vibration absorption peak of siderite. At this time, absorption was the strongest and was the characteristic absorption peak of siderite, 864.13 cm�C1 corresponded to the outer bending vibration absorption peak of Fe��O, and 733.22 cm�C1 was the inner bending vibration absorption peak of Fe��O.
Under the conditions of pH=10 and W-2 concentration of 500 mg/t, the infrared spectrum of the siderite reaction with W-2 was detected, and result is shown in Fig. 6.
Those strong absorption peaks in the infrared spectrum show that, after reacting with W-2, the siderite Fe��O asymmetric stretching vibration absorption peak increased from 1408.60 cm�C1 to 1414.55 cm�C1, the outer bending vibration absorption peak of Fe��O increased from 864.13 cm�C1 to 867.11 cm�C1, and inner bending vibration absorption peak of Fe��O remained unchanged. These changes illustrate that collector W-2 exerted a certain chemical action on siderite.
Comparing the infrared spectra of quartz and quartz disposed by W-2, as well as the spectra of siderite and siderite disposed by W-2, we can see the results after reaction with collector W-2, whose infrared spectrum changed significantly. This change indicates that hydrogen bonding occurred between the W-2 molecule and quartz surface, and that W-2 molecules exert a certain chemistry on the surface of siderite.
3.5 Zeta potential measurement
The surface zeta potentials of quartz and siderite in water and in the collector solution were measured by a micro-electrophoresis JC2000C1 equipment. The zeta potential changes of minerals before and after the addition of W-2 could reflect the action characteristics [12] of W-2 on minerals. Results are shown in Figs. 7 and 8.
As can be seen from Figs 7 and 8, quartz and siderite after reaction with collector W-2 exhibited significantly changes in their zeta potentials, which resulted from adsorption occurring on the mineral surface.
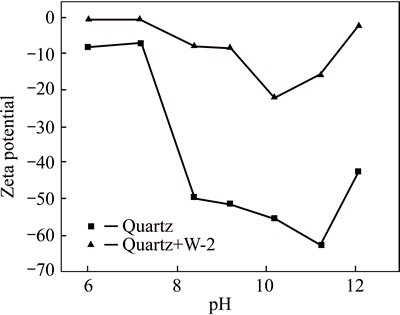
Fig. 7 Relationship between zeta potential and pH for quartz
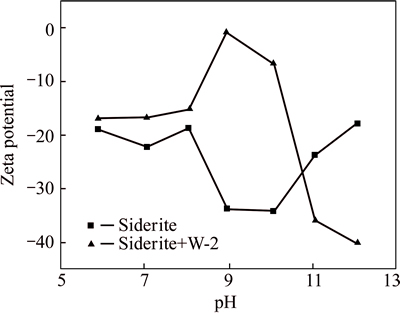
Fig. 8 Relationship between zeta potential and pH for siderite
4 Discussion
4.1 Molecular structure of collector, W-2
The collector, W-2, contains R group, nitrogen atoms, and ��COO- groups. The R group is an aliphatic group with 10 or more carbon atoms. If the number of carbon atoms in R is too small, the carbon chain is too short, a poor collecting ability will be resulted in. Both the double-bonded and the single-bonded oxygen atoms in carboxyl, which possessed lone pairs of electrons, present extremely strong collection activity, because the group contains one pair of electrons. In addition, the nitrogen atom also presents activity on minerals. Moreover, in strong alkaline conditions, a single-bond oxygen atom possesses a single electron that has a tendency to form a bond, and chemical adsorption tends to occur.
4.2 Electronegativity calculation of active adsorption sites in W-2 collector
We use the principle of electronegativity equalization [13], employing the method of progressive increase and sharing [14] to calculate atomic electronegativity. Assuming the atomic structure shown in Fig. 9, the dotted vertical line is the hierarchical line of each atom. The number underneath the dotted line shows the layered line number, as represented by i, with a value of 1, 2, ��, k. We call k (i take max) as the series. The right subscript is the atom number in the layer, as represented by l, with the value of 1, 2, 3, ��. In calculation, the atom to the left of the hierarchical line (called the base atom) is in equilibrium with the atom to the right side, which is directly attached to the base. The electronegativity of the base atom equals the adduct average value of the Pauling electronegativity of this base atom and that of the atom who attached to the base atom [15].
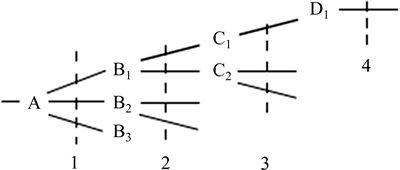
Fig. 9 Schematic diagram of electronegativity equalization
Various electronegativity values can be obtained through equalization:
The first level:

The second level:

��
The kth levels:

The following can be obtained through stepwise substitution:


where n1l, n2l, ��, nkl represent the average number of units of the ith base atom in the first, second, to the kth layer, i.e., the number of the base atoms and the atomsdirectly attached to the base; represent the electronegativity adduct values of the base atoms and the atoms directly attaches to the base atom in the first, second, to the kth layer [16].
The following results can be obtained by using the above method of calculation.
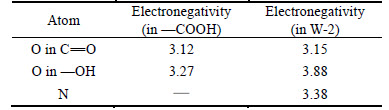
Table 7 shows that, in the collector W-2, the electronegativity of O atoms in ��COOH is enhanced. Meanwhile, W-2 possesses a highly electronegative N, so that the collecting capacity of the collector was enhanced.
Table 7 Electronegativity of every active adsorption site
4.3 Chelation analysis of collector W-2 to quartz
Quartz is the most typical mineral with a frame structure (strictly speaking, an oxide). A variety of studies reported that the zero potential point of quartz is about 2.0 [17]. In the quartz structure, the binding force between silicon and oxide performs a key function. Each silicon ion is surrounded by four oxygen ions, and those oxygen ions are distributed in the four vertices of the tetrahedron to form silicon�Coxygen tetrahedra [SiO4]4-. Each O2�C situated in the angular point of [SiO4]4- tetrahedra is shared by the neighboring [SiO4]4- tetrahedra, thus forming an infinite dimensional space frame-like structure. The silicon atom in this structure with the surrounding four oxygen atoms is combined through atomic bonding, of which 60% are covalent bonds, 40% are ionic, and the bond strengths toward each direction are equal. Thus, a large number of broken Si��O bonds appear when an external force is applied to quartz, and a large number of Sin+ (n=0 to 4) and On�C (n= 0 to 2) [18] is exposed on the mineral surface.
When quartz is crushed or ground, cracking inevitably occurs along Si��O bonds because the lack of fragile interface layers in the crystal. The fracture process is shown in Fig. 10.
Numerous Si+ is exposed when quartz is cracked or grounded, chelation occurs between quartz with multiple Si+ and collector W-2 with ��COO�C to form chelates, and quartz is concentrated.
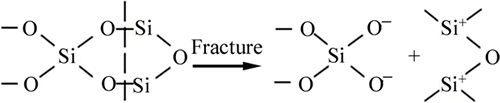
Fig. 10 Lattice fracture of quartz
4.4 Interaction analysis of collector W-2 to siderite
Mineral particle surface produced by crushing or grinding possesses a certain ��surface energy�� [19], for which the bonding energy was marginally desaturated because the lattice was destroyed. This surface energy functions decisively in the reaction between all molecules, ions, or gases. The attractive forces of atoms, molecules, or ions on the mineral particle surface and properties of bonding energy, etc., depend on the internal structure and structural characteristics of the fracture surface [20].
Materials for flotation are mostly processed through crushing and grinding. Particles often fracture along their fragile plane (such as cracks, dissociation planes, or impurity regions between lattices), or fracture along areas of high stress concentration. The fracture of ionic lattice generally occurs along the interfaces between ions, and the same number of cations and anions are distributed on the dissociation surface [21]. Although siderite belongs to ionic lattice minerals, its lattice contains  The C��O bond in
  of siderite does not fracture owing to its strong covalence. When destroyed by external force, the siderite lattice fractures along the interface of and Fe2+, as the dotted line shown in Fig. 11 [22]. After the interface, bare Fe2+ reacted with ��COO�C in W-2, and then separation finished.
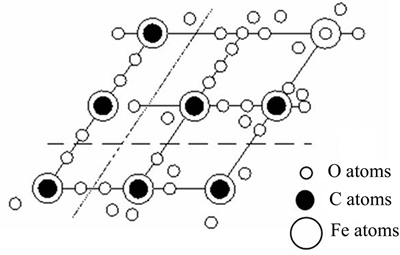
Fig. 11 Lattice fracture of siderite
5 Conclusions
1) XRD diffraction analysis and multi-element analysis are conducted on Donganshan mixed magnetic concentrate. Results show that SiO2 and Fe2O3 are the main components. The content of TFe is 46.15%, whereas that of SiO2 is 36.34%.
2) Zeta potential measurements and infrared spectroscopy are conducted to study the action mechanism of W-2 with quartz and siderite. Results of zeta potential test tell us that the zeta potential of quartz and siderite in the W-2 solution have significantly changed compared with quartz in pure water, indicating that W-2 is adsorbed on the quartz and siderite surface. Infrared spectra of quartz and siderite after reaction with W-2 show that hydrogen bonding interactions occur between W-2 molecules and quartz surface, and W-2 molecules exerted a certain chemical action on the surface of siderite.
3) Five active adsorption sites exist in the W-2 molecule, and the synergy of the active site atoms significantly enhances the collection ability of W-2. In addition, chelation occurred between W-2 and quartz, which ultimately strengthened the collecting capacity of W-2.
References
[1] LI Yan-jun, YANG Guang, ZHAO Rui-chao. Feature of refractory iron ore containing siderite and its research trends of beneficiation technology [J]. Multipurpose Utilization of Mineral Resources, 2015(2): 12-14.
[2] TANG Xue-feng. Research status and development trend of beneficiation technology on complex hematite [J]. Express Information of MiningIndustry, 2014, 30(3): 14-16.
[3] LIU Wen-gang. Synthesis and flotation performance of new collectors in reverse flotation of hematite [D]. Shenyang: NortheasternUniversity, 2012. (in Chinese)
[4] YAN Zan, LI Li-xia, YUAN Zhi-tao. Status and trends of processing technology of carbonate-containing iron ore [J]. Conservation and Utilization of Mineral Resources, 2015(1): 69-71. (in Chinese)
[5] CARLSON J J, KAWATRA S K. Factors affectingzeta potentialof iron oxides [J]. Mineral Processing and Extractive Metallurgy Review,2013, 34(5): 281-284.
[6] SAVAS K, CEMAL K. A new equation based on ionization energies and electron affinities of atoms for calculating of group electronegativity [J]. Computational and Theoretical Chemistry, 2015(1): 44-46.
[7] HASELHUHN H J, HOWARD J.Water chemistry effects on thezeta potentialof concentrated hematite ore [J].Minerals and Metallurgical Processing,2012, 29(2): 135-136.
[8] CHIA C H, GONG B, JOSEPH S D, MARJOB C E, MUNROEA P, RICH A M. Imaging of mineral-enriched biochar byFTIR, Raman and SEM-EDX [J]. Vibrational Spectroscopy,2012, 62(9): 248-257.
[9] XIONGYing. Principle and applications of near infrared (NIR) spectroscopy [J]. Journal of Sun Yat-Sen University: Natural Sciences, Medicine, 2013, 34(2): 16-30.
[10] LIUFa-long, MAXin-gang, CHENGFu-yin. Application of near-infrared spectroscopyanalytical technique inrapidanalysis [J]. Analysis and Testing Technology and Instruments, 2008, 14(4): 241- 247.
[11] SHAOXue-guang, NINGYu, LIU Feng-xia,LI Ji-hui, CAI Wen- sheng. Application of near-infrared-spectroscopy in micro inorganic analysis [J]. Acta Chimica Sinica, 2012, 70(20): 2109-2114. (in Chinese)
[12] LIU Yan-ju,RAVENDRA N, MING Hui. Surface electrochemical properties of red mud (bauxite residue):Zeta potentialand surface charge density [J].Journal of Colloid and Interface Science,2013, 394(1): 451-453.
[13] WANG Chang-sheng, ZHAO Dong-xia, YANG Zhong-zhi. Calculation of the linear response function by the atom-bond electronegativity equalization method [J]. Chemical Physics Letters, 2000, 330(1/2): 132-134.
[14] YANG Zhong-zhi. Electronegativity equalization [J]. Progress in Chemistry, 2012, 24(6): 1038-1049.
[15] DAIYi-min, NIEChang-ming. Revised formula for gradual sum even way to calculate group electronegativity [J]. Journal of Nanhua University: ScienceandTechnology, 2007, 21(2): 65-66. (in Chinese)
[16] LEYSSENS T, GEERLINGS P, PEETERS D. A group electronegativity equalization scheme including external potential effects [J]. Journal of Physical Chemistry A, 2006, 110(28): 2-9.
[17] FUERSTENAU D W, Pradip. Zeta potentials in the flotation of oxide and silicateminerals [J]. Advances in Colloid and Interface Science,2005, 114/115(6): 9-26.
[18] ZHU Yi-min, HAN Yue-xin. Application of crystal chemistry in mineral materials [M]. Beijing: Metallurgical Industry Press, 2007: 122-150. (in Chinese)
[19] KITAMURA K. Cracksurface energy: Temperature and force dependence [J].Materials Transactions,2008, 49(3):3-9.
[20] RUSSELL A R, EINAV I R.Energydissipation from particulate systems undergoing a single particlecrushing event [J]. Granular Matter,2013, 15(3): 299-314.
[21] QUINTANA-ALONSO I, MAI S P, FLECK N A. The fracture toughness of a cordierite squarelattice [J]. Acta Materialia,2010, 58(1): 201-207.
[22] ZHU Yi-min, HAN Yue-xin. Application of crystal chemistry in mineral materials [M]. Beijing: Metallurgical Industry Press, 2007: 408-415. (in Chinese)
(Edited by YANG Hua)
Foundation item: Project(2015XKMS095) supported by the Fundamental Research Funds for the Central Universities, China; Project(51574236) supported by the National Nature Science Foundation of China
Received date: 2015-05-11; Accepted date: 2016-03-17
Corresponding author: GUI Xia-hui, Associate Professor, PhD; Tel: +86-13775989229; E-mail: guixiahui1985@163.com

