J. Cent. South Univ. Technol. (2007)03-0418-07
DOI: 10.1007/s11771-007-0082-4

Effect of pore pressure on deformation and unstable snap-back for
shear band and elastic rock system
WANG Xue-bin(王学滨)
(Department of Mechanics and Engineering Sciences, Liaoning Technical University, Fuxin 123000, China)
Abstract: Fast Lagrangian analysis of continua(FLAC) was used to study the influence of pore pressure on the mechanical behavior of rock specimen in plane strain direct shear, the distribution of yielded elements, the distribution of displacement and velocity across shear band as well as the snap-back (elastic rebound) instability. The effective stress law was used to represent the weakening of rock containing pore fluid under pressure. Numerical results show that rock specimen becomes soft (lower strength and hardening modulus) as pore pressure increases, leading to higher displacement skip across shear band. Higher pore pressure results in larger area of plastic zone, higher concentration of shear strain, more apparent precursor to snap-back (unstable failure) and slower snap-back. For higher pore pressure, the formation of shear band-elastic body system and the snap-back are earlier; the distance of snap-back decreases; the capacity of snap-back decreases, leading to lower elastic strain energy liberated beyond the instability and lower earthquake or rockburst magnitude. In the process of snap-back, the velocity skip across shear band is lower for rock specimen at higher pore pressure, showing the slower velocity of snap-back.
Key words: pore pressure; shear band; snap-back; strain-softening; unstable failure; stress-strain curve
1 Introduction
Fluids play an important role in some seriously natural hazards, such as reservoir-induced earthquake, landslide, liquefaction and gas outburst. In areas where potentially active faults are already close to failure, the increased pore pressure resulting from fluid injection or, alternatively, the massive extraction of fluid or gas, can induce sufficient stress and/or strain changes that, with time, can lead to sudden catastrophic failure in a major earthquake[1]. Injection-induced earthquakes typically result from the reduction in frictional strength along preexisting faults. For overconsolidated clays, earthquake loading can generate significant excess pore water pressures at depth, which can bring the slope to a state of instability during the event or at a later time as a result of pore pressure redistribution within the soil profile[2]. Liquefaction is a result of increased pore pressure which decreases effective stress.
Criterion of snap-back and unstable condition of the system composed of shear band and elastic body in uniaxial compression and direct shear was presented by WANG and coworkers[3-6] using displacement method, energy principle and stiffness ratio theory. The width of shear band and the distribution of plastic shear strain in the band were described by gradient-dependent plasticity. Effects of water weakening and strain gradient on the distributions of plastic shear strain and deformation in shear band and on the stability of direct shear rock specimen were investigated[7].
In theoretical analyses by WANG et al[3-7], shear band was treated as a one-dimensional problem for the sake of simplicity for analytical derivations and the effect of pore pressure on deformation, failure and stability of rock structure was not taken into account. On the aspect of theoretical analysis, it is difficult to consider the effect of pore pressure. Numerical simulation can overcome the shortcoming of theoretical analysis.
FLAC is an explicit finite-difference code that can effectively model the behaviors of geomaterials, undergoing plastic flow as their yield limits are reached. Compared with the conventional finite-element methods, FLAC has some marked advantages: the plastic flow is accurately modeled because “mixed discretization” scheme is adopted; the physically unstable processes and strain localization are simulated without numerical distress partly due to the use of full dynamic equations of motion; and the nonlinear constitutive relations are solved numerically using an explicit finite difference approach so that no any matrices need to be saved.
For rock specimen in plane strain direct shear, the processes of deformation and failure[8], the shear stress distribution and evolution as well as the deformational characteristic[9], the effect of strain rate (or loading velocity) on the deformation, failure and unstable snap-back[10] and the influence of shear dilatancy on deformation and failure[11] were numerically studied using FLAC. In this paper, FLAC was used to study the influence of pore pressure on the mechanical behavior of rock specimen in plane strain direct shear, the distribution of yielded elements, the distribution of displacement and velocity across shear band as well as the snap-back instability.
2 Constitutive relation and model
The model geometry and boundary conditions are shown in Fig.1(a). The height and width of rock specimen are 0.10 m and 0.05 m, respectively. At the left and right boundaries, the horizontal displacement boundaries fix the horizontal freedom. On the left side of the top of specimen, the horizontal and vertical freedoms are fixed. The specimen in plane strain condition is loaded at a constant velocity of v=1.2×10⁻⁸ m/timestep on the right side of the base of specimen. The horizontal freedoms are fixed on the right side of the base of specimen. The numerical computation is in small-strain mode.
In elastic stage, the constitutive relation is linear elasticity. Shear and bulk moduli are 11 GPa and 15 GPa, respectively. The adopted failure criterion is a composite Mohr-Coulomb criterion with tension cut-off and the tension strength is 0.2 MPa. Beyond the yield strength, a linear strain-softening relation is selected and the variation of cohesion and friction angle with plastic strain is shown in Fig.1(b) and (c). Four schemes for calculations are adopted in this paper. From scheme 1 to 4, pore pressure is 0, 0.05, 0.10 and 0.15 MPa.
Rock generally appears weaker when the pore spaces contain a pore fluid under pressure, which is represented in FLAC by the incorporation of an effective stress that accounts for the presence of pore pressure in a zone. The pore pressures in FLAC are taken to be positive in compression. Thus, the effective stress σ′ (negative in compression) is related to the total stress σ and the pore pressure p by
σ′=σ+p (1)
In each scheme, all elements have the same pore pressure remaining a constant. Moreover, the fluid does not flow. That is to say, the present numerical predictions are more applicable to rapid or dynamic test.
3 Results and discussion
3.1 Effect of pore pressure on stress-displacement curve
Fig.2 shows the effect of pore pressure on the average compressive stress-displacement curve at loading end.
For dry rock (without pore pressure), the maximum peak stress is expected. Prior to the peak, the stress- displacement curve is the steepest and the hardening modulus is the highest. For higher pore pressure, the peak stress is lower; prior to the peak, the stress- displacement
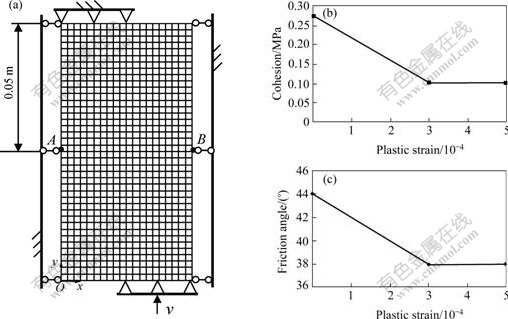
Fig.1 Model geometry, boundary conditions(a) and strain-softening constitutive relation between plastic strain, cohesion(b) and friction angle(c)
curve is less steep; the hardening modulus is lower. These numerical results reflect that higher pore pressure leads to softer rock prior to the peak and lower strength.

Fig.2 Numerical stress-displacement curves for different pore pressures
As mentioned above, the stress-displacement curve prior to the peak stress is dependent on pore pressure. Similarly, the softening branch of the curve is also affected by pore pressure. Slightly beyond the peak stress, the softening curve becomes steeper as pore pressure increases.
3.2 Effect of pore pressure on distribution of plastic zone
Fig.3 shows the influence of pore pressure on the distribution of yielded elements when a longer plastic zone just bisects the specimen. Black elements mean that these elements have yielded, while white elements always remain elastic state.
Fig.4 shows the distribution of yielded elements for different pore pressures when 1500 timesteps are consumed.
With an increase of pore pressure, the number of

Fig.3 Plastic zones distribution when a longer shear band bisects specimen for different pore pressures
(a) 0 MPa; (b) 0.05 MPa; (c) 0.10 MPa; (d) 0.15 MPa

Fig.4 Plastic zones distribution when 1 500 timesteps are consumed for different pore pressures
(a) 0 MPa; (b) 0.05 MPa; (c) 0.10 MPa; (d) 0.15 MPa
yielded elements increases. This reflects that the failure of rock specimen without fluid is even more localized (namely, smaller area of plastic zone). Otherwise, for higher pore pressure, the failure zone of rock specimen will be extensive.
In Figs.3 and 4, we have not distinguished the tensile plastic zone from the shear plastic zone. It is found from numerical calculations that the plastic zone in shear is mainly located at the position of shear band, while the plastic zone in tension lies in the top right corner and base left corner of the specimen.
The numerical results show that higher pore pressure increases the number of yielded elements in tension. This present numerical results agree with the previously numerical results[12], showing that specimen tends to fail in tension at higher pore pressure in plane strain compression.
The consumed timesteps from scheme 1 to 4 are 780, 680, 600 and 540, respectively. Therefore, the increased pore pressure results in earlier occurrence of longer shear band intersecting the specimen.
3.3 Effect of pore pressure on distribution of vertical displacement across shear band
Fig.5 shows the distribution of vertical displacements of 21 nodes in straight line AB(see Fig.1(a)), for different pore pressures.

Fig.5 Vertical displacements of 21 nodes in x-axis for different pore pressures when different timesteps are consumed
(a) 500 timesteps; (b) 1 000 timesteps
Outside shear band, the vertical displacement is approximately linear distribution. The displacement gradient in shear band is obviously higher than those outside the band.
The relative displacement between the right side and the left side of shear band is higher for higher pore pressure. Moreover, the displacement gradient in shear band increases with pore pressure increasing.
3.4 Effect of pore pressure on distance of snap-back
Fig.6 shows the evolution of vertical displacement at point A, see Fig.1(a), with timestep.
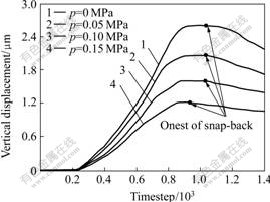
Fig.6 Change in vertical displacement of node A with timestep for different pore pressures
The monitored vertical displacement is firstly increased with timestep. Then, it remains a constant. The phenomenon is similar to the silent anomaly prior to earthquake. Next, the displacement decreases. This means that snap-back of the specimen has occurred.
In rock mechanics, snap-back is also called Class II behavior. The behavior is referred to the decrease of strain or deformation in strain-softening stage with the decrease of load-carrying capacity of rock specimen in uniaxial compression. On the aspect of theoretical analysis, WANG and coworkers[5-6] verified that the snap-back condition of the system composed of shear band and elastic rock outside the band was equivalent to the unstable criterion. Therefore, we can believe that once snap-back occurs, then rock structure will lose its stability. In fact, REID in 1910 has proposed a famous “elastic rebound theory” of earthquake faulting based on field observations of the San Francisco earthquake in 1906. The phenomenon has been observed in some earthquakes[13-16].
When snap-back just occurs, timesteps from scheme 1 to 4 are 1 100, 1 040, 1 040 and 960, respectively. Therefore, lower timesteps are needed for snap-back of rock specimen at higher pore pressure. That is to say, with an increase of pore pressure, snap-back (or unstable failure) will occur earlier. The present numerical result supports the previous viewpoint showing that the action of water advances earthquake[17].
For higher pore pressure, the distance from the beginning to the end of snap-back is lower, which is similar to the previous result[17]. This is due to the fact that less elastic strain energy is accumulated in rock with a higher pore pressure owing to the dissipation of pore fluid. Therefore, the worse capacity of snap-back is expected for rock structure at higher pore pressure. Through snap-back occurring at higher pore pressure, the liberated elastic strain energy will be lower, leading to lower magnitude of earthquake or rockburst.
3.5 Effect of pore pressure on distribution of vertical velocity across shear band
Fig.7 shows the distribution of vertical velocities of 21 nodes in straight line AB for different pore pressures.
On the left side of shear band, the distribution of velocity is relatively uniform. At the position of shear band, the skip of velocity occurs. The velocity on the right side of the band is always positive, meaning that the rock on the right side of the band moves upward. However, when timesteps exceed a certain value, the velocity on the left side of shear band becomes negative value, reflecting the downward movement (reverse movement, i.e. snap-back) of surrounding rock on the left side of the band.
Prior to snap-back, the velocity gradient in shear band is higher for higher pore pressure, see Fig.7(a). However, in the process of snap-back, it decreases to a lower value. That is to say, rock specimen without pore fluid can snap back fast.
3.6 Effect of pore pressure on precursor of snap-back
Fig.8 shows the three-dimensional distribution of shear strain increment when the specimen snaps back for different pore pressures. The x-axis and y-axis are horizontal and vertical, respectively, as depicted in Fig.1(a). The original point O is in the lower left-hand of the specimen.
Before snapping back, considerable shear strains are concentrated in shear band. The phenomenon can be seen as a kind of precursors to snap-back (or unstable failure).
For rock specimen with zero pore pressure, the lowest magnitude of shear strain increment is found. Thus, the precursor to snap-back is the least apparent for dry rock specimen.

Fig.7 Vertical velocities of 21 nodes in x-axis for different pore pressures when different timesteps are consumed
(a) 500 timesteps ; (b) 1 000 timesteps; (c) 1 200 timesteps; (d) 1 300 timesteps

Fig.8 Numerical three-dimensional distribution of shear strain increment before snapping back for different pore pressures
(a) 0 MPa; (b) 0.05 MPa; (c) 0.10 MPa; (d) 0.15 MPa
4 Conclusions
1) With an increase of pore pressure, rock specimen becomes softer; lower hardening modulus and lower strength are observed. Slightly beyond the peak stress, the monitored average compressive stress-displacement curve at loading end becomes steeper as pore pressure increases. The number of yielded elements increases with the increase of pore pressure. The failure of dry rock is even more localized.
2) The concentration of shear strain in shear band before snapping back can be considered to be a kind of precursors to unstable failure. Higher pore pressure leads to higher shear strain increment so that the precursor is more apparent. The conclusion is also coincident with the present observation showing that snap-back is slower for rock specimen subjected to higher pore pressure.
3) As pore pressure increases, the relative vertical displacement across shear band increases; the displacement gradient in shear band is also elevated. Higher pore pressure leads to earlier occurrence of a long shear band bisecting the specimen and earlier occurrence of snap-back (unstable failure). Moreover, the distance of snap-back and the liberated elastic strain energy as well as the magnitude of earthquake or rockburst decrease as pore pressure increases.
4) As the position of shear band, the skip of velocity is found. The monitored negative velocity on the left side of shear band denotes the occurrence of snap-back of the specimen. In the process of snap-back, the velocity gradient in shear band becomes lower if pore pressure is higher, showing that snap-back is slower at higher pore pressure.
References
[1] NICHOLSON C, WESSON R L. Triggered earthquakes and deep-well activities[J]. Pure and Applied Geophysics, 1992, 139 (3/4): 561-578.
[2] BISCONTIN G, PESTANA J M, NADIM F. Seismic triggering of submarine slides in soft cohesive soil deposits[J]. Marine Geology, 2004, 203 (3/4): 341-354.
[3] WANG Xue-bin, YANG Xiao-bin, ZHANG Zhi-hui, et al. Dynamic analysis of fault rockburst based on gradient-dependent plasticity and energy criterion[J]. J Univ Sci Technol Beijing, 2004, 11(1): 5-9.
[4] WANG Xue-bin, DAI Shu-hong, HAI Long. Quantitative calculation of dissipated energy of fault rock burst based on gradient-dependent plasticity[J]. J Univ Sci Tech Beijing, 2004, 11(3): 197-201.
[5] WANG Xue-bin, PAN Yi-shan, HAI Long. Instability criterion of fault rock burst based on gradient-dependent plasticity[J]. Chinese Journal of Rock Mechanics and Engineering, 2004, 23(4): 588-591. (in Chinese)
[6] WANG Xue-bin, HUANG Mei, ZHAO Yang-feng, et al. Analysis on relation between snap-back of specimen and snap-back of system composed of direct shear testing machine and specimen[J]. Chinese Journal of Rock Mechanics and Engineering, 2004, 23(3): 379-382. (in Chinese)
[7] WANG Xue-bin, SONG Wei-yuan, HUANG Mei, et al. Analysis on fault rockburst considering effects of water weakening and strain gradient[J]. Chinese Journal of Rock Mechanics and Engineering, 2004, 23(11): 1815-1818. (in Chinese)
[8] WANG Xue-bin. Strain localization of rock failure and instability criterion of rockburst[C]// WANG Ya-jun et al, ed. Progress in Safety Science and Technology. Beijing: Science Press, 2004, IV: 244-249.
[9] WANG Xue-bin. Shear stress distribution and characteristics of deformation for shear band-elastic body system at pre-peak and post-peak[J]. J Cent South Univ Technol, 2005, 12(5): 611-617.
[10] WANG Xue-bin. Numerical simulation of influence of loading rate on deformation characteristics and snap-back for fault band and elastic rock system[J]. Rock and Soil Mechanics, 2006, 27(2): 242-247. (in Chinese)
[11] WANG Xue-bin. Numerical simulation of influence of shear dilatancy on deformation characteristics of shear band-elastic body system[J]. J Coal Sci Engng, 2004, 10(2): 1-6. (in Chinese)
[12] WANG Xue-bin, PAN Yi-shan, DING Xiu-li, et al. Study on effect of pore pressure on strain localization of rock and numerical simulation[J]. Journal of Geomechanics, 2001, 7(2):139-143. (in Chinese)
[13] TANG Chun-an, FU Yu-fang, ZHAO Wen. A new approach to numerical simulation of source development of earthquake[J]. Acta Seismologica Sinica, 1997, 10(4): 425-434.
[14] LIN Peng, TANG Chun-an, CHEN Zhong-hui, et al. Numerical and experimental study of deformation and failure behavior in a double rock specimen system[J]. Earthquake, 1999, 19(4): 413-418. (in Chinese)
[15] MAYER L, LU Z. Elastic rebound following the Kocaeli earthquake, Turkey, recorded using synthetic aperture radar interferometry[J]. Geology, 2001, 29(6): 495-498.
[16] JOHNSON A M, JOHNSON K M, DURDELLA J, et al. An emendation of elastic rebound theory: Main rupture and adjacent belt of right-lateral distortion detected by Viaduct at Kaynasli, Turkey 12 November 1999 Duzce Earthquake[J]. Journal of Seismology, 2002, 6(3): 329-346.
[17] YIN You-quan, DU Jing. A swallow-tail type catastrophic model of earthquake process [J]. Acta Seismological Sinica, 1994, 16(4): 521-528.
(Edited by YUAN Sai-qian)
Foundation item: Project(50309004) supported by the National Natural Science Foundation of China
Received date: 2006-08-15; Accepted date: 2006-12-28
Corresponding author: WANG Xue-bin, PhD; Tel: +86-418-3351351; E-mail: wxbbb@263.net

