Trans. Nonferrous Met. Soc. China 22(2012) s831-s837
FEA technique of hot plate forming process using cell-typed die with cooling device
Jung-Min LEE1, In-Kyu LEE2, Kyung-Hun LEE2, Dae-Soon KIM3, Byung-Min KIM2
1. Dongnam Regional Division, Korea Institute of Industrial Technology, Busan 618-230, Korea;
2. School of Mechanical Engineering, Pusan National University, Busan 609-735, Korea;
3. Industrial Technology Division, Hyundai Heavy Industries, Ulsan 682-792, Korea
Received 21 May 2012; accepted 5 November 2012
Abstract: Hot plate forming using a cell-typed die is a process for forming a large thick plate with a spherical shape for the manufacture of a large spherical LNG tank. Cell-typed upper and lower dies made of a framework of steel plates fitted to make a grid pattern are used in this process, and an air-cooling device is separately installed inside the lower die. A finite element analysis (FEA) technique was developed, which included hot forming, air flow, cooling and thermal deformation analysis for the hot plate forming process using the cell-typed die. Further, the convective and interface heat transfer coefficients were used to reproduce analytically the effects of the cooling device in the hot plate forming analysis. A small-scale model test of the process was conducted to verify the FEA technique. The analysis results show that the curvature of the final plate agrees well with that of the designed experiment within a maximum relative error of 0.03% at the corner of the plate.
Key words: cell-typed die; hot plate forming; spherical LNG tank; heat transfer coefficient
1 Introduction
A spherical-surface of large thick plates for the manufacture of liquefied natural gas (LNG) tanks was typically achieved by cold forming, a multistage press bending method, by punch and die. However, since the demand for large LNG tanks (e.g., diameter higher than 50 m) was recently increased, the low productivity of this technique became a serious issue when manufacturing large thick plates. The standard thick plates are about 12 m in length and 4 m in width with a maximum thickness of 70 mm, and they are the largest commercially available standard plates. Manufacture of spherical thick plates by cold forming typically takes about 10 h, and approximately 100% of the curved plate is required to produce one spherical tank. Furthermore, considering the fact that there are five spherical tanks per LNG carrier, it is very costly and time-consuming to form the plates during carrier construction [1,2]. In addition, in practice, it is difficult to adapt a multipoint forming method, often employed in shipbuilding, to this process because the strength of its upper and lower dies is vulnerable to high load and mass production in forming curved plates.
To overcome these problems of cold forming, a hot plate forming process using upper and lower dies (Fig. 1) was recently developed. The process consists of feeding, heating, forming, cooling and unloading steps that are continuously performed along the rail designated to put the plate on the lower die [1]. The distinctive features of this process are as follows: 1) the cell-typed upper and lower dies that are constructed of a framework of steel plates fitted to make a grid-pattern, and 2) a separate cooling device with an air nozzle installed inside the lower die. An LNG tank is preferably made of an Al 5083 plate, which is resistant to the extremely low temperatures of LNG (ca. -163 °C) [3]. Therefore, the forming temperature of the plate is 400-430 °C. The hot formed plate is immediately cooled by the air cooling device without removing the upper die until the temperature of the plate decreases to 100-200 °C.
The hot forming process commonly provides less spring-back of the plate after forming and more productivity than the conventional cold forming [4]. Nevertheless, it is very difficult to form the plate into a perfectly spherical shape because of its thermal deformation and elastic recovery during cooling after hot forming [1]. The final curvature of the plate depends on many process variables such as dimension of the initial die surface, the size of the rectangular cells, the initial plate characteristics and the design of the cooling device. Thus, to achieve a proper die and process design, a numerical approach by finite element analysis (FEA) is required for the hot plate forming method.
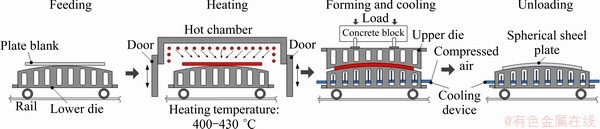
Fig. 1 Hot plate forming process of large thick Al plate using cell-typed die with cooling device
The FEA of the hot plate forming process can be divided into 1) the pure elastic-plastic forming analysis of the plate and 2) its thermal deformation analysis during cooling. In particular, to predict the thermal deformation of the plate precisely, the effects of both the cooling device and the heat transfer between plate and die on the temperature distributions should be perfectly reproduced in the FEA. In this study, the convective heat transfer coefficient (CHTC) and the interfacial heat transfer coefficient (IHTC) were therefore adopted as the representative values of the cooling device with air nozzle and the heat transfer between plate and die, respectively [5,6].
The objective of this study was to develop an FEA technique for the hot plate forming process using a cell-typed upper and lower die with a cooling device. This technique involves the analysis of the plate and air flow inside the die, followed by cooling and thermal deformation analysis of the formed plate. Finally, the small-scale model experiment of a typical hot plate forming is performed to verify the FEA technique.
2 Estimation of interfacial heat transfer coefficient (IHTC)
2.1 Conditions of experiment and FEA
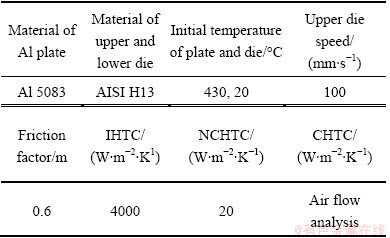
In general, heat transfer between materials and die in hot forming is affected by several parameters, including temperature, contact pressure, lubrication, strain or strain rate, etc. [6]. However, the contact pressure is only considered as a parameter because the hot forming of the plate is performed under the non-lubricant condition, and the deformation realized is smaller than that realized by employing other curved-plate forming processes. Figure 2 shows the dimensions of both the material and the die for a heat transfer test. The IHTC values for various contact pressures were determined by inverse analysis including heat transfer test and its finite element (FE) simulation [6]. The general conditions of the experiment and the FE simulation are listed in Table 1. The plate and the die were made of Al 5083 and AISI H13, respectively [3].
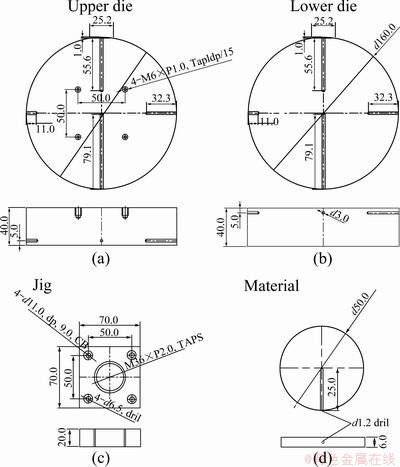
Fig. 2 Dimensions of upper and lower die and material (Al 5083) for interfacial heat transfer test (Unit: mm)
Figure 3 shows the experimental setup employed for measuring the temperature changes in the material at various contact pressures (e.g., 2, 4, 6, 8 and 10 MPa). The experiments were carried out by placing the material between the upper and the lower dies followed by heating at 430 °C. A thermocouple was inserted in the center of the material to measure the temperature during the test. The FE simulations of the heat transfer test were performed using the commercial FE code DEFORM- 2D [7], and the FE model was assumed to be two- dimensional axisymmetric, as shown in Fig. 4.
Table 1 Conditions of interfacial heat transfer test and FE simulation
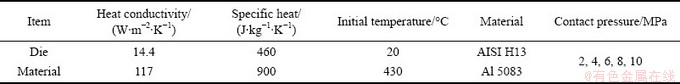
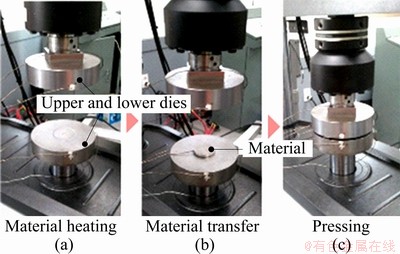
Fig. 3 Experimental process for measuring interfacial heat transfer coefficients
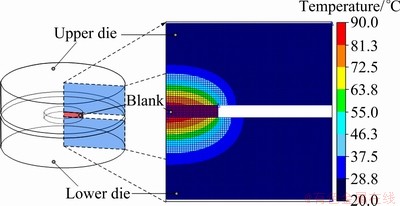
Fig. 4 FE model of interfacial heat transfer test
2.2 Results
Figure 5 shows the temperature profiles of the material (obtained from the heat transfer tests and the FE simulations) for various contact pressures. The results indicated an increase in the cooling speed of the material with the contact pressure. The corresponding IHTC values of the experimental results were 3500, 5000, 6500, 8000 and 8500 W/(m2・K) for 2, 4, 6, 8 and 10 MPa, respectively. Figure 6 shows the variations of the IHTC values with the contact pressure. IHTC values increased linearly by ca. 1500 W/(m2・K) until 8 MPa, and they gradually converged on a constant value (9000 W/(m2・K)) at higher contact pressures. The IHTC values were subsequently used in the FEA of the plate hot forming.
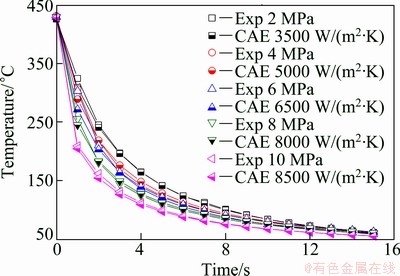
Fig. 5 Comparison of temperature changes in material in heat transfer tests and FE simulations
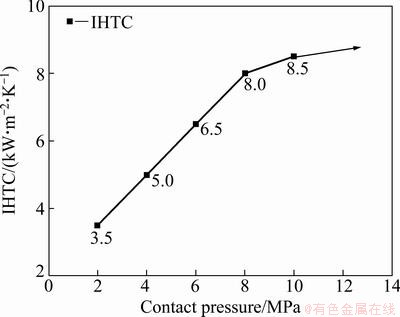
Fig. 6 Variations of IHTC for various contact pressures
3 Estimations of convective heat transfer coefficients (CHTC)
3.1 Conditions of air flow analysis
In general, the heat transfer between the plate and the air released from the cooling nozzle is mostly produced by convection. Definition of the characteristics of air convection through one specific test is challenging as this process depends not only on die structures but also on process and external experimental variables. In this study, the air convection characteristics were therefore estimated by air flow analysis by considering die structure, material temperature, air velocity, and external temperature.
The dimensions of the cell-typed die and the plate used for the air flow analysis are represented in Fig. 7. The dimensions of the plate blank is 250 mm (L) × 250 mm (W) × 6 mm (T), and the radius (R) of the die surface is 1500 mm. The cell dimensions can be calculated as 90 mm× 90 mm, and the thickness of the grid is 10 mm. The distance between the die surface and the cooling nozzle is 25 mm.
Figure 8 shows the initial FE model employed for the air flow analysis. In this model, the plate produced after forming is assumed to show a perfect curvature of R=1500 mm and to ideally contact with the die surface during analysis. The thermal and physical properties of the air [5], the die [8] and the plate [3] used in the flow analysis are listed in Table 2. It is noted that the temperature changes in the die and the plate after and before forming are not considered in this analysis, and this assumption will be subsequently verified in the hot forming analysis. The general jet conditions of air sprayed from the cooling nozzle are listed in Table 3. The analysis is conducted using ANSYS CFX [9] until the plate temperature reaches about 100 °C.
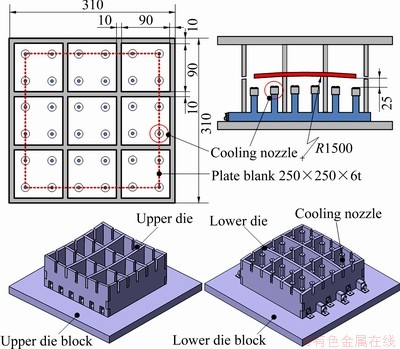
Fig. 7 Dimensions and shape of cell-typed die and cooling device (Unit: mm)
3.2 Results
The distribution of air speeds inside the die is shown in Fig. 9. The air released from the cooling nozzle intensively refrigerated the bottom of the plate and, consequently, it naturally traveled out into the upper die through the gaps between the plate and the lower die. The temperature and CHTC distributions of the plate are represented in Fig. 10. For a total cooling time of 200 s, the maximum and minimum temperatures of the plate are 105 and 97 °C, respectively. Remarkably, noticeable temperature drops in the plate-die contact fields were measured. At this point, the maximum CHTC value (measured at the cooling nozzles location) is 130 W/(m2・K). This CHTC distribution is continuously maintained during the entire analysis (except the first 5 s), and it is applied at the forced cooling condition imposed by the cooling device in the FEA of hot plate forming.
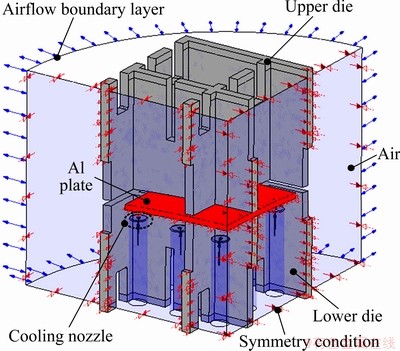
Fig. 8 FE model for airflow analysis
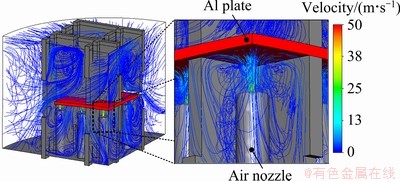
Fig. 9 Velocity distributions of air released by cooling nozzle in air flow analysis
Table 2 Physical properties of air, die and Al 5083
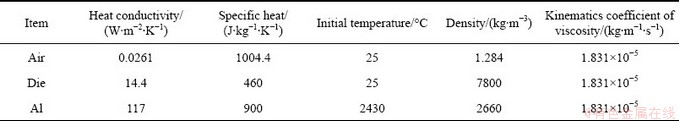
Table 3 Jet condition of compressed air
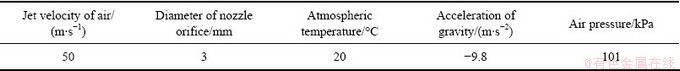
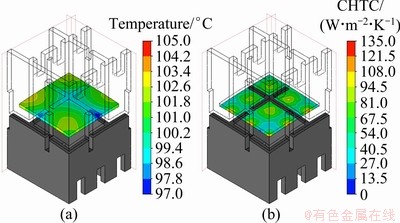
Fig. 10 Temperature (a) and CHTC (b) distributions of Al plate after 200 s in CFX analysis
4 FE analysis of hot plate forming
4.1 Conditions of hot plate forming analysis
First, the hot forming for obtaining a spherical plate was carried out using a cell-typed die with the desired curvature. The forming temperature was 430 °C. The first cooling analysis of the formed plate was subsequently performed without removing the upper die until the temperature of the plate reached ca. 100 °C. Finally, after eliminating the upper die, the second cooling analysis was performed until the plate was cooled to room temperature. The final curvature of the plate was quantitatively measured after this second cooling analysis. The natural convection heat transfer coefficient (NCHTC) of the air in the atmosphere was used in both the hot forming and the second cooling analysis. On the other hand, forced convection heat transfer coefficient (CHTC), which was determined from the previous air flow analysis, was applied to the first cooling analysis to impose the air jet condition for the air released from the cooling device. Initial FE models for the hot forming and cooling analysis of the plate are shown in Fig. 11. In order to reduce the calculation time, only a quarter of the die and the plate were used as FE models since they showed perfect bilateral symmetry. The FE simulations were performed using commercial FE code DEFORM 3D [7] in the non-steady states. The general conditions used for the forming and cooling analyses are listed in Table 4.
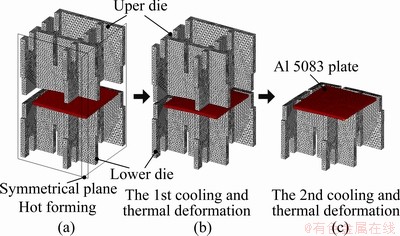
Fig. 11 FE models for hot forming and cooling analysis of Al plate
Table 4 Conditions of hot forming and cooling analysis
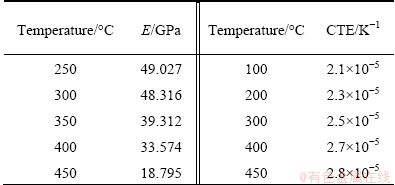
In all the FE simulations performed, the die and the plate were defined to present rigid and heat elastic-plastic behaviors, respectively. The mechanical and thermal behaviors of Al 5083 were used to define its true stress-true strain curves [10] and to determine its elastic modulus (E) and coefficients of thermal expansion (CTE), as shown in Table 5. The friction factor (m) between the die and the plate was assumed to be 0.6, which is the common value for non-lubricant aluminum forming [11].
Table 5 E and CTE of Al 5083 at various temperatures
4.2 Results of hot plate forming analysis
The forming load-stroke curve and the temperature distributions of the plate are shown in Fig. 12. The total forming time was 0.15 s when the upper die accurately went down by the initial thickness of the plate (6 mm). The forming load reached the maximum value of 13.8 kN after a dramatic increase just before the forming completed. Slight temperature changes were observed at the points on the plate that are in contact with the die. However, the initial plate temperature was maintained almost constant almost throughout its surface, as the forming time was very short. Therefore, the previous assumption made regarding the plate and the die temperatures in the air flow analysis is expected to hardly affect the results.
Temperature variations in the plate during the first cooling analysis are represented in Fig. 13 as a function of cooling time. As the temperature of the plate decreased, the differences (td) between its maximum and minimum temperatures gradually reduced. Once the cooling was completed, td was 8 °C and 5 °C for the first cooling and air flow analyses, respectively. The temperature of the plate decreased slightly faster in the air flow analysis than in the first cooling analysis. This can explain the fact that the plate-die contact area was generally reduced by the thermal distortions and the volume loss (thermal contraction) of the plate during first cooling analysis.
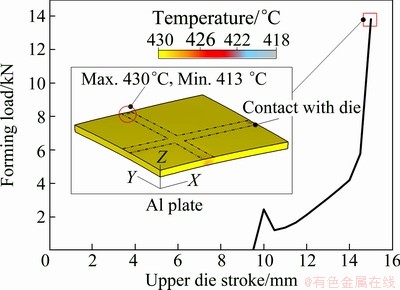
Fig. 12 Forming load-stroke curve and temperature distribu-tions of Al plate after forming analysis
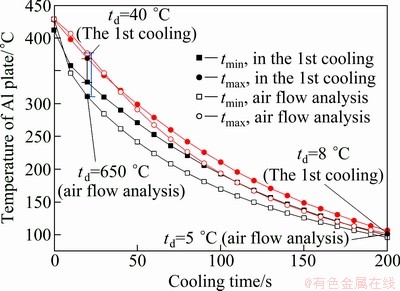
Fig. 13 Maximum and minimum temperatures of Al plate with cooling time in the 1st cooling and air flow analysis
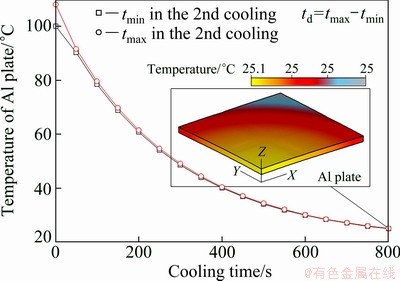
Fig. 14 Maximum and minimum temperatures of Al plate with cooling time during the 2nd cooling
Figure 14 illustrates the differences between the maximum and the minimum temperatures of the plate during the second cooling analysis. The total cooling time required for the plate to reach 25 °C is 800 s. Since there is no upper die, the plate is only in contact with the lower die at a small section in the middle. Therefore, the temperature difference, which is about 0.1 °C, is rarely detected within the plate.
5 FEA of hot plate forming
To verify the analytical results, a hot plate forming experiment was performed using the same cell-typed upper and lower dies, cooling device, and plate previously utilized for FE simulations. Figure 15 shows the experimental setup used in this test, and subsequently, during the hot forming and cooling processes. The cooling nozzle was previously adjusted to afford an air speed of 50 m/s using a hydrometer. A thermocouple (Fig. 15) was inserted at the corner of the plate to measure the temperature during testing. The Al plate was heated to 470 °C in a hot chamber, and then, it was accurately placed at the center of the lower die using a separate jig. The forming test start time was recorded as the time when the temperature of the plate reached proximately 430 °C. The typical experimental procedures and conditions are the same as those for the FEA. The curvatures of two different sections of spherical formed plate are investigated using 3D CMM: one center section taken from the center to both sides of the plate, and another corner section taken from the center of the plate to both corners.
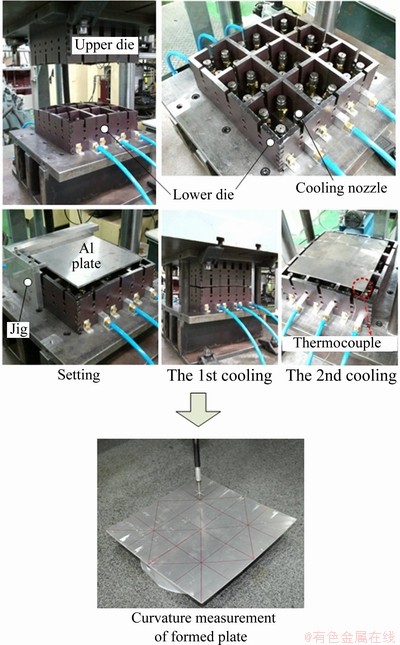
Fig. 15 Experimental set-up of hot plate forming
Figure 16 shows the test (RE) and FE analysis (RA) curvatures for both sections of the plate. Rdie refers to the standard curvature of the lower die. The FEA predicts nearly identical curvatures compared with the experimental values, with maximum deviations of just 0.2512 mm (relative error=0.037%) in the center section and 0.5630 mm (relative error=0.016%) in the corner section. Figure 17 represents the temperature variations at the point at which the thermocouple is inserted in both the experiment and the FEA for all cooling processes. The temperature of the plate during the first cooling is slightly lower in the experiment than in the FEA (DEFORM 3D), whereas the opposite behavior is observed during the second cooling. The td values between the analysis and the experiment are 17.9° C (relative error=17.9%) at 200 s (temperature of the plate=100 °C) and -7.9 °C (relative error=-31.6%) at 1000 s (temperature of the plate=25 °C). Overall, the FEA shows the same cooling trends in the plate temperature as the experimental values do. In particular, the air flow analysis during the first cooling agrees very well with the experiment values, thereby indicating that the effect of air cooling can be properly studied with the CHTC values extracted from the flow analysis.
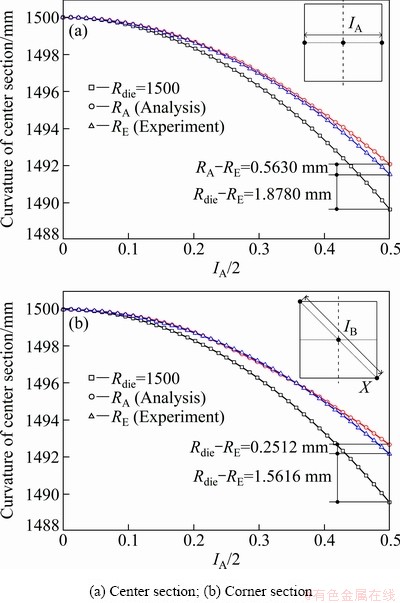
Fig. 16 Curvatures of Al plates measured from analysis and experiment
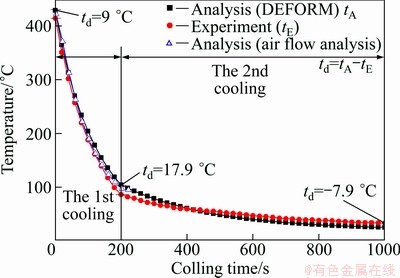
Fig. 17 Temperatures of Al plate (Fig. 16 (a)) in the 1st and 2nd cooling process
6 Conclusions
The convective heat transfer coefficient distributions on the surface of the plate, extracted from the air flow analysis can represent the cooling performance of air jet produced by the cooling device. In addition, IHTC between the material and the die increased linearly by about 1500 W/(m2・K) until 8 MPa, while gradually converging to approximate 9000 W/(m2・K) at higher contact pressures. During the hot plate forming test, the curvature of the plate obtained from the FEA agreed very well with that of the experiment within relative errors of 0.037% and 0.016% for the center and corner sections of the plate, respectively.
References
[1] ANTTILA J. Spherical LNG-tank and a production method for a such tank: US5529239 [P]. 1996.
[2] BAYSINGER F R. Liquefied natural gas tank construction: US4182235 [P]. 1980.
[3] DAVIS J R. Aluminum and aluminum alloys [M]. 3rd edition. USA: The Materials Information Society, 1993: 675-676.
[4] BORAH U, VENUGOPAL S, NAGARAJAN R, SIVAPRASAD P V, VENUGOPAL S, RAJ B. Estimation of springback in double- curvature forming of plates: Experimental evaluation and process modeling [J]. International Journal of Mechanical Sciences, 2008, 50(4): 704-718.
[5] OLIPHANT K, WEBB B W, MCQUAY M Q. An experimental comparison of liquid jet array and spray impingement cooling in the non-boiling regime [J]. Experimental Thermal and Fluid Science, 1998, 18(1): 1-10.
[6] KWON J W, LEE J H, LEE Y S, KWON Y N, BAE W B. A study of interface heat transfer coefficient between die and workpiece for hot forging [J]. Transactions of Materials Processing, 2005, 14(5): 460-465.
[7] DEFORM-2D&3D User’s Manual Ver.10.0 [M]. Ohio: Scientific Forming Technologies Corporation, 2004.
[8] AISI H13 Hot Work Tool Steel [EB/OL]. http://www.matweb.com
[9] ANSYS CFX Turbulence Model Manual, Ver.12.0 [M]. Pittsburgh: ANSYS Inc., 2009.
[10] PRASAD Y V R K, SASIDHARA S. Hot working guide [M]. 1st edition. USA: The Materials Information Society, 1997: 101-103.
[11] LEE J M, KIM B M, KANG C G. Effects of chamber shapes of porthole die on elastic deformation and extrusion process in condenser tube extrusion [J]. Mater & Design, 2005, 26(4): 327-336.
(Edited by HE Xue-feng)
Foundation item: Project (2010-0008-277) supported by the NCRC (National Core Research Center) Program through the National Research Foundation of Korea, funded by the Ministry of Education, Science, and Technology; Project supported by R&D for Technology Development Program of Ministry of Knowledge Economy, Korea
Corresponding author: Byung-Min KIM; Tel: +82-51-5103074; E-mail: bmkim@pusan.ac.kr
DOI: 10.1016/S1003-6326(12)61812-3

