采用延性损伤模型和数值方法预测Ni-Cr基合金在温成形条件下的断裂极限
来源期刊:中国有色金属学报(英文版)2021年第8期
论文作者:Ayush MORCHHALE Anand BADRISH Nitin KOTKUNDE Swadesh Kumar SINGH Navneet KHANNA Ambuj SAXENA Chetan NIKHARE
文章页码:2372 - 2387
关键词:IN625合金;温成形;延性损伤模型;成形性;成形极限图;深拉延;工艺窗口;有限元分析
Key words:IN625 alloy; warm forming; ductile damage models; formability; forming limit diagram; deep drawing; processing window; finite element analysis
摘 要:为了确定IN625合金的安全成形和断裂极限,在300 和673 K下分别进行拉伸成形和深拉延成形实验。将实验获得的基于应力的断裂成形极限图 (FFLD) 转变为基于应力的σ-FFLD和有效塑性应变(EPS) 跟三轴度(η) 的关系曲线,以消除断裂极限对应变的过度依赖。为了预测断裂极限,校准7种不同的损伤模型。结果显示,Oh模型对断裂轨迹的预测能力最好,绝对误差最小。虽然实验得到的断裂极限仅用于数值分析,但没有一个损伤模型预测整个应力三轴度范围(0.33<η<0.66)的断裂应变。在不同的温度和润滑条件下深拉延成形圆柱杯,深拉延工艺窗口有助于确定起皱、安全和断裂区域。在润滑条件下,673 K时达到最大的拉延比2。利用Hill 1948各向异性屈服函数对拉伸成形和深拉延成形过程的数值预测结果均在可接受的误差范围内。
Abstract: The stretch forming and the deep-drawing processes were carried out at 300 and 673 K to determine the safe forming and fracture limits of IN625 alloy. The experimentally obtained strain-based fracture forming limit diagram (FFLD) was transformed into a stress-based (σ-FFLD) and effective plastic strain (EPS) vs triaxiality (η) plot to remove the excess dependency of fracture limits over the strains. For the prediction of fracture limits, seven different damage models were calibrated. The Oh model displayed the best ability to predict the fracture locus with the least absolute error. Though the experimentally obtained fracture limits have only been used for the numerical analysis, none of the considered damage models predicted the fracture strains over the entire considered range of stress triaxiality (0.33<η<0.66). The deep drawing process window helped to determine wrinkling, safe and fracture zones while drawing the cylindrical cups under different temperature and lubricating conditions. Further, the highest drawing ratio of 2 was achieved at 673 K under the lubricating condition. All the numerically predicted results of both stretch forming and deep drawing processes using the Hill 1948 anisotropic yielding function were found to be good within the acceptable range of error.
Trans. Nonferrous Met. Soc. China 31(2021) 2372-2387
Ayush MORCHHALE1, Anand BADRISH1, Nitin KOTKUNDE1, Swadesh Kumar SINGH2, Navneet KHANNA3, Ambuj SAXENA4, Chetan NIKHARE5
1. Department of Mechanical Engineering, Birla Institute of Technology and Science-Pilani,Hyderabad Campus, Hyderabad, India;
2. Mechanical Engineering Department, Gokaraju Rangaraju Institute of Engineering and Technology, Hyderabad, India;
3. Advanced Manufacturing Laboratory, Institute of Infrastructure Technology Research and Management (IITRAM), Ahmadabad, India;
4. Department of Mechanical Engineering, G. L. Bajaj Institute of Technology and Management, Greater Noida, India;
5. Mechanical Engineering Department, the Pennsylvania State University, Erie, PA, United States
Received 18 August 2020; accepted 18 February 2021
Abstract: The stretch forming and the deep-drawing processes were carried out at 300 and 673 K to determine the safe forming and fracture limits of IN625 alloy. The experimentally obtained strain-based fracture forming limit diagram (FFLD) was transformed into a stress-based (σ-FFLD) and effective plastic strain (EPS) vs triaxiality (η) plot to remove the excess dependency of fracture limits over the strains. For the prediction of fracture limits, seven different damage models were calibrated. The Oh model displayed the best ability to predict the fracture locus with the least absolute error. Though the experimentally obtained fracture limits have only been used for the numerical analysis, none of the considered damage models predicted the fracture strains over the entire considered range of stress triaxiality (0.33<η<0.66). The deep drawing process window helped to determine wrinkling, safe and fracture zones while drawing the cylindrical cups under different temperature and lubricating conditions. Further, the highest drawing ratio of 2 was achieved at 673 K under the lubricating condition. All the numerically predicted results of both stretch forming and deep drawing processes using the Hill 1948 anisotropic yielding function were found to be good within the acceptable range of error.
Key words: IN625 alloy; warm forming; ductile damage models; formability; forming limit diagram; deep drawing; processing window; finite element analysis
1 Introduction
Inconel is a nickel chromium-based alloy used in abundance to make various components in the aerospace industry, particularly in Ni-H2 batteries of satellites. These rechargeable batteries are a source of power for satellites. There is a very high possibility of a leak or catastrophic failure when the internal gas pressure reaches approximately 7 MPa. Thus, Inconel alloys such as IN625 and IN718 are used in making the outer casing of the battery as they can handle 2.5 times the highest operating pressure inside the battery [1-3]. The casings are made using metal forming processes. Sometimes, it is not easy to form metals at room temperature because of their very high strength. Thus, warm/ hot forming has been adopted as a remedy to such a problem in the industries [4,5]. The elevated temperature condition helped in easy forming by increasing the formability of the material [6,7].
Many researchers have carried out the stretch forming and deep drawing operations at different testing conditions to determine the exact limiting strains of the material [8-10]. The process parameters selected while performing these operations play a crucial role in determining the exact formability of materials. A large number of experimental trials are required for successfully determining the specific process parameters to get the desired results. This will increase the wastage of material, manufacturing cost, and production time on a commercial scale production. Hence, numerical studies in terms of finite element simulations can be adopted as a tool that will eventually help in producing cost-effective components using forming processes by reducing the rigorous experimental trials [11,12]. While performing the numerical simulations of any forming process, the researchers always suggest performing a study on mesh convergence for predicting the final component and specimen size, thickness distribution, and fracture location of the components. Further, to get final defect-free components and avoid failure in the near future, the knowledge about the sheet metal’s limiting strains is an essential step in designing the whole tooling and process performing sequence.
The limiting strains of the material are often evaluated using stretch forming operation by using specimens deformed under different strain paths. The traditional strain-based forming limit diagram (FLD) is usually assessed based on the reduction in thickness and localized necking during the specimens’ deformation. In their previous work over stretch forming of IN625 under different processing conditions, the authors found that the material failed without any prior hint of necking. Thus, the failure has been predicted based on the fracture forming limit diagram (FFLD) [13]. Several researchers [14-23] have worked over the development of various ductile damage models for accurately evaluating the fracture limits of the considered material deformed under different processing conditions. PANDRE et al [24] used six different ductile fracture criteria to calibrate the fracture limits of DP590 steel at room temperature (RT), 200 °C, and 400 °C. They found that among all the used models, Oh’s criteria can be used in the future for evaluating the fracture limits of the DP590 steel. TAKUDA et al [20] used five different proposed criteria for investigating the failure of cylindrical deep-drawn cups using A5052, A1100, and A2024-T4 alloys. They further found these criteria to be accurately predicting the HDR after implementing the ductile damage models. PRASAD et al [1] also used six models to compare their predicting ability for the fracture limits of the solution-treated IN718 alloy for the aerospace applications. They found Oh’s model to be accurately following the experimentally evaluated fracture limits of the material with the least average absolute error (AAE) of approximately 10%. WU et al [22] used six different damage models to study the failure of material using the hydroforming technique. The Rice-Tracey model was found to have approximate results as those obtained by the experimental approach. To avoid direct dependency over the strain paths, several researchers proposed evaluating critical forming limits in terms of effective plastic strain (EPS) vs triaxiality (η) and named it as η-EPS-FFLD. Additionally, stress-based FFLD (σ-FFLD) is another approach. BAI and WIERZBICKI [21] calibrated and plotted the fracture limits in η-EPS space for different alloys of aluminum and steel and evaluated models’ predictability in terms of AAE. Many earlier proposed fracture models have not considered the anisotropic effect of sheet metals, but recently researchers have succeeded in including the anisotropy in these fracture models [1,25,26]. However, it can be noted that very limited work has been done in this field, and thorough research is required to achieve reliable results, which will directly help sheet metal forming industries.
In the past, several researchers have worked over the strain-based FFLD of IN625. Still, no work is available with respect to the evaluation of σ-FFLD and η-EPS-FFLD at elevated temperature conditions. Thus, in the present work, the stretch forming test has been done to evaluate η-EPS-FFLD and σ-FFLD at 300 and 673 K. The anisotropic parameters were used to predict the fracture limits using seven different ductile damage models, and their validity was further evaluated using AAE. Additionally, the deep drawing processing window has also been determined at different temperatures and lubricating conditions. Lastly, the validation of the fracture limits predicted using the FEA approach for the deep drawing and stretch forming process has been done to reduce rigorous experimental trials and increase the cost-effective manufacturing of the aerospace components.
2 Experimental
Inconel 625 sheet of 1 mm in thickness was used in the present work for all experimental testing. The tensile test was conducted using specimens cut along two different directions at 0° and 90° with respect to the sheet’s rolling direction to find the exact anisotropic material properties of IN625 at 300 and 673 K. The obtained material properties are consolidated in Table 1. Hollomon power law was used for defining the work hardening behavior of the material at both the temperatures as the authors in their previous study [27] found that it closely follows the experimental trend of true stress strain curve with the correlation coefficient to be more than 99%.
A 40 ton hydraulic press was used for experimental deep drawing and stretch forming process. It has an inductive heating coil for high-temperature testing, and a K-type contact thermocouple was used for finding the exact temperature over the whole forming setup. Figure 1(a) represents the schematic diagram of the stretch forming setup and design of specimens used for finding the limiting strains in the present work. It consists of three primary components, namely, a hemispherical punch of 50 mm in diameter, die, and blank holder. For restricting the easy flow of sheet metal, a circular draw bead of 84 mm in diameter was designed over the circular die. Figure 1(b) represents the schematic diagram of deep drawing setup with all necessary dimensions used in the present study. It consists of a flat punch, dies and blank holder plate without any draw bead. The specimen designs for stretch forming were selected based upon ASTM E2218-15 standard and method proposed by PRASAD et al [28]. The molybdenum disulfide based Molykot lubricant was used in this study, as it is stable up to 700 °C. The laser etching process was used to mark the grids of 1.5 mm in diameter over specimens to accurately capture the major and minor strains across the deformed specimens. The deformed grids over all the specimens were measured using an optical microscope with image analyzing software for obtaining major and minor strains. The punch speed was maintained to be 5 mm/min. The results were validated in terms of the drawing height, thickness distribution, and the specimens’ fracture location.
3 Results and discussion
3.1 Fracture and forming limit diagram
Table 1 Material properties of IN625 alloy
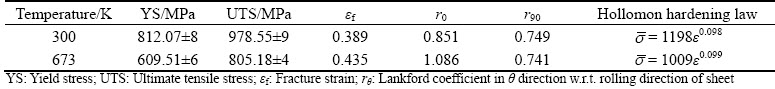
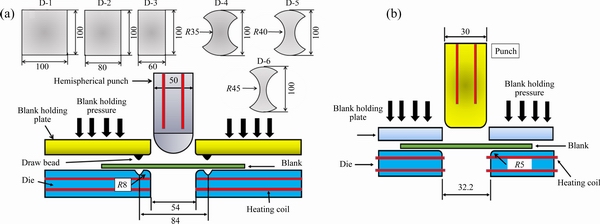
Fig. 1 Schematic diagram of setup for stretch forming (a) and deep drawing (b) process (Unit: mm)
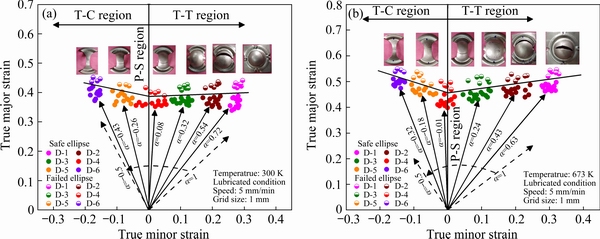
Fig. 2 FLD at 300 K (a) and 673 K (b)
The stretch-forming process was performed at 300 and 673 K forming temperature. The major and minor strains were measured using an optical microscope around the critical region of fracture and then converted into the true strains for obtaining a complete FLD shown in Fig. 2. Different colors and styles of the symbols were assigned to all the six designs and safe and fractured regions. All the samples formed till fracture; hence, the necking region is not visible. All the specimens fractured without any onset of necking at both 300 and 673 K. The FLD was represented by a line separating the safe and fractured points. In the tension- compression (T-C) region, at 300 K in Fig. 2(a), the strain path ratio (α) was obtained to be -0.43 while it rose to -0.32 at 673 K, as shown in Fig. 2(b). Low limiting strains compared to T-T and T-C regions were observed along with the FLD plane strain (P-S) region at both temperatures. This lowest strain point is known as FLD0 and is usually used for representing the formability of the deformed material. The FLD0 displayed an improvement of approximately 17.26% and, hence, the formability of the material with an increase in the temperature from 300 to 673 K. The lubricated condition was used; hence in the T-T region, strains were obtained to be 0.72 and 0.63 at 300 and 673 K, respectively. In all the stretch-formed specimens, the fracture happened to be the thorough-thickness shear-type, which took place without any substantial hint of necking at both the considered forming temperatures. This observation motivated towards a further study of fracture forming limit diagram (FFLD) as discussed by PRASAD et al [28] in previous work over IN718.
The fracture during the stretch forming process is usually assumed to occur in the plane strain, i.e., the change in true strain along the width (minor strain (dε2)) is equal to zero [28]. The true fracture stain along the thickness (ε3) of the specimen was observed under the optical microscope and finally changed into the true fracture strain. Thus, by ultimately using the equation of volume constancy rule (ε1f+ε2f+ε3f=0) the true fracture stain (ε1f) was calibrated and further interposed on the FLD. At 300 K, minimum thickness of T-T region was 0.746 mm while, in the T-C region, it was 0.768 mm. This clearly indicated that in the T-T region, the material undergoes the maximum thinning before the final fracture. A similar decreasing trend in the thickness was observed at 673 K. The FFLD shown in Fig. 3 was drawn as an indication of onset for fracture.
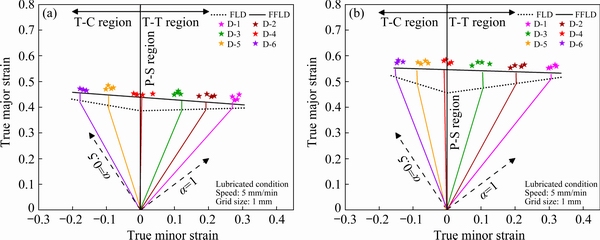
Fig. 3 FFLD at 300 K (a) and 673 K (b)
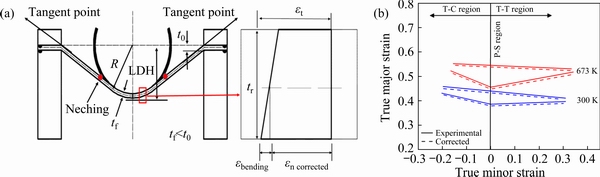
Fig. 4 Schematic representation for bending correction (a) and corrected FLD and FFLD (b)
A sub-sized punch of hemispherical shape (diameter=50 mm) was used for the stretch forming analysis in the present work. Thus, the effect of bending strain on the outer curved convex-shaped surface of stretch formed specimens in the region around the surrounding sub-sized hemispherical punch needs to be considered. It has a very significant effect on the stretching limits of the material [13]. The schematic representation of bending correction is shown in Fig. 4(a). The FLD position over the major strain axis depends highly upon the geometry. Notably, the limiting strain of material depends directly upon the curvature of punch (1/R) upon assuming no thickness variation in the deformed sheet. The bending strains (εbending) are calculated using Eq. (1). The corrected FLD and FFLD are shown in Fig. 4(b). It is drawn after reducing the bending correction strain from the calculated true strains by using Eq. (2). The FLD and FFLD shifted downwards on the major strain axis by approximately 3%-4% at both 300 and 673 K.
 (1)
(1)
 (2)
(2)
The strain distribution across the whole stretch formed specimen is in T-T, P-S, and T-C regions, as shown in Fig. 5. Figure 5(a) shows the curvature along which the surface strain was measured for all the specimens. The initial circular grid marked over specimens deformed in the shape of an ellipse. Hence, an optical microscope with image analyzing software was used for measuring the strains along the major and minor diameters of the deformed ellipse. For the specimen lying in the T-T region, at 300 K, the specimen’s fracture occurred at a distance of 18 mm from the pole.
In contrast, at 673 K, it occurred at a distance of 15 mm; higher strains are observed around these regions due to the strain localization phenomenon. The strains for specimen deformed at 673 K were higher than at 300 K, which indicates that it has gone under more deformation before the final fracture. The specimen lying in the P-S region fractured 15 mm and 21 mm approximately for 300 and 673 K specimens. The minor strain at both temperatures was negligible, confirming that this specimen remains in the plane strain region. Figure 5(d) depicts the strain distribution of the specimen lying in the T-C region. The specimen undergoes lateral drawing, and hence the major and minor true strains were observed to be positive and negative, respectively. The fracture occurred at a distance of approximately 18 and 12 mm from the specimen’s pole. The highest major and lowest minor strains were found near the fracture region at both the forming temperatures in the T-C region specimen case. Thus, it can be concluded that the major and minor strains depend highly upon the forming temperature and the design of the specimen because of the induction of different strain paths during deformation.
3.2 Deep drawing processing window
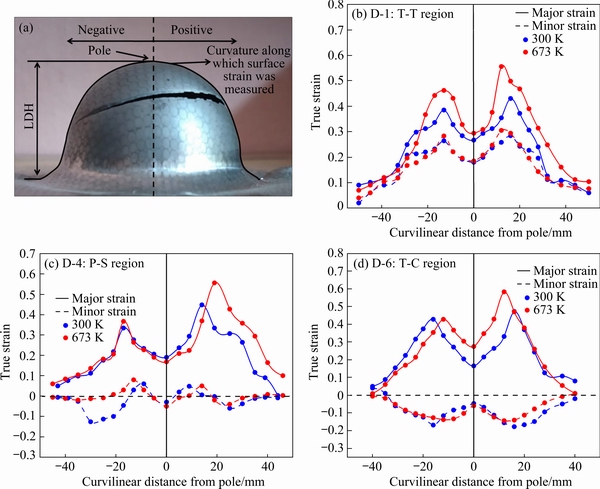
Fig. 5 Surface strain measurement technique (a), and computed surface strain for T-T region (b), P-S region (c), and T-C region (d) specimens
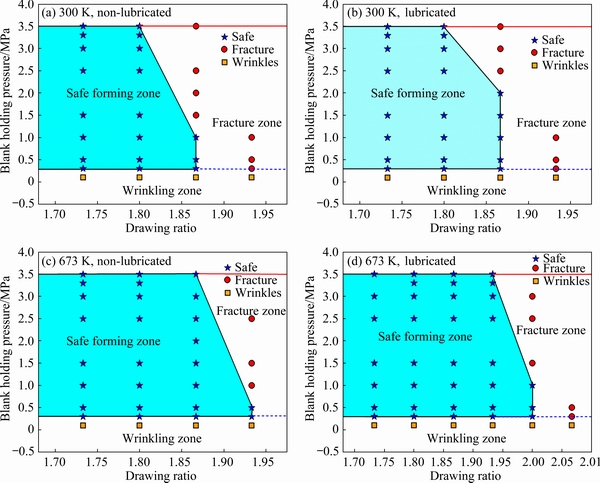
Fig. 6 Processing window for deep drawing process under different temperature and lubricating conditions
The process windows obtained by performing deep drawing experiments under different processing conditions are shown in Fig. 6. All the cups were drawn at different blank holding pressures (BHPs) within the range of 0.1-3.5 MPa pressure and were characterized in different zones, namely, wrinkling, safe, and fracture in the deep drawing process window. All the deep drawing operations were performed until 3.5 MPa pressure. The drawing ratio in the process window corresponds to the ratio of diameter for blank to that of punch. It was observed that the processing temperature, BHP, and lubricating conditions play a vital role in sheet metal forming industries. While performing the deep drawing operation at lower BHP under all the processing conditions, the cups were difficult to form because of the formation of wrinkles, which in turn restricted the easy flow of material under all the considered processing conditions. Finally, this resulted in the cup fracture from the region of the punch corner. The increase in the formation of wrinkles has been observed at large blank diameter, but it can also be compensated and suppressed by increasing the BHP. The cups fractured at higher BHP because of the hindrance in the flow of material and increased the tensile stresses on the cup’s walls above the critical limit [8].
The deep drawing operation was performed at 300 and 673 K and under the lubricated and non-lubricated conditions in the present study. The maximum diameter of 56 mm blank size was observed to be successfully drawn at a BHP of 1.5 MPa at 300 K and non-lubricated lubrication. As a result, the highest drawing ratio (HDR) of 1.867 was observed in Fig. 6(a). The HDR was observed to be the same under the lubricated condition at 300 K (Fig. 6(b)), but the successfully drawn cup was drawn at a higher BHP of 2 MPa. At 673 K, under the non-lubricated condition, the HDR increased to 1.933 at BHP of 0.5 MPa, as shown in Fig. 6(c). But, by using lubrication at 673 K, the HDR was increased to 2, as shown in Fig. 6(d). Thus the HDR was improved by approximately 7.12%. This effective change in the HDR is due to the thermal softening, which made the material soft and helped to ease the material’s easy forming. The lubrication also provided an added advantage for the easy drawing of material in the desired shape. Thus, it is essential to study the process window to select optimum parameters that help in the safe drawing of complex industrial components.
3.3 Theoretical fracture models
In the present work, the Hill 1948 yielding function was used for defining the anisotropic effect of the material. The effective stress can be computed using the Hill 1948 yield criterion as
 (3)
(3)
Further, by inducing Eq. (4) in Eq. (3), the relation between the strain ratios (α=ε2/ε1) can be established with the stress ratio (β=σ2/σ1) as shown in Eq. (5).
Associative flow law,
 (4)
(4)
 (5)
(5)
By utilizing Eq. (6) and imposing the condition of plane stress, the term ξ can be obtained as Eq. (7).
Plastic work per unit volume,
 (6)
(6)
 (7)
(7)
The effective stress  can be evaluated using Hollomon relation defined in Table 1. Further, the ratio of major principle to the effective stress can be defined using Eq. (8).
 (8)
(8)
The ratio of hydrostatic to effective stress is defined using stress triaxiality (Eq. (9)) and it has been extensively used earlier by many researchers for predicting the fracture limit.
 (9)
(9)
Many empirical relations, known as the damage models, have been proposed in the past and have been extensively used in manufacturing industries to predict fracture limits of various metals accurately. Some of the famous models are listed below and are compared in the present study for accuracy in predicting fracture strains at 300 and 673 K.
McClintok model [19]: The mathematical relation defined by MCCLINTOK is given by Eq. (10). He developed this relation by studying the deformation of a cylindrical void over a predefined loading condition and the occurrence of failure due to hydrostatic stress.

 (10)
(10)
Brozzo model [18]: This criterion was a modification of COCKCROFT and LATHAM [14] damage model. They considered a stress function for the calibration of fracture constant, and it is highly dependent upon the maximum tensile and mean stress as shown as Eq. (11).

 (11)
(11)
Oh model [16]: They also proposed a modification in COCKCROFT and LATHAM [14] damage model by normalizing the maximum principle stress with the help of equivalent stress and implied it in the study of various forming processes. The proposed mathematical relation is shown as Eq. (12).
 (12)
(12)
Rice-Tracey model [15]: It is a semi-empirical relationship defined by considering a spherical void in the whole unbound metallic matrix. They found hydrostatic pressure to be responsible for the growth of the assumed void. The fracture ductility was found to be increased rapidly, with a decrease in hydrostatic stress. It is also considered a modification of McClintok's proposed criterion by characterizing material failure using hardening laws. The final Rice-Tracey relation is shown as Eq. (13).


 (13)
(13)
Ko model [17]: The modified Cockcroft and Latham model defines the material’s behavior in case of ductile type fracture by combining the effect of stress triaxiality with the principle stress. It is expressed as
 (14)
(14)
Cockcroft-Latham model [14]: It is the most popular phenomenological based model shown as Eq. (15). It is simple to solve and helps in understanding the true ductility of metals. While solving this criterion, it is assumed that the maximum principal stress has major control over the fracture occurring in the material.
 (15)
(15)
Clift model [29]: They modified the Cockcroft and Latham model by assuming equivalent stress over the fracture of a material shown as Eq. (16). Further, they stated that the ductile fracture starts or initiates when a critical value of the plastic work per unit volume is achieved.
 (16)
(16)
The Cn is a material constant in which n=1-7 and  is an equivalent plastic strain (EPS) on the occurrence of fracture. The experimentally obtained curve is used for validating the fracture locus obtained on applying all the above-discussed models at both 300 and 673 K. Prediction ability has been computed in terms of the AAE percent w.r.t. the experimental values.
The obtained failure strains for different specimens deformed along different deformation paths are further transformed into the EPS. The stress triaxiality was calculated using Eq. (9). Finally, the EPS vs stress triaxiality was obtained at both the considered forming temperatures, as shown in Fig. 7 and named as η-EPS-FFLD. The formability and fracture limit of the material has been observed to be increased with the increase in forming temperature. The triaxiality path for the stretch forming experiments seems to be in the range of 0.33-0.66. The higher value of EPS was observed due to the thermal softening phenomenon occurring at elevated temperatures. A significant deviation in the predicted fracture locus was observed for some of the considered fracture models. At both 300 and 673 K, all the models seem to indicate the fracture locus in the T-C region with average absolute error well within the acceptance limit of 5%. In contrast, none of the used models could predict accurately in the T-T region of η-EPS-FFLD. Hence, nothing particular can be concluded about the suitability of the calibrated fracture locus from η-EPS-FFLD.
Further, for confirming the suitability of ductile damage models, AAE percent w.r.t. the experimentally obtained locus was evaluated and compared in Figs. 7(a, b). The error has been calibrated in 0.33-0.66 stress triaxiality along different paths. At 300 K, the absolute error’s minimum variation has been showcased around the plane strain region except for the Cockcroft- Latham model. It seems to have a minimum error in the T-C region of the η-EPS-FFLD. The Oh model displayed 6.4% AAE, which is the least among all the considered fracture models for predicting the fracture locus. The Cockcroft-Latham model displayed the highest AAE of 33.8% and hence, should be least preferred while predicting the fracture locus of IN625 alloy at 300 K. At 673 K, all the models displayed a large deviation from the experimental fracture limit curve compared to 300 K. The Oh model should be preferred for predicting the fracture locus as it showed the least AAE of 11.4%, while Cockcroft-Latham, Ko, and McClintock model displayed an error of more than 30%, which makes them be least preferred while calibrating the fracture locus of IN625 at 673 K. The fracture behavior at both the temperatures has not been captured exactly by any of the considered models in the whole stress triaxiality range. Thus, the prediction capability of all the considered fracture models is assumed to be poor. Hence, the experimental locus for the fracture strains has been used for further analysis in the present work.
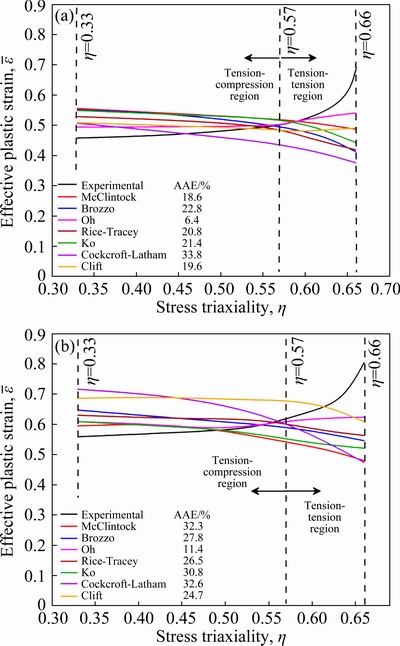
Fig. 7 Comparison of different ductile damage models in η-EPS-FFLD space at 300 K (a) and 673 K (b)
3.4 Fracture prediction using numerical analysis
It is required to validate the developed FEA model for different forming processes, which will ultimately predict the formability and the deformation behavior for IN625. The numerical simulations will reduce the expensive trials at the shop floor levels of manufacturing industries. Thus, ABAQUS 6.13 software was used for FE simulations of deep drawing and stretch forming processes. For reducing the overall computation time, the quarter symmetry simulation was done for both the processes. All the work was carried out at 300 and 673 K forming temperatures for finding the exact limiting strains of IN625 for effective usage of it in different manufacturing industries. The validation of the deep drawing simulated results was done in terms of the thickness distribution, fracture location, and the highest drawing ratio (HDR) of the deep-drawn cups. For stretch forming and deep drawing processes, the tools such as die, blank holder, and punch were considered rigid, and hence R3D4 types of elements were assigned to them. The deformable blanks was meshed using deformable four-node S4R elements. The user- defined material subroutine (UMAT) was used for implementing the Hill 1948 yielding function for the accurate prediction of the forming behavior from the FE approach.
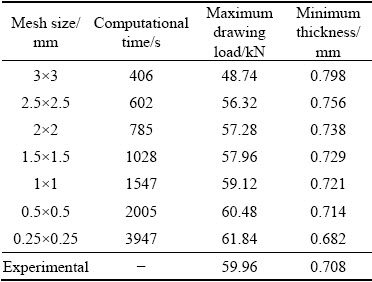
The mesh study has an important role in deciding the numerically simulated results’ overall validity and accuracy. Table 2 represents the mesh convergence study carried out before finalizing the mesh size to carry out all the simulations in the present work. It was carried out for the deep drawing process for the non-lubricating condition at 300 K. The finalized size implemented for the simulation of both deep drawing and stretch forming process in the present work was of 0.5 mm in size under the adaptive meshing technique. It was finalized by comparing the computation time, maximum thinning, and the load required for successfully drawing a cup.
Table 2 Mesh convergence study for deep drawing process for 58 mm blank in diameter at 300 K and non-lubricating condition under 1.5 MPa of BHP
The fracture limits predicted using stress based FFLD (σ-FFLD) and η-EPS-FFLD are discussed below for both the deep drawing and stretch forming processes below.
3.4.1 Stretch forming
Figures 8(a, b) represent the η-EPS-FFLD and σ-FFLD, respectively, at 300 and 673 K. Representative fracture location prediction was done and is shown in the inset in Fig. 8(a) for D-1 and D-5 deformed at 300 K. The D-1, the experimental LDH obtained, was (28±0.54) mm, which further increased to (33.1±0.76) mm at 673 K. The experimental LDH height was measured using a digital gauge. The LDH for D-1 improved by approximately 18.21%, increasing the forming temperature from 300 to 673 K. The LDH obtained for the simulation of the D-1 was 27.52 mm at 300 K. The fracture location also seems to be precisely matching the experimentally obtained position. In the case of D-5 the final LDH obtained was (22.8±0.8) mm at 300 K, which further improved by 17.85% at 673 K. For the numerically simulated D-5 shown in Fig. 8(a), the LDH obtained was 26.87 mm. Thus, the forming at elevated temperature helps in increasing the overall LDH of the specimen.
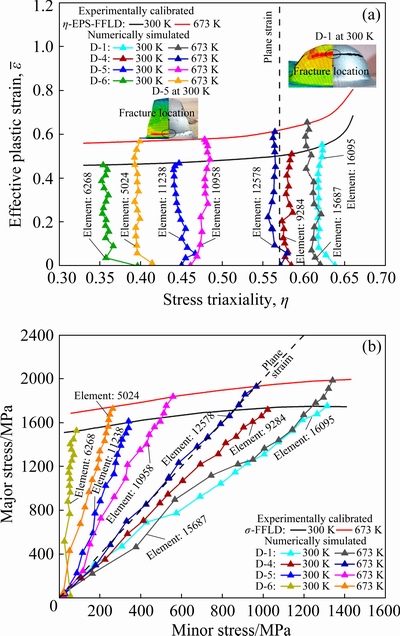
Fig. 8 Deformation path for critical element in η-EPS-FFLD (a) and σ-FFLD (b)
The failure limit of IN625 is showcased in η-EPS and major and minor stress space in Figs. 8(a, b), respectively, at both the considered temperatures. The representative deformation path for D-1, D-4, D-5, and D-6 are shown in Fig. 8. Similarly, the deformation paths can be obtained for D-2 and D-3. The critical elements with the maximum thinning have been identified, and their deformation paths are displayed in Figs. 8(a, b).
This stress-based and triaxiality based deformation path has been constructed by combining the results obtained at different time steps. Different color lines have been used for representing the deformation path for the precise identification at the two specified forming temperatures. The stress ratio and stress triaxiality for all the cases are shown in Table 3. The deformation paths of D-1, D-2, and D-3 were obtained in the biaxial tension region, while those of D-5 and D-6 were obtained in the uniaxial tension region at both the considered temperatures. The D-4 specimen deformed very near to the plane strain region. The fracture was assumed to be initiated when the critical element’s numerically obtained deformation path intersected with the failure limit curves.
The normalized thickness was compared for experimental, and FE simulated stretch formed specimens for D-1, D-4, and D-6 specimens in Figs. 9(a, b, c) respectively at both the considered temperatures. The experimental thickness has been measured using a digital thickness measurement gauge. At 300 K, the deformed specimens displayed more deviation in the thickness than that at 673 K for all the specimens’ designs. The minimum thickness was observed around the necking/fracture region of the specimen. The LDH obtained for all 6 designs of the specimen at both the forming temperatures is shown in Fig. 9(d). The method of measuring the experimental LDH is shown in Fig. 5(a). The LDH has been found to be increasing with the forming temperature. This higher forming ability was achieved due to the material’s thermal softening phenomenon at a higher temperature, which resulted in higher EPS for the material. Thus, the EPS increased from 0.453 at 300 K to 0.544 at 673 K for the specimens deformed in the biaxial tension region.
Similarly, for the D-5 lying under the uniaxial tension region displayed an increase in EPS from 0.393 to 0.475 with increasing the deformation temperature from 300 to 673 K. The LDH of all the simulated specimens was finalized when the critical element’s deformation path intersected the failure limit curve. Thus, the fracture is assumed to be initiated when this intersection condition is achieved. The fracture location for all the simulated stretch-formed specimens at both temperatures was also found to precisely match the experimentally deformed specimens. Thus, the numerical simulation approach seems to capture the fracture behavior of the material at both the considered forming temperatures. Also, the numerically predicted thickness and LDH seem to be matching the experimentally obtained results with an error of less than 5%, which is well within the acceptance limit.
3.4.2 Deep drawing
The deep drawing operation under the lubricating condition was carried out at 300 and 673 K, and the obtained η-EPS-FFLD and σ-FFLD are shown in Figs. 10(a, b), respectively. The fracture predictions shown in Fig. 10(a) were done using 58 and 62 mm diameter blanks for 300 and 673 K as the experimental HDR was observed to be 1.867 and 2, respectively. All the experiments were performed at 1mm/min punch speed. The displayed fractured cups are both drawn at 1 MPa BHP at both the considered conditions. The critical elements for the deep drawing process at both 300 and 673 K have been identified. Their deformation path was tracked at different time steps until the material’s fracture limit is achieved. The intersection of this curve with the deformation path was assumed as the fracture initiation point. The deformation path at 300 K (critical element=5264, η=0.486 and β=0.314) and 673 K (critical element= 7435, η=0.507 and β=0.365) seems to be lying in the uniaxial or the tension-compression region. The EPS to the fracture’s start is 0.475 and 0.581 at 300 and 673 K, respectively. The fracture location for the simulated cup seems to match the experimental results at both the considered forming temperatures. Thus, at higher forming temperatures, lower deforming load and higher formability of material could be achieved.
Table 3 Stress triaxiality (η) and stress ratio (β) for critical elements at both temperatures for all six designs of specimens
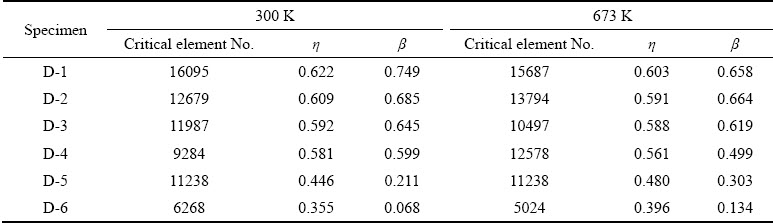
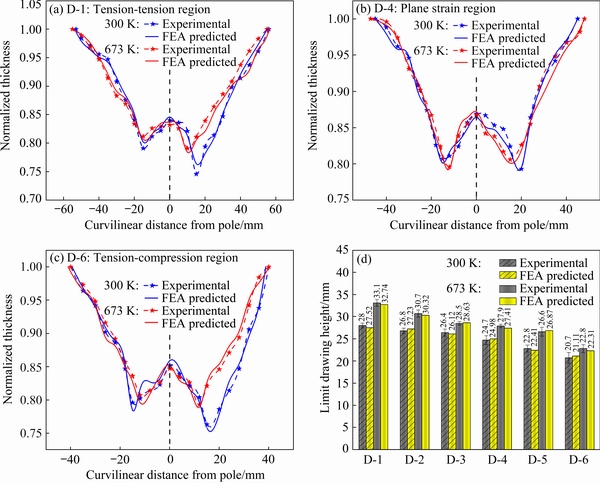
Fig. 9 Thickness distribution for D-1 (a), D-4 (b), D-6 (c) and LDH (d) comparison
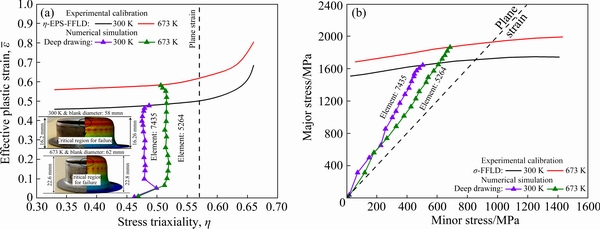
Fig. 10 Deformation path for critical element in η-EPS-FFLD (a) and σ-FFLD (b)
The thickness distribution obtained from the successfully drawn cups with the highest HDR in four conditions considered in the present work for analysis is shown in Fig. 11(a). All the cups are drawn under different conditions displayed a similar trend for the thickness distribution. The thinning near to the base of the cup is less due to the increase in friction between the sheet metal and punch at the point of contact as stated by PRASAD et al [1]. Thus, the material near the base region of the punch will always be constrained, resulting in very less deformation than other regions of the deep-drawn cup. Additionally, the thickness near the cup junction is minimum because of large stretching and subsequently losing contact with the punch corner. This is known as the critical region, and mostly deep-drawn cups fail from this region. More uniformity or less deviation in the thickness has been observed at higher forming temperatures [30]. Further, lubricant provides an added advantage in the deep drawing process as it helps in easy forming by reducing the forming load. In the present case, the cup formed at 673 K under the lubricating condition was found to have the least variation in thickness, highest HDR, and drawn height. The highest and lowest thinning of the critical cup junction region was observed at 300 K under the non-lubricated condition and 673 K under the lubricated condition. The thinning improvement was approximately 11.14% when drawn at 673 K under lubricating conditions compared to 300 K under non-lubricating conditions. The thickness distribution and the drawn height of the simulated cup seem to have an average error of less than 5% for all the considered cases of the present study’s deep drawing process.
Figure 11(b) shows a representative comparison of thickness for the case, 673 K under non- lubricated condition, at three different BHPs, namely, 0.3, 1.2, and 2 MPa. In the deep drawing process, at low BHP (below 0.3 MPa in the present case), the sheet’s thickness became closer to the outer periphery of circular blanks due to the formation of wrinkles. This ultimately led to the restricted flow of material followed by the fracture from the cup junction region. The deep-drawn cup experiences a rapid increase in the tensile stress along the cup’s vertical walls at high pressure. This results in the increase of stress concentration near the contact region of blank and punch, ultimately leading to the fracture of the cup. Thus, the cup’s failure occurs when the generated tensile stress exceeds the material’s load-bearing capacity at the cup junction. The blank holding pressure also seems to have a useful contribution in deciding the thickness distribution across the formed cup. With the increase in BHP, more uniformity in the thickness distribution has been observed. Further, the drawn cups’ minimum thickness also improved by 7.48% with increasing the BHP from 0.3 to 2 MPa. Thus, the determination of optimum BHP is essential to remove any failures in terms of wrinkling and fracture.
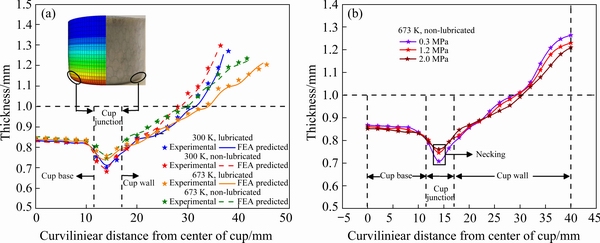
Fig. 11 Comparison of thickness distribution for cups with highest HDR under different deep drawing conditions (a) and under different BHPs (b)
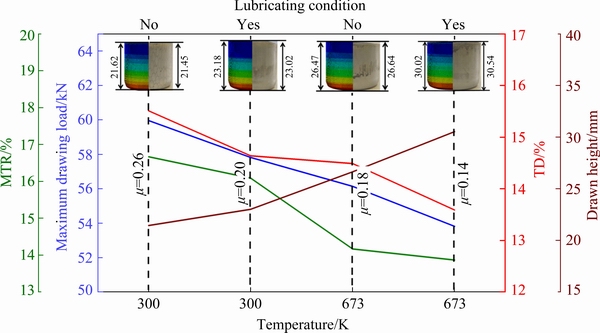
Fig. 12 Comparison of different parameters for cup drawn at highest HDR under various temperature and lubricating conditions
Figure 12 compares the maximum thinning rate (MTR), maximum drawing load, drawn height, and thickness deviation (TD) for successfully drawn cups with the highest HDR under different processing conditions. The drawn height displayed an improvement of 42.37%, while the maximum load required for successful drawing a cup reduced by 10.24% at 673 K and lubricating condition compared to the 300 K and non-lubricating condition. The coefficient of friction for the FE simulation has been calibrated under different conditions using the tribometer. The thickness deviation (TD) and maximum thinning rate (MTR) were evaluated using Eqs. (17) and (18). In the formulation of TD and MTR, the terms ti, tm, tmin and N correspond to the initial thickness, average thickness, minimum thickness, and the total number of observations. The MTR and TD are the parameters for the quantitative comparison of thickness for deep-drawn cups obtained from different forming conditions. The highest and lowest MTR and TD has been observed at 300 K under non-lubricating condition (MTR=16.67% and TD=15.51%) and 673 K under lubricated condition (MTR=13.87% and TD=13.59%). Forming at higher temperatures reduces the deviation in thickness of the cup and induces thermal softening, and reduces strain hardening of the material, resulting in easy forming of material. The lubricating condition further reduces the maximum load needed for forming the cup. Hence, several manufacturing industries performing deep-drawing operation can use elevated temperature and lubricating conditions to get effective deep-drawn components with high product quality.
 (17)
(17)
 (18)
(18)
4 Conclusions
(1) Thorough experimentation was carried out using a stretch forming process under the influence of different process parameters, such as forming temperature, lubricating condition, and forming punch speed for measuring major and minor strains. The limiting strain was majorly affected by the forming temperature as it increased by approximately 18% on increasing the temperature from 300 to 673 K. The obtained strain-based FFLD was transformed into the stress-based locus (σ-FFLD) and effective plastic strain (EPS) vs triaxiality (η) plot (η-EPS-FFLD). The fracture limits in η-EPS-FFLD and σ-FFLD were found to be higher at 673 K forming temperature. This confirmed that elevated temperature condition helps in easy forming by increasing material formability and reducing the deformation load while performing the forming process.
(2) Seven ductile fracture criteria were calibrated for IN625 at 300 and 673 K forming temperature. All the models were found to have a significant deviation from the experimental locus. However, the Oh model displayed the best prediction ability for the fracture limits with least absolute error of 6.4% and 11.4% at 300 and 673 K, respectively. Despite the good prediction ability of fracture behavior, all the considered models could not cover the whole triaxiality (0.33<η<0.66) path. Thus, the experimentally obtained fracture limits were only used for further numerical analysis. From the numerical analysis of the stretch forming process, it has been observed that the predicted thickness distribution and the maximum drawn height were less than 5% error, which is well within the acceptance range. The minimum thickness and surface strain were observed near the fracture position of all the specimens. The LDH was found to be increased by approximately 20% with the forming temperature.
(3) In the deep drawing process, the processing window was determined, and the HDR improved by 7.12% under the combined influence of high temperature and lubricating conditions. The thickness distribution, forming load, and the drawn height were predicted in accordance with the experimentally obtained results. The minimum thickness or the critical region of the deep drawn cups was observed near the cups’ punch corner radius. The combination of forming temperature and lubricating conditions reduced the forming load by 10.24%, increased the uniformity in thickness distribution, and decreased the thinning rate of cups.
Acknowledgments
The authors express their sincere gratitude towards Science and Engineering Research Board, Government of India (ECR/2016/001402) and BITS-Pilani, Hyderabad Campus for financially supporting the present work.
References
[1] PRASAD K S, PANDA S K, KAR S K, MURTY S V S N, SHARMA S C. Prediction of fracture and deep drawing behavior of solution treated Inconel-718 sheets: Numerical modeling and experimental validation [J]. Materials Science and Engineering A, 2018, 733: 393-407.
[2] KANG F, ZHANG G, LI Z, SUN J. Hot deformation of spray formed nickel-base superalloy using processing maps [J]. Transactions of Nonferrous Metals Society of China, 2008, 18: 531-535.
[3] BADRISH C A, MORCHHALE A, KOTKUNDE N, SINGH S K. Prediction of flow stress using integrated JC-ZA constitutive model for Inconel 625 alloy [J]. Materials Today: Proceedings, 2020, https://doi.org/10.1016/j.matpr. 2020.02.140.
[4] KOTKUNDE N, BADRISH A, MORCHHALE A, TAKALKAR P, SINGH S K. Warm deep drawing behavior of Inconel 625 alloy using constitutive modelling and anisotropic yield criteria [J]. Int J Mater Form, 2019, 13: 355-369.
[5] BADRISH C A, MORCHHALE A, KOTKUNDE N, SINGH S K. Experimental and finite element studies of springback using split-ring test for Inconel 625 alloy [J]. Advances in Materials and Processing Technologies, 2020, 6: 540-546.
[6] BADRISH A, MORCHHALE A, KOTKUNDE N, SINGH S K. Parameter optimization in the thermo-mechanical V-bending process to minimize springback of Inconel 625 alloy [J]. Arab J Sci Eng, 2020, 45: 5295-5309.
[7] PANDRE S, KOTKUNDE N, TAKALKAR P, MORCHHALE A, SUJITH R, SINGH S K. Flow stress behavior, constitutive modeling, and microstructural characteristics of DP 590 steel at elevated temperatures [J]. J of Materi Eng and Perform, 2019, 28: 7565-7581.
[8] PRASAD K S, PANDA S K, KAR S K, MURTY S V S N, SHARMA S C. Effect of solution treatment on deep drawability of IN718 sheets: Experimental analysis and metallurgical characterization [J]. Materials Science and Engineering A, 2018, 727: 97-112.
[9] XIAO W C, WANG B Y. Behaviors and modeling of thermal forming limits of AA7075 aluminum sheet [J]. Archiv Civ Mech Eng, 2020, DOI: 10.1007/s43452-020-0009-5.
[10] MAHALLE G, MORCHHALE A, KOTKUNDE N, GUPTA A K, SINGH S K, LIN Y C. Forming and fracture limits of IN718 alloy at elevated temperatures: Experimental and theoretical investigation [J]. Journal of Manufacturing Processes, 2020, 56: 482-499.
[11] LI J, LI C, ZHOU T. Thickness distribution and mechanical property of sheet metal incremental forming based on numerical simulation [J]. Transactions of Nonferrous Metals Society of China, 2012, 22: 54-60.
[12] LUMELSKYY D, ROJEK J, PECHERSKI R, GROSMAN F, TKOCZ M. Numerical simulation of formability tests of pre-deformed steel blanks [J]. Archiv Civ Mech Eng, 2012, 12: 133-141.
[13] BADRISH A, MORCHHALE A, KOTKUNDE N, SINGH S K. Influence of material modeling on warm forming behavior of nickel based super alloy [J]. Int J Mater Form, 2020, 13: 445-465.
[14] COCKCROFT M G, LATHAM D J. Ductility and the workability of metals [J]. J Inst Metals, 1968, 96: 33-39.
[15] RICE J R, TRACEY D M. On the ductile enlargement of voids in triaxial stress fields [J]. Journal of the Mechanics and Physics of Solids, 1969, 17: 201-217.
[16] OH S I, CHEN C C, KOBAYASHI S. Ductile fracture in axisymmetric extrusion and drawing―Part 2: Workability in extrusion and drawing [J]. J Eng Ind, 1979, 101(1): 36-4.
[17] KO Y K, LEE J S, HUH H, KIM H K, PARK S H. Prediction of fracture in hub-hole expanding process using a new ductile fracture criterion [J]. Journal of Materials Processing Technology, 2007, 187-188: 358-362.
[18] BROZZO P, DELUCA B, RENDINA R. A new method for the prediction of formability limits in metal sheets [C]//Proceedings of 7th biennal Conference IDDR. Amsterdam, Netherlands: International Deep Drawing Research Group, 1972.
[19] MCCLINTOK F A. A criterion for ductile fracture by the growth of holes [J]. Journal of Applied Mechanics, 1968, 35(2): 363-371.
[20] TAKUDA H, MORI K, FUJIMOTO H, HATTA N. Fracture prediction in stretch forming using finite element simulation combined with ductile fracture criterion [J]. Arch Appl Mech, 1997, 67: 143-150.
[21] BAI Y, WIEZERBICKI T. A comparative study of three groups of ductile fracture loci in the 3D space [J]. Engineering Fracture Mechanics, 2015, 135: 147-167.
[22] WU Z, LI S, ZHANG W, WANG W. Ductile fracture simulation of hydropiercing process based on various criteria in 3D modeling [J]. Materials & Design, 2010, 31: 3661-3671.
[23] DHARAVATH B, MORCHHALE A, SINGH S K, KOTKUNDE N, NAIK M T. Experimental determination and theoretical prediction of limiting strains for ASS 316L at hot forming conditions [J]. J of Materi Eng and Perform, 2020, DOI: 10.1007/S11665-020-04968-7.
[24] PANDRE S, MORCHHALE A, KOTKUNDE N, SINGH S K. Influence of processing temperature on formability of thin-rolled DP590 steel sheet [J]. Materials and Manufacturing Processes, 2020, 35: 901-909.
[25] PARK N, HUH H, LIM S J, LOU Y, KANG Y S, SEO M H. Fracture-based forming limit criteria for anisotropic materials in sheet metal forming [J]. International Journal of Plasticity, 2017, 96: 1-35.
[26] YANG X, LANG L, LIU K, GUO C. Modified MK model combined with ductile fracture criterion and its application in warm hydroforming [J]. Transactions of Nonferrous Metals Society of China, 2015, 25: 3389-3398.
[27] BADRISH C A, KOTKUNDE N, MAHALLE G, SINGH S K, MAHESH K. Analysis of hot anisotropic tensile flow stress and strain hardening behavior for Inconel 625 alloy [J]. Journal of Materials Engineering and Performance, 2019, 28: 7537-7553.
[28] PRASAD S K, PANDA S K, KAR S K, SEN M, MURTY S V S N, SHARMA S C. Microstructures, forming limit and failure analyses of Inconel 718 sheets for fabrication of aerospace components [J]. J of Materi Eng and Perform, 2017, 26: 1513-1530.
[29] CLIFT S E, HARTLEY P, STURGESS C E N, ROWE G W. Fracture prediction in plastic deformation processes [J]. International Journal of Mechanical Sciences, 1990, 32: 1-17.
[30] MORCHHALE A, KOTKUNDE N, SINGH S K. Deep drawing behavior of IN625 alloy under the influence of different process parameters [C]//IOP Conf Ser: Mater Sci Eng. Seoul, Korea: IOP Sciences, 2020: 967.
Ayush MORCHHALE1, Anand BADRISH1, Nitin KOTKUNDE1, Swadesh Kumar SINGH2, Navneet KHANNA3, Ambuj SAXENA4, Chetan NIKHARE5
1. Department of Mechanical Engineering, Birla Institute of Technology and Science-Pilani, Hyderabad Campus, Hyderabad, India;
2. Mechanical Engineering Department, Gokaraju Rangaraju Institute of Engineering and Technology, Hyderabad, India;
3. Advanced Manufacturing Laboratory, Institute of Infrastructure Technology Research and Management (IITRAM), Ahmadabad, India;
4. Department of Mechanical Engineering, G. L. Bajaj Institute of Technology and Management, Greater Noida, India;
5. Mechanical Engineering Department, the Pennsylvania State University, Erie, PA, United States
摘 要:为了确定IN625合金的安全成形和断裂极限,在300 和673 K下分别进行拉伸成形和深拉延成形实验。将实验获得的基于应力的断裂成形极限图 (FFLD) 转变为基于应力的σ-FFLD和有效塑性应变(EPS) 跟三轴度(η) 的关系曲线,以消除断裂极限对应变的过度依赖。为了预测断裂极限,校准7种不同的损伤模型。结果显示,Oh模型对断裂轨迹的预测能力最好,绝对误差最小。虽然实验得到的断裂极限仅用于数值分析,但没有一个损伤模型预测整个应力三轴度范围(0.33<η<0.66)的断裂应变。在不同的温度和润滑条件下深拉延成形圆柱杯,深拉延工艺窗口有助于确定起皱、安全和断裂区域。在润滑条件下,673 K时达到最大的拉延比2。利用Hill 1948各向异性屈服函数对拉伸成形和深拉延成形过程的数值预测结果均在可接受的误差范围内。
关键词:IN625合金;温成形;延性损伤模型;成形性;成形极限图;深拉延;工艺窗口;有限元分析
(Edited by Xiang-qun LI)
Corresponding author: Nitin KOTKUNDE, E-mail: nitink@hyderabad.bits-pilani.ac.in
DOI: 10.1016/S1003-6326(21)65660-1
1003-6326/  2021 The Nonferrous Metals Society of China. Published by Elsevier Ltd & Science Press

